-
Paper Information
- Paper Submission
-
Journal Information
- About This Journal
- Editorial Board
- Current Issue
- Archive
- Author Guidelines
- Contact Us
International Journal of Genetic Engineering
p-ISSN: 2167-7239 e-ISSN: 2167-7220
2025; 13(3): 52-56
doi:10.5923/j.ijge.20251303.04
Received: Mar. 19, 2025; Accepted: Apr. 12, 2025; Published: Apr. 18, 2025

Cluster Analysis of Morpho-Economic Characteristics in Some Subspecies and F1 Hybrids Belonging to the G.hirsutum L. Species
 Abstract
 Reference
 Full-Text PDF
 Full-text HTML
Qodirjon Komiljonovich Ashirov1, Bakhtiyar Khushbakovich Amanov2, Nilufar Muydinovna Tursunova2
1Andijan Institute of Agriculture and Agrotechnologies, Andijan, Uzbekistan
2Chirchik State Pedagogical University, Tashkent, Uzbekistan
Correspondence to: Nilufar Muydinovna Tursunova, Chirchik State Pedagogical University, Tashkent, Uzbekistan.
| Email: |  |
Copyright © 2025 The Author(s). Published by Scientific & Academic Publishing.
This work is licensed under the Creative Commons Attribution International License (CC BY).
http://creativecommons.org/licenses/by/4.0/

This article demonstrated that some subspecies and varieties belonging to G.hirsutum L. species were divided into 2 cluster groups based on morpho-economic characteristics, and F1 hybrids were divided into 3 cluster groups. Based on the initial sources, it was determined that the Euclidean distance ranged from 0,2-2,9 units, while in F1 hybrids, this distance ranged from 0,3-26,1 units. During the experiment, it was found that individual selection based on each characteristics when evaluating the morpho-economic traits of initial sources and F1 plants often does not lead to accurate conclusions, сluster analysis, on the other hand, allows for the selection of samples that are close to each other based on the relationship between these characteristics and multiple traits. Furthermore, when selecting a form for the initial source, it is possible to use hybrids within a cluster group, rather than a single variety, to transfer a specific trait.
Keywords: Cotton, Subspecies, Variety, Hybrid, Generation, Genotype, Cluster, Valuable economic traits, Raw cotton in one boll, Fiber length, Fiber yield, 1000 seed weight
Cite this paper: Qodirjon Komiljonovich Ashirov, Bakhtiyar Khushbakovich Amanov, Nilufar Muydinovna Tursunova, Cluster Analysis of Morpho-Economic Characteristics in Some Subspecies and F1 Hybrids Belonging to the G.hirsutum L. Species, International Journal of Genetic Engineering, Vol. 13 No. 3, 2025, pp. 52-56. doi: 10.5923/j.ijge.20251303.04.
Article Outline
1. Introduction
- In these days, cotton cultivation areas are increasing because its high profitability and growing demand are beneficial for agriculture. Cotton cultivation technologies and methods are constantly improving, which increases its productivity. This technological crop is widely used in various industries around the world. One of the main advantages of cotton is its fiber, which is used in the production of yarn, fabric, and other products. Cotton also has seeds with high nutritional value and oil content, making it very important for the feed industry. Therefore, cotton is a crop that plays a significant role in the global economy.While cotton was previously grown mainly for fiber production, its other values are currently being explored. Through technologies and specific research, new prospects related to cotton are being developed, which further increases its relevance. Research on genetic modification of cotton, creating pest-resistant varieties, and adapting them to climate change is one of the most pressing issues in these days. Scientists have also demonstrated through their research that it is possible to obtain new forms and valuable sources with beneficial traits and characteristics through interspecific and intraspecific hybridization [2,3,4,6,7,10,13,15].Furthermore, scientists have determined that the fertility efficiency of hybrid bolls and seed from hybrid bolls in intraspecific and interspecific hybridization of cotton species, the positive or negative outcome of the results, depends on the phylogenetic proximity or distance of the species involved in the hybridization and the physiological characteristics of the initial sources [12].In research studies, a variety of G.hirsutum cotton was crossed with cultivated diploid species having A1, А2 genomes, resulting in the production of sterille triploids. These hybrids, after chromosome doubling using colchicine to overcome sterility G.hirsutum L. x G.herbaceum, G.arboreum L. x G.hirsutum L. amphiploids were crossed with G.hirsutum L., resulting in forms close to the valuable economic traits of the G.hirsutum L. species. In recent years, as a result of research conducted in our country, the fertility and seed results of hybrid bolls were studied based on intraspecific and interspecific hybridization of G.herbaceum L. and G.arboreum L. intraspecific diversity. Transgressive forms with valuable economic traits were identified and recommended as initial sources in practical breeding research [14].It has been noted that the genetic patterns identified in hybrids of one group of cotton varieties based on quantitative traits may differ in hybrids of another group of varieties, and the genetic-breeding indicators relate to the degree of dominance, epistasis, combining ability, heritability, and others [1].On the other hand, the placement of the first fruiting branch at the lower node, a morphological trait of cotton, is considered a sign of early maturity for varieties, and a strong correlation between early maturity and heat resistance has been noted [9,11].Besides, to assess the genetic diversity of yield traits of cotton, it was found that genetic variability among genotypes is significantly expressed using the cluster analysis method, which indicates that yield can be increased by using genotypes from different clusters in hybridization [8].For 40 genotypes of species G.hirsutum L., 15 quantitative traits were observed to separate into 7 cluster groups. Clusters I and III each contained 8 genotypes, and cluster VII contained 7 genotypes. Based on hierarchical cluster analysis, all genotypes were grouped into 7 clusters, where clusters VII each contained 13 genotypes and cluster IV contained 8 genotypes. The random distribution of genotypes indicates a lack of parallelism between geographic and genetic diversity [5].
2. The Object and the Methods of the Research
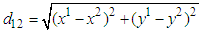
- Cluster analysis, a biostatistical method, is a software program that encompasses various algorithms used to classify objects under study. By applying these operations, the initial commonality of selected objects is divided into clusters, or groups of similar objects. The complexity of the cluster method lies in the fact that the objects studied for research are multidimensional. That is, they are described by not one, but several indicators, and their grouping into clusters is carried out in multidimensional space.In our experiment, we used the Statgraphics computer program to cluster varieties, employing Euclidean distance as a measure of genetic proximity and Ward’s method as the clustering technique. The Statgraphics computer program is a convenient tool for statistical data analysis, allowing us to determine mean values, standard deviations, standard errors, confidence levels, and other statistical information.Theoretical basis of cluster analysis: As is known from multivariate statistics, the natural measure of distance between objects is the Mahalanobis distance. Euclidean distance is a special case of the Mahalanobis distance. Geometric interpretation of Euclidean distance between two points (traits) x and y: The Euclidean distance (d12) between genotypes (x1, y1, and x2, y2) obtained for the two analyzed traits is determined using the Pythagorean theorem:
 If n traits are measured in the plants of two populations (where n is the number of traits), then the following formula arises for n-dimensional space:
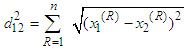 | (1) |
 and
and  represent the average value of the R trait in the first and second populations.If the units if measurement for the studied traits are different, then the Euclidean distance becomes meaningless. Therefore, the trait values are divided by the deviation from the square root of the pooled variance for both populations.
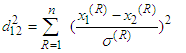 | (2) |
3. The Results of the Research
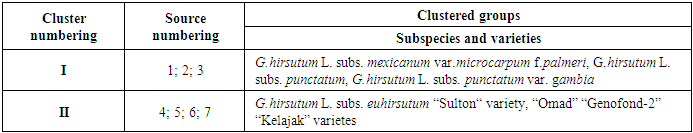
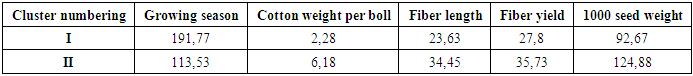
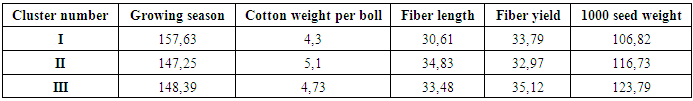
- The minimum number of cluster groups combining the analyzed initial sources and F1 hybrids was 3, and the maximum number was 9. The indicators of traits such as plant growth period, cotton weight per boll, fiber length, fiber yield, and 1000 seed weight were determined for these varieties and F1 hybrids, and cluster analysis was performed (Tables 1, 2).
|
|
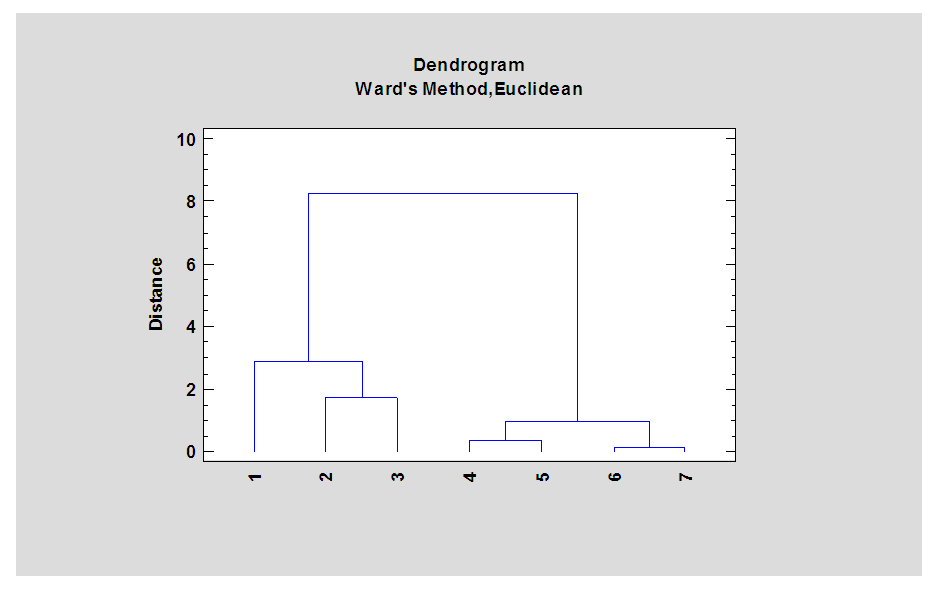 | Figure 1. Dendrogram of cluster separation based on morpho-economic traits of initial sources |
|
|
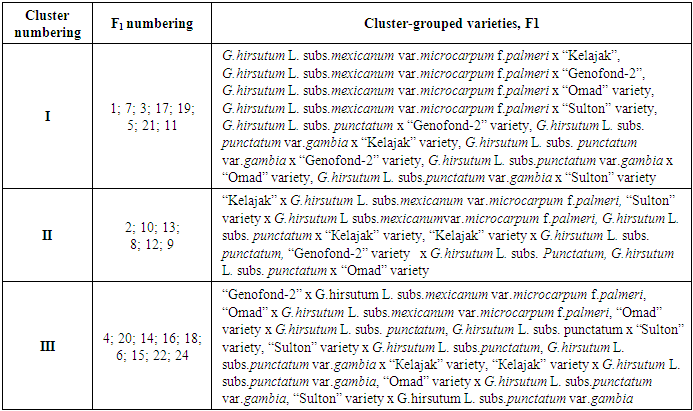
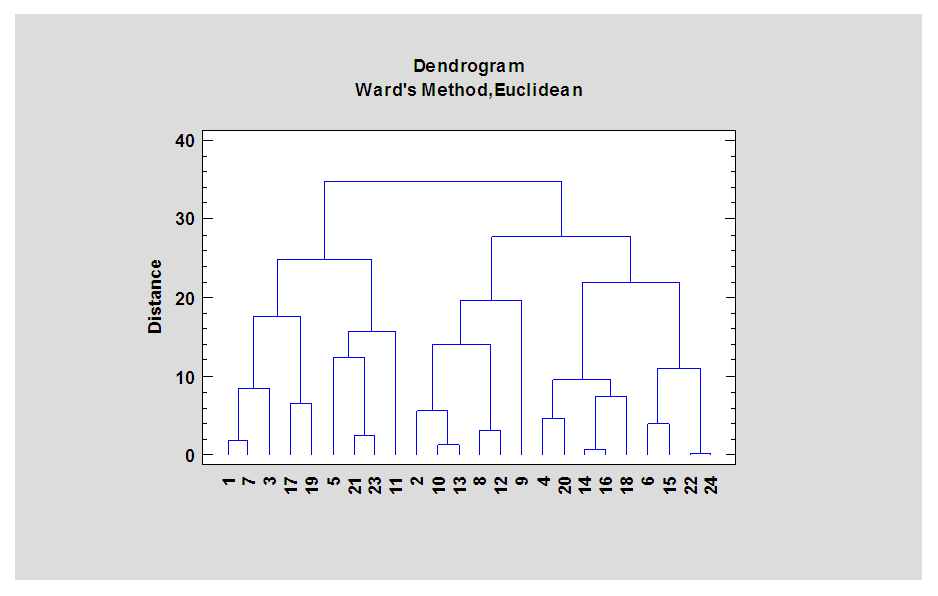 | Figure 2. Dendrogram of F1 hybrids clustered by morpho-economic traits |
4. Conclusions
- Our research revealed that the studied varieties were divided into 2 cluster groups based on morpho-economic traits, and the F1 hybrids were divided into 3 cluster groups. It was found that the Euclidean distance for the initial sources ranged from 0.2 to 2.9 units, while for the F1 hybrids, this distance ranged from 0.3 to 26.1 units. During the experiment, it was observed that evaluating the morpho-economic traits of the initial sources and F1 plants by selecting each trait individually often does not lead to accurate conclusions. Cluster analysis, on the other hand, allows for the selection of samples that are close to each other in terms of several traits and their interrelationships. This makes it possible to use not just one variety, but a group of hybrids within a cluster to transfer a specific trait when selecting a form for the initial source.