-
Paper Information
- Paper Submission
-
Journal Information
- About This Journal
- Editorial Board
- Current Issue
- Archive
- Author Guidelines
- Contact Us
International Journal of Genetic Engineering
p-ISSN: 2167-7239 e-ISSN: 2167-7220
2024; 12(4): 48-53
doi:10.5923/j.ijge.20241204.02
Received: May 19, 2024; Accepted: Jun. 11, 2024; Published: Jun. 13, 2024

Health Impact Assessment of the Surface Water Pollution in Nukus, Karakalpakstan
 Abstract
 Reference
 Full-Text PDF
 Full-text HTML
Jamila Turdimuratova, Yakub Ametov, Sharipa Ayimbetova, Akmaral Alpısbaeva, Aygul Jumabaeva
Faculty of biology, Karakalpak State University named after Berdakh, Nukus, Uzbekistan
Correspondence to: Yakub Ametov, Faculty of biology, Karakalpak State University named after Berdakh, Nukus, Uzbekistan.
| Email: |  |
Copyright © 2024 The Author(s). Published by Scientific & Academic Publishing.
This work is licensed under the Creative Commons Attribution International License (CC BY).
http://creativecommons.org/licenses/by/4.0/

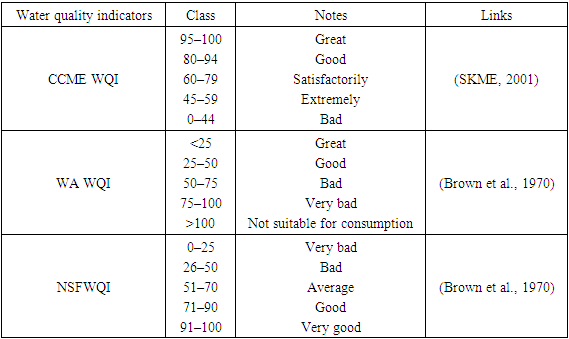
This manuscript assessed the water quality of the Doslik Canal in the city of Nukus, Karakalpakstan using the water quality index for the period from 2016 to 2024. Three methods were used to calculate the water quality index: the weighted arithmetic water quality index, the National Sanitation Foundation water quality index, and the Canadian Council of Ministers of the Environment water quality index. The research looked at some parameters to develop the water quality index: for WAWQI pH, fluoride, copper, alkalinity, turbidity, nitrate-nitrogen (NO3-N), total hardness, biological oxygen demand (BOD) and dissolved oxygen (DO). For NSFWQI, pH, DO, BOD5, phosphate (PO43-), nitrate-nitrogen (NO3-N), dry matter and temperature, and for determining CCMWQI, the parameters pH, DO, BOD5, nitrate-nitrogen (NO3-N), fluoride, copper, alkalinity, total hardness, chloride and turbidity measured at three different points (S1-S2-S3) of the Doslik Canal. The water quality of the Doslik Canal was observed to vary from excellent to good in summer and winter, and from poor to unfit for human consumption during the rainy season. Recommendations are proposed for improving water quality and effective management of water systems resources in the period under review. The data obtained can be used to develop measures to protect the environment and ensure sustainable development of the region in the future.
Keywords: Water quality assessment, Doslik Canal, Physico-chemical parameters, Water quality indicators, Diseases
Cite this paper: Jamila Turdimuratova, Yakub Ametov, Sharipa Ayimbetova, Akmaral Alpısbaeva, Aygul Jumabaeva, Health Impact Assessment of the Surface Water Pollution in Nukus, Karakalpakstan, International Journal of Genetic Engineering, Vol. 12 No. 4, 2024, pp. 48-53. doi: 10.5923/j.ijge.20241204.02.
Article Outline
1. Introduction
- Surface water is any liquid water that is found on the surface of the earth, including ocean water and water contained in inland bodies of water such as rivers, streams, lakes, swamps and ponds. Liquid surface water makes up more than 97% of the Earth's hydrosphere, 96% of which is salt water from the oceans, and only 1.1% is fresh liquid water [1,2]. Of this 1.1% fresh water, 99% is groundwater, while only 1% is fresh surface water [1,3]. However, fresh surface water plays a key role in shaping the environment and supporting diverse life forms on the Earth [4]. Freshwater is fundamental to all living organisms, human health, food production and most industrial processes [4,5].Surface water pollution is a significant environmental issue that has far-reaching consequences on human health and well-being. The indiscriminate dumping of industrial effluents and other waste materials into water bodies has led to the deterioration of water quality, with serious implications for public health. Understanding the sources, fate, and concentrations of contaminants in surface water is crucial for assessing the health risks associated with exposure to these pollutants. [6]. Examining the surface water environment with a focus on protecting public health can help emphasize the importance of pollution control efforts. Assessing the health benefits of controlling surface water pollution can help gauge the impact of policies and actions, offering valuable guidance for water management practices. Past research has laid the groundwork for understanding the connection between surface water pollution and health risks at both national [7,8] and localized levels [9,10].However, due to rapid population growth and socio-economic development, the demand for limited fresh surface water is rapidly increasing. Due to emissions caused by human and industrial activities, the condition of water in rivers and canals is deteriorating, negatively affecting the lives of people and aquatic life.Therefore, continuous monitoring and control of the quality of fresh surface waters is a priority for all countries of the world [11,12]. Water quality monitoring is a mandatory procedure, including analysis of physicochemical and microbiological parameters. There are several statistical approaches to the study of water parameters, including multivariate methods that identify factors that have a significant impact on water quality, as well as analysis of spatiotemporal variations, data reduction, data sampling and grouping [13,14,15,16,17].Water quality index includes a variety of physical, chemical and biological parameters to evaluate water quality using various mathematical equations [18]. WQI was first proposed by Horton (1965) [19], Brown and colleagues (1970) [20], and since then many different methods for calculating WQI have been developed. Most often, calculating water quality indicators requires two steps. First, it is necessary to convert the selected water quality characteristics into sub index values. These values are then aggregated to produce an overall water quality index. A new method for calculating WQI was proposed by researchers [21,22]. The following water quality indices are used worldwide: National Sanitation Foundation Water Quality Index (NSFWQI), Canadian Council of Ministers of the Environment Water Quality Index (CCMEWQI), British Columbia Water Quality Index (BCWQI), Oregon Water Quality Index (OWQI), Weighted Arithmetic Water Quality Index (WAWQI) [23,24,25].In this paper, we use the systematic data on main diseases and water quality of the city of Nukus. Research has been carried out to study the influence of various physicochemical and biological indicators on the water quality of the Doslik Canal, and the suitability of this water for human consumption is also discussed based on the water quality index indicators. Methods such as the Weighted Arithmetic Water Quality Index (WAWQI), the National Sanitation Foundation Water Quality Index (NSFWQI), and the Canadian Council of Ministers of the Environment Water Quality Index (CCMEWQI) were used to calculate WQI [26,27]. At the same time, the results of the water quality index and disease data received from the Ministry of Health of the Republic of Karakalpakstan were analyzed.
2. Research Methodology
2.1. Research Area
- Urban areas play a central role in driving Nukus's economic growth and efforts to manage water pollution. As a result, this study evaluates the health implications of surface water pollution on a city-specific scale. This research focused on the Doslik Canal, which is the source of drinking water in the city of Nukus. The Doslik Canal is a main canal in the Republic of Karakalpakstan. It takes water from the Amu Darya. The length of the canal is 25.2 kilometers, the maximum throughput is 500 m³/s (according to other sources - 900 m³/s). The average water flow in 1993 was 153 m³/s, in 1994—128 m³/s. The depth of the channel is 5 meters. It is located between 59°36'45' to 59°38'15' East longitude and 42°22'38' to 42°34'27' North latitude [28]. For 2022, water flow is 63.34 m3/s [29].
3. Materials and Methods of Analysis
- In this research, a total of 311 water samples were collected from three different sampling points (S1–S3) between 2016 and 2023 using standard sampling methods (GOST 31861-2012) [30]. Selection was carried out monthly with an interval in the middle of the month.Site-1: located next to the Tashkent hotel (42°27′2819″ latitude and 59°36′05.1″ longitude). There is no serious anthropogenic impact.Site-2: (42°28′16.7″ latitude and 59°35′50.0″ longitude). This place is located next to the madrasah “MUHAMMAD IBN AHMAD AL-BERUNIY”.Site-3; (42°30′44.5″ latitude and 59°35′21.5″ longitude). This place is located next to “Karakalpak Suw Tamiynati” LLC.
3.1. Laboratory Analysis
- Laboratory tests were carried out in the laboratory of Sanitary Epidemiological Welfare and Public Health of the city of Nukus. Observations were carried out regularly to analyze parameters such as temperature, pH, dissolved oxygen and turbidity to assess the extent of contamination. Other parameters including total dissolved solids (TDS), total hardness, alkalinity, chloride, phosphate (PO43−), nitrate (NO3−) and biochemical oxygen demand were analyzed according to established standards and procedures. Fluoride, copper, phosphate, nitrate and turbidity were measured by UV spectrophotometry (UV 1200. China), and BOD5 and DO were determined by iodometric titration. pH was measured using a 150 pH meter. All measuring instruments were calibrated using standard solutions from Uzhydromet.
3.2. Weighted Arithmetic Water Quality Index (WAWQI)
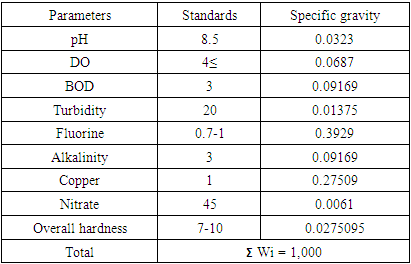
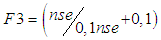
- One of the most commonly used approaches to calculate WQI is the weighted arithmetic index method. This method allows water to be classified according to purity based on the most commonly analyzed water quality parameters. This approach is entirely based on the importance of each parameter. This study took into account 9 parameters and their compliance with drinking standards of SanRaN of the Republic of Uzbekistan No. 0200-06 [31], which are presented in Table 1. Relative weights are determined by values inversely proportional to the level of the standard for each parameter.
|
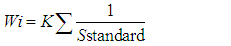 | (1) |
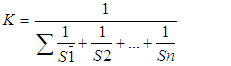 | (2) |
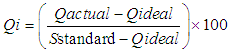 | (3) |
 | (4) |
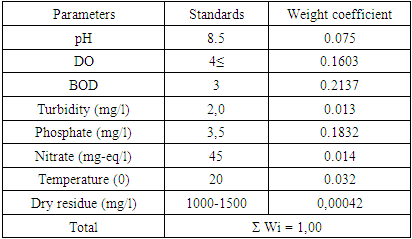
3.3. National Sanitation Foundation Water Quality Index (NSFWQI)
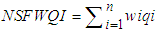
- To calculate the Water Quality Index (WQI), the National Sanitation Foundation used nine different parameters: nitrate-nitrogen, pH, dissolved oxygen, chloride, phosphate, biological oxygen demand, turbidity and alkalinity, and the calculation is expressed by the following equation:
 | (5) |
 | (6) |
|
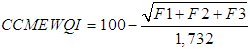
3.4. Canadian Council of Ministers of the Environment Water Quality Index (CCMEWQI)
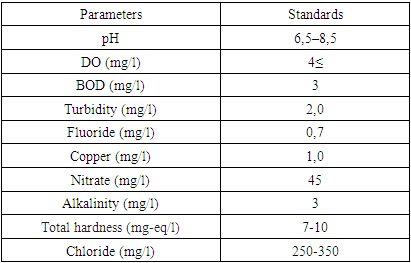
- In 2001, the Canadian Council of Environment Ministers introduced the CCMEWQI water quality index, based on the British Columbia WQI concept [35]. The CCMEWQI does not record specific parameters, but they are selected depending on the purpose and data availability [36]. Thus, this index allows you to set various reference goals, which in turn determine the input parameters depending on their availability and local characteristics [37,38,39,40].The CCMEWQI is determined by selecting specific sets of parameters that are determined by the relevance and availability of the data for potable drinking purposes. For water samples taken in 2016 and 2023, seven parameters were selected (pH, Cl-, HCO3-, TH, F-,NO3-, Cu) respectively. These parameters and their standards are described in Table 3.
|
 | (7) |
 | (8) |
 | (9) |
 | (10) |
|
4. Results and Discussion
4.1. Water Quality Index (WQI)
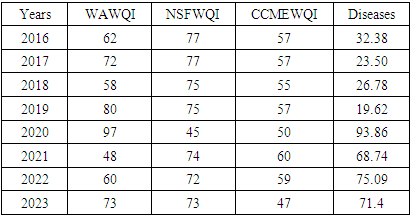
- Taking into account drinking water quality standards of SanRaN No. 0200-06, samples were assessed, which showed that most indicators were within acceptable limits. WQI results for the eight analyzed physicochemical parameters of the Doslik Canal in sections S1–S3 are presented in Table 3.
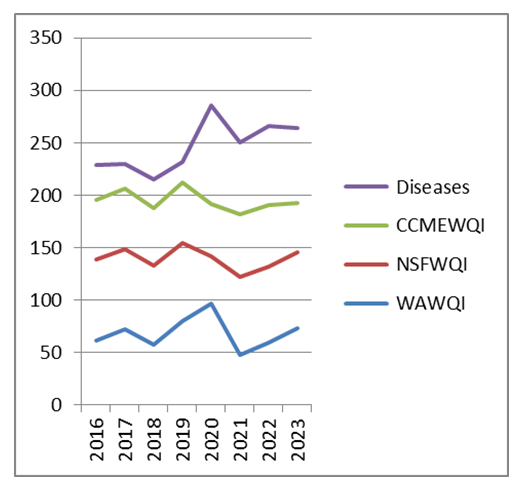 | Figure 1. The comparison WQIs of the three methods and diseases |
5. Conclusions
- During the research of surface water quality, analyzes of various physicochemical and biological parameters were carried out, and various methods for calculating water quality indices were applied. The results obtained allow us to draw the following conclusions: Assessing surface water quality is an important aspect of environmental sustainability and human health. Methods for calculating water quality indices, such as the Weighted Arithmetic Index (WAWQI), the National Sanitation Foundation Water Quality Index (NSFWQI), and the Canadian Council of Ministers of the Environment Water Quality Index (CCMEWQI), allow for a comprehensive assessment of water quality. The study results showed that surface water quality may vary depending on the year and assessment methodology, highlighting the need for ongoing monitoring and control of water resources. Further research in the area of assessing the quality of surface waters can contribute to the development of effective measures to protect the environment and ensure the sustainable use of water resources. Thus, the study and assessment of surface water quality plays an important role in maintaining ecological balance and ensuring human well-being, which requires a systematic approach and constant attention to this problem. Improving the quality of surface water has the potential to reduce disease and improve overall community health.
ACKNOWLEDGEMENTS
- We would like to acknowledge Sanitary and Epidemiological welfare and public health of the city of Nukus.
DISCLOSURE
- This section is ONLY for those who requested disclosure. The name of the experts that reviewed your paper, in case they accepted selling disclosure to you, will appear here. Each reviewer is allowed to make their own price for that, since that is a public endorsement of your findings and may be used for varied purposes.
References
| [1] | Dooge, J. C. (Ed.). (2009). Fresh surface water. Eolss Publishers Company Limited. |
| [2] | Ball, P. (2015). H2O: A biography of water. Hachette UK. |
| [3] | Berner, K. B., & Berner, R. A. (1996). Global Enviromental: water, air and geochemical cycles. New Jersey, USA. Practice Hall, 376. |
| [4] | Ahmed, D. S. (2016). River water quality report, department of environment, river water quality report. department of environment. Department of environment. https://doe.portal.gov.bd |
| [5] | Nguyen, T. G., & Huynh, T. H. N. (2022). Assessment of surface water quality and monitoring in southern Vietnam using multicriteria statistical approaches. Sustainable Environment Research, 32(1), 1-12. https://doi.org/10.1016/j.fsi.2022.01.006. |
| [6] | Ritter, Keith Solomon, Paul Sibley, Ken Hall, Patricia Keen, Gevan Mattu, Beth Linton, L. (2002). SOURCES, PATHWAYS, AND RELATIVE RISKS OF CONTAMINANTS IN SURFACE WATER AND GROUNDWATER: A PERSPECTIVE PREPARED FOR THE WALKERTON INQUIRY. Journal of Toxicology and Environmental Health, Part A, 65(1), 1–142. https://doi.org/10.1080/152873902753338572. |
| [7] | Ebenstein, A., 2012. The consequences of industrialization: evidence from water pollution and digestive cancers in China. Rev. Econ. Stat. 94 (1), 186–201. https://doi.org/10.1162/REST_a_00150. |
| [8] | Wang, Z., Gu, W., Guo, X., Xue, F., Zhao, J., Han, W., Li, H., Chen, W., Hu, Y., Yang, C., Zhang, L., Wu, P., Chen, Y., Zhao, Y., Du, J., Jiang, J., 2023a. Spatial association of surface water quality and human cancer in China. NPJ. Clean. Water. 6 (1), 53. https://doi.org/10.1038/s41545-023-00267-5. |
| [9] | Liu, L., 2010. Made in China: cancer villages. Environ. Sci. Policy Sustain. Dev. 52 (2), 8–21. https://doi.org/10.1080/00139151003618118. |
| [10] | Lu, Y., Song, S., Wang, R., Liu, Z., Meng, J., Sweetman, A.J., Jenkins, A., Ferrier, R.C., Li, H., Luo, W., Wang, T., 2015. Impacts of soil and water pollution on food safety and health risks in China. Environ. Int. 77, 5–15. https://doi.org/10.1016/j. envint.2014.12.010. |
| [11] | Ly, K., Larsen, H., & Van Duyen, N. (2016). 2014 Lower Mekong Regional Water Quality Monitoring Report. |
| [12] | Behmel, S., Damour, M., Ludwig, R., & Rodriguez, M. J. (2016). Water quality monitoring strategies—A review and future perspectives. Science of the Total Environment, 571, 1312-1329. https://doi.org/10.1016/j.scitotenv.2016.06.235. |
| [13] | Razmkhah, H., Abrishamchi, A., & Torkian, A. (2010). Evaluation of spatial and temporal variation in water quality by pattern recognition techniques: A case study on Jajrood River (Tehran, Iran). Journal of environmental management, 91(4), 852-860. https://doi.org/10.1016/j.jenvman.2009.11.001. |
| [14] | Ogwueleka, T. C. (2015). Use of multivariate statistical techniques for the evaluation of temporal and spatial variations in water quality of the Kaduna River, Nigeria. Environmental monitoring and assessment, 187, 1-17. https://doi.org/10.1007/s10661-015-4354-4. |
| [15] | Sheikhy Narany, T., Ramli, M. F., Aris, A. Z., Sulaiman, W. N. A., & Fakharian, K. (2014). Spatiotemporal variation of groundwater quality using integrated multivariate statistical and geostatistical approaches in Amol–Babol Plain, Iran. Environmental monitoring and assessment, 186, 5797-5815. https://doi.org/10.1007/s10661-014-3820-8. |
| [16] | Sharma, A., Bora, C. R., & Shukla, V. (2013). Evaluation of seasonal changes in physico-chemical and bacteriological characteristics of water from the Narmada River (India) using multivariate analysis. Natural Resources Research, 22, 283-296. https://doi.org/10.1007/s11053-013-9204-x. |
| [17] | Bărbulescu, A., Postolache, F., & Dumitriu, C. Ș. (2021). Estimating the precipitation amount at regional scale using a new tool, Climate Analyzer. Hydrology, 8(3), 125. https://doi.org/10.3390/hydrology8030125. |
| [18] | Yogendra, K., & Puttaiah, E. T. (2008). Determination of water quality index and suitability of an urban waterbody in Shimoga Town, Karnataka. In Proceedings of Taal2007: The 12th world lake conference (Vol. 342, p. 346). |
| [19] | Horton, R. K. (1965). An index number system for rating water quality. J Water Pollut Control Fed, 37(3), 300-306. |
| [20] | Brown, R. M., McClelland, N. I., Deininger, R. A., & Tozer, R. G. (1970). A water quality index-do we dare. Water and sewage works, 117(10). |
| [21] | Zagatto, P. A., Lorenzetti, M. L., Perez, L. S. N., Menegon Jr, N. M., & Buratini, S. V. (1998). Proposal for a new water quality index. Internationale Vereinigung für theoretische und angewandte Limnologie: Verhandlungen, 26(5), 2449-2451. https://doi.org/10.1080/03680770.1995.11901194. |
| [22] | Štambuk-Giljanović, N. (1999). Water quality evaluation by index in Dalmatia. Water Research, 33(16), 3423-3440. https://doi.org/10.1016/S0043-1354(99)00063-9. |
| [23] | Abbasi, S. A. (2002). Water quality indices, state of the art report. Scientific Contribution No. INCOH/SAR-25/2002. Indian Institute of Technology, Roorkee. |
| [24] | Kannel, P.R., Lee, S., Lee, YS. et al. (2007). Application of Water Quality Indices and Dissolved Oxygen as Indicators for River Water Classification and Urban Impact Assessment. Environ Monit Assess 132, 93–110. https://doi.org/10.1007/s10661-006-9505-1. |
| [25] | Lumb, A., Halliwell, D. & Sharma, T. (2006). Application of CCME Water Quality Index to Monitor Water Quality: A Case Study of the Mackenzie River Basin, Canada. Environ Monit Assess 113, 411–429. https://doi.org/10.1007/s10661-005-9092-6. |
| [26] | Lumb, A., Halliwell, D. & Sharma, T. Application of CCME Water Quality Index to Monitor Water Quality: A Case Study of the Mackenzie River Basin, Canada. Environ Monit Assess 113, 411–429 (2006). https://doi.org/10.1007/s10661-005-9092-6. |
| [27] | Sharifi M. (1990). Assessment of surface water quality by an index system in Anzali basin. The hydrological basis for water resources management. Proc., symposium, Beijing, 1990, pp.163-171, https://www.scopus.com/inward/record.uri?eid=2s2.00025656798&partnerID=40&md5= d3cf562b2951cbdead20590ad6963b15. |
| [28] | https://ru.wikipedia.org/wiki/Кызкеткен_(канал). |
| [29] | Ministry of Water Resources. |
| [30] | GOST 31861-2012. Water. General sampling requirements. https://files.stroyinf.ru/Data2/1/4293785/4293785467.pdf ysclid=lqceihio2w949543355. |
| [31] | SanRaN RUz № 0200-06. Sanitary rules and hygienic standards assessments, determinations of classes of surface and underground water sources, their selection for centralized domestic and drinking water supply to the population of Uzbekistan. 2006. |
| [32] | Chabuk, A., Al-Madhlom, Q., Al-Maliki, A., Al-Ansari, N., Hussain, H. M., & Laue, J. (2020). Water quality assessment along Tigris River (Iraq) using water quality index (WQI) and GIS software. Arabian Journal of Geosciences, 13, 1-23. https://doi.org/10.1007/s12517-020-05575-5. |
| [33] | Judran, N. H., & Kumar, A. (2020). Evaluation of water quality of Al-Gharraf River using the water quality index (WQI). Modeling earth systems and environment, 6(3), 1581-1588. https://doi.org/10.1007/s40808-020-00775-0. |
| [34] | Ali Abed, S., Hussein Ewaid, S., & Al-Ansari, N. (2019, September). Evaluation of water quality in the Tigris River within Baghdad, Iraq using multivariate statistical techniques. In Journal of Physics: Conference Series (Vol. 1294, p. 072025). IOP Publishing. DOI 10.1088/1742-6596/1294/7/072025. |
| [35] | Canadian Council of Ministers of the Environment, organizador. Canadian Water Quality Guidelines for the Protection of Aquatic Life: CCME Water Quality Inex 1.0 users manual. Hull, QC: CCME; 2001. 5 p. (Publication / Canadian Council of Ministers of the Environment). |
| [36] | Mooselu, M. G., Liltved, H., Nikoo, M. R., Hindar, A., & Meland, S. (2020). Assessing optimal water quality monitoring network in road construction using integrated information-theoretic techniques. Journal of Hydrology, 589, 125366. https://doi.org/10.1016/j.jhydrol.2020.125366. |
| [37] | Boyacioglu, H. (2010). Utilization of the water quality index method as a classification tool. Environmental monitoring and assessment, 167, 115-124. https://doi.org/10.1007/s10661-009-1035-1. |
| [38] | Dascalescu, I. G., Morosanu, I., Ungureanu, F., Musteret, C. P., Minea, M., & Teodosiu, C. (2017). Development of a versatile water quality index for water supply applications. Environmental Engineering and Management Journal, 16(3), 525-534. DOI 10.30638/eemj.2017.053. |
| [39] | Mostafaei, A. (2014). Application of multivariate statistical methods and water-quality index to evaluation of water quality in the Kashkan River. Environmental Management, 53, 865-881. https://doi.org/10.1007/s00267-014-0238-6. |
| [40] | Salcedo-Sánchez, E. R., Garrido Hoyos, S. E., Esteller Alberich, M. V., & Martínez Morales, M. (2016). Application of water quality index to evaluate groundwater quality (temporal and spatial variation) of an intensively exploited aquifer (Puebla valley, Mexico). Environmental monitoring and assessment, 188, 1-20. https://doi.org/10.1007/s10661-016-5515-9. |
| [41] | CCME. (2001). Canadian Sediment Quality Quidelines for the Protection of Aquatic Life: Summary Tables Updated in Canadian Environmental Quality Guidelines 1999. |
| [42] | Guan Y, Zhang N, Chu C, Xiao Y, Niu R, Shao C. Health impact assessment of the surface water pollution in China. Sci Total Environ. 2024 Jul 10; 933: 173040. doi: 10.1016/j.scitotenv.2024.173040. Epub 2024 May 9. PMID: 38729374. |