-
Paper Information
- Previous Paper
- Paper Submission
-
Journal Information
- About This Journal
- Editorial Board
- Current Issue
- Archive
- Author Guidelines
- Contact Us
International Journal of Genetic Engineering
p-ISSN: 2167-7239 e-ISSN: 2167-7220
2023; 11(1): 5-10
doi:10.5923/j.ijge.20231101.02
Received: Jan. 22, 2023; Accepted: Feb. 10, 2023; Published: Feb. 15, 2023

Molecular Genetic Evaluation of Wheat Varieties Based on SSR Markers
 Abstract
 Reference
 Full-Text PDF
 Full-text HTML
Jumanov Г. T., Abdukarimov A. O., Ablakulova N. A., Khojiboboeva S. H., Kushiev H. H.
Laboratory of Experimental Biology, Gulistan State University, Uzbekistan
Correspondence to: Abdukarimov A. O., Laboratory of Experimental Biology, Gulistan State University, Uzbekistan.
| Email: |  |
Copyright © 2023 The Author(s). Published by Scientific & Academic Publishing.
This work is licensed under the Creative Commons Attribution International License (CC BY).
http://creativecommons.org/licenses/by/4.0/

In this research work, genomic DNA from samples of 10 varieties of soft wheat was extracted by the STAB method. Quantitative and qualitative indicators of the isolated DNA were determined by spectrophotometric (Nootropic) and visual (gel electrophoresis) methods. PCR amplification was carried out on the basis of 10 pairs of SSR markers (Simple sequence repeat), in which isolated DNA samples were associated with wheat salt resistance genes. PCR products were analyzed by gel electrophoresis. The information structure of polymorphism(PIC) and heterozygosity(he) of the selected SSR markers were determined in the piccalc program. Based on the genetic polymorphism data obtained on the basis of SSR markers, a phylogenetic family tree of varieties was compiled using the UPGMA methodology with the help of Mega X program.
Keywords: Soft wheat, Salinity, SSR markers, PCR, Phylogenetic family tree
Cite this paper: Jumanov Г. T., Abdukarimov A. O., Ablakulova N. A., Khojiboboeva S. H., Kushiev H. H., Molecular Genetic Evaluation of Wheat Varieties Based on SSR Markers, International Journal of Genetic Engineering, Vol. 11 No. 1, 2023, pp. 5-10. doi: 10.5923/j.ijge.20231101.02.
Article Outline
1. Introduction
- Soft wheat (Triticum Aestivum L.)- one of the most widely grown and consumed food crops on earth. The choice of varieties suitable for soil and climatic conditions, resistant to stressors, allows you to get a high and high-quality harvest. Traditional methods require a lot of time and painstaking work when choosing varietal samples. The advantage of molecular genetic approaches to the creation of plant varieties in a short time and the selection of varieties resistant to conditions has been demonstrated by many researchers. On the other hand, the use of molecular genetic and biotechnological methods makes it possible to obtain relatively fast and accurate results, as well as to conduct a complete assessment of varieties and select samples suitable for soil and climatic conditions.Accordingly, today special attention is paid to the use of molecular genetic methods in the selection or creation of suitable conditions, productive wheat varieties to meet the needs of the population in food. To do this, it is necessary to identify the genes or QTL (Quantitative Trait Loci) loci associated with valuable farm traits and identify the DNA markers attached to them [1-3]. The application of DNA marker technology to practical selection is called MBS (marker-based selection). Using this method, the breeder will be able to direct the desired gene to the genotype of interest to him when introduced into any variety and, as a result, create a new variety, line or source resource that he wishes.The technology of barcoding (genetic passport) based on DNA markers serves to solve many problems existing in agriculture. Molecular identification of plant varieties of the genus of soft wheat (Triticum Aestivum) is an important factor in the successful management of germplasm resources and targeted breeding programs [4,5]. To date, hundreds of wheat varieties have been bred in our country, and it is not possible to fully differentiate them phenotypically. Although the created varieties differ in a number of characteristics, most of them look the same externally. This, in turn, creates various inconveniences for the authors of the variety and its breeders. In this aspect, it is important to create a molecular passport of wheat varieties, this technology allows you to study the variety of varieties, to identify inter-variety differences molecular.
2. Objects and Methods of the Research
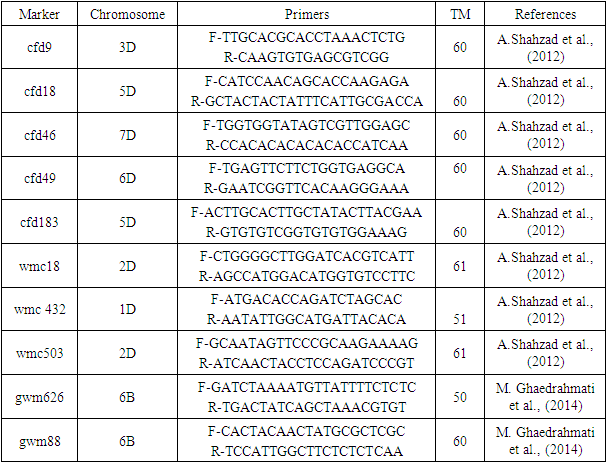
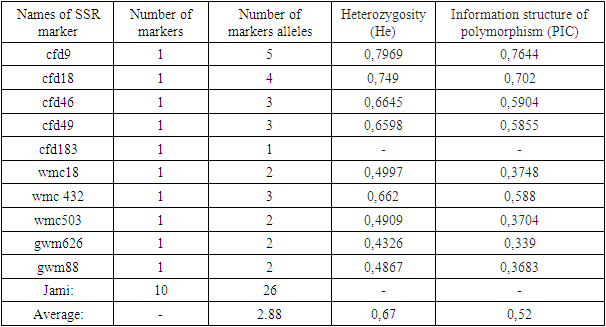
- The object of the research. Based on morphobiological characteristics, the domestic varieties Gazgan, Babur, Druzhba, Turkestan, Omad, Bunyodkor and varieties Antonina, Zvezda and Grekum created by breeders of the Russian state, widely cultivated in the grain fields of the Syrdarya region, as well as the Agro27 line created by scientists of the Kashkadarya Southern Research Institute of Agriculture, were selected as the object of research. The plant material was obtained from the collection of the Genbank of salt-resistant plants of the laboratory “Experimental Biology” of Gulistan State University.In order to define the genetic distinction (polimorfism) among the types of wheat altogether 10 pairs of SSR primers have been selected from the base TaSSRDb (triticum aestivum simple sequence data base) http://webtom.cabgrid.res.in/wheatssr/) (Table 1).
|
3. Methods of the Research
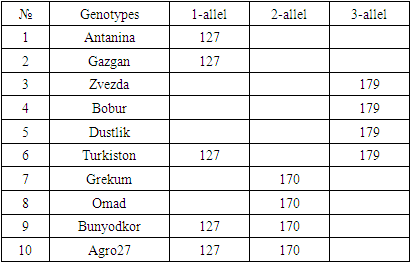
- DNA isolation. Young leaf tissues of the selected varieties were collected, and genomic DNA was isolated from them in the following order, based on a modified version of the STAB method [8]:1. Leaf samples collected from 100 mg- were stored in the refrigerator for at least 12 hours in - 20°C.2. The plant tissue was thoroughly crushed using a whisk with nitrogen liquid3. An extraction buffer of STAB 600 µl was added and thoroughly mixed4. Stored in the autoblot at 60-65°C for about 20-24 minutes (stirring every 10 minutes)5. 800 ml of chloroform / isoamyl alcohol is added in a ratio (24:1) (mixed manually until a homogeneous layer is formed), placed in a centrifuge at a speed of 12,000 a / min for 7 minutes to separate the aqueous and chloroform phases6. 600 ml are taken into a new 1.5 ml tube, chloroform / isoamyl (24: 1) is added from above in a ratio of 1:1 and placed in a centrifuge at a speed of 12,000 Ail/min for 7 minutes7. 600 µl is taken into a new 1.5 ml tube, 600 µl isopropanol is added, slowly stirred and left at 4°C8. The sample was centrifuged at a speed of 12,000 a/min for 10 minutes and isopropanol was carefully drained9. Added 800 µl of 75% ethanol10. Centrifugation at 12,000 rpm for 10 minutes11. Stage 10 was repeated for the 2nd time12. Air drying of sludge (drying equipment)then a 1/10-fold te buffer from 50 to 100 µl was added, depending on the size of the DNA (the tube can be turned upside down or made vortex to release DNA)13. Aged at room temperature for 1 hour14. RNase 1 ml (10 mg/ml) was added, then stored at 37°C for 30 minutes15. DNA was stored at 4°C for short-term use (per month) and at - 20°C for long-term use (in years).Spectrophotometric measurement. Advanced molecular biology techniques require clean and fast DNA extraction. Many of them have difficulty isolating DNA due to the high content of secondary metabolites, such as polysaccharides, polyphenols, in plant tissues. Phenolic compounds, as well as protein substances, prevent subsequent reactions (PCR) in molecular genetic studies. To carry out the PCR reaction on DNA samples extracted from plants, the optimal indicator is the concentration of DNA above 20 ng /ml, the purity index is 1.8-2.0 in the ratio of 260/280, 1.8-2.2 in the ratio of 260/230. In addition, the value of 260/280 above the established norm (up to 2.5) does not pose a problem for PCR [9].In the processes of nucleic acid extraction, residual chemical contamination can lead to an overestimation of the concentration of nucleic acids and/or negatively affect the subsequent analysis. The spectrophotometric analysis of DNA evaluates its concentration and degree of purity. When assessing the level of DNA purity, the A260 / a280 ratio was used to determine the degree of protein contamination. Also, the A260 / A230 ratio is used to determine the degree of contamination with other organic substances (chemicals used for extraction and secondary plant metabolites).In the spectrophotometric analysis of DNA, the ratio of concentration, purity (a260/a280 ratio) and absorption (a260/A230 ratio) was measured using a nanodropone c spectrophotometer (Thermo Scientific, USA), taking 2 µl from each sample.After spectrophotometric measurement, genomic DNA extracted from each sample was examined by electrophoresis in 0.9% agarosagel. The concentrations of the isolated genomic DNA of the studied samples were determined using the equipment of the Quant-c Transluminator (Helicon) by comparing (visually) with the DNA λ fagi, which had a certain concentration. Their concentration was brought to the working concentration (25 ng / ml) and stored frozen in a freezer at -20°C until further molecular studies.PСR analysis. The PСR reaction (hot-start software) was carried out in a volume of 10 µl in the following order. 1 µl contains MgCl2 containing 10xpzr buffers, 0.2 µl BSA (bovine serum albumin), 0.08 µl 25 µm mixture of dNTP (dATP, dGTP, dTTP and dCTP), 0.6 µl direct (F) and reverse (R) primers, 0.2 µl DNA polymerase Taq, 1 µl DNA matrix, 6.32 µl distilled water. The amplification process was carried out on Miniamplus Thermal Cycler equipment (Thermofisher, the USA) in the following time and temperature modes:- initial denaturation 5 min at 94°C; denaturation 45 sec at 94°C, 40 cycles; annealing (depending on the melting temperature of soils) 45 sec at ± 55°C; elongation 2 min at 72°C; final elongation 10 min at 72°C;The amplification products were separated horizontally at a voltage of 100 V (40 minutes) in a 2.5% agarose gel (1xtris-borate EDTA buffer) loaded with ethidium bromide. The DNA molecular weight marker (DNA ladder hyperladder 50 BP) was used to determine the size of the amplified fragment. Amplified DNA lines were visually examined and photographed using Quantum c (Helicon) Transluminator equipment.Genotyping. Using the MS Excel computer soaftware, SSR symbols were evaluated as the presence (1) or absence (0) of reinforced bands [10]. The studied wheat samples were labeled based on differences in the size of alleles of each locus of the SSR marker (Table 2). A special GelAnalyzer program was used for genotyping the results obtained.
|
4. Obtained Results and Their Analysis
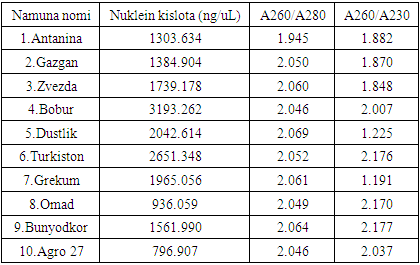
- When measuring the quantitative and qualitative parameters of DNA molecules using a nanodropic spectrophotometer, the DNA concentration averaged 1757.5 NG/µl. Also, the A260/A280 coefficient showed an average value of 2.04, and the A260/A230 coefficient showed an average value of 1.86 (Table 3).
|
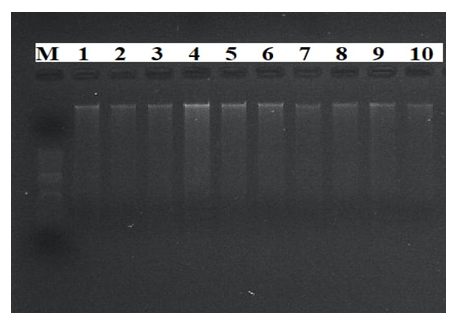 | Figure 1. Visual image of DNA molecules in 0.9% agarose gel. M-molecular weight marker (Hyper leader 50 bp), 1-10-genomic DNA isolated from experimental plants; 1) Antanina, 2) Gazgan, 3) Zvezda, 4) Bobur, 5) Dustlik, 6) Turkiston, 7) Grekum, 8) Omad, 9) Bunyodkor, 10) Agro 27 |
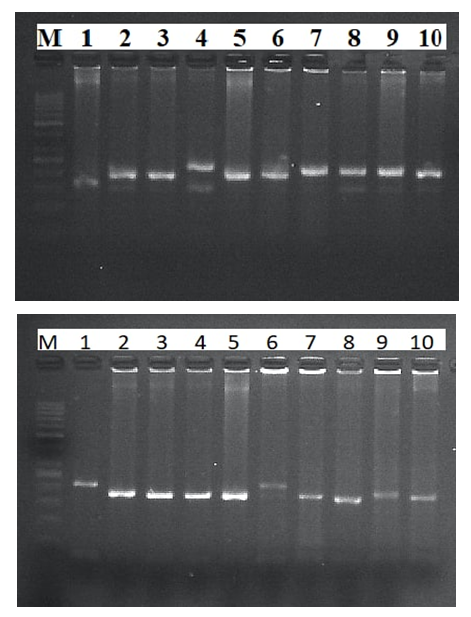 | Figure 2. PCR analysis of the study samples polymorphic marker cfd9, as well as electrophoregram of microsatellite markers wmc432. M-molecular weight marker (Hyper leader 50 bp), 1-10-genomic DNA isolated from experimental plants; 1) Antanina, 2) Gazgan, 3) Zvezda, 4) Bobur, 5) Dustlik, 6) Turkiston, 7) Grekum, 8) Omad, 9) Bunyodkor, 10) Agro 27 |
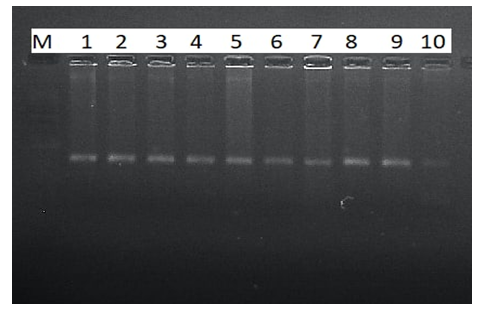 | Figure 3. PCR analysis of the study samples electrophoregram of the microsatellite marker of the monomer cfd183. M-molecular weight marker (Hyper leader 50 bp), 1-10-genomic DNA isolated from experimental plants; 1) Antanina, 2) Gazgan, 3) Zvezda, 4) Bobur, 5) Dustlik, 6) Turkiston, 7) Grekum, 8) Omad, 9)Bunyodkor, 10) Agro 27 |
|
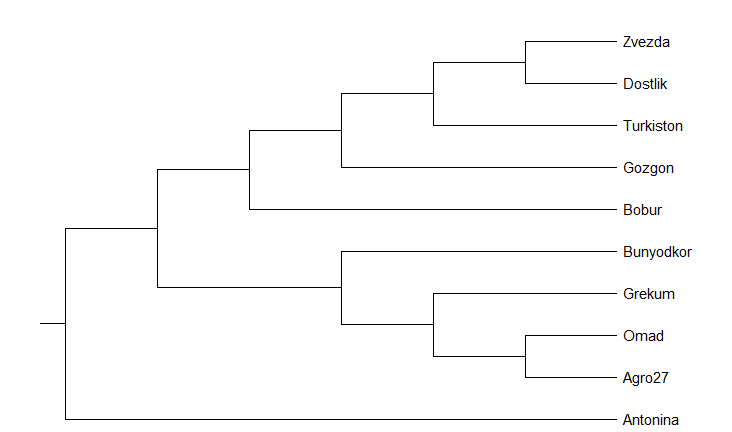 | Figure 4. Phylogenetic family tree based on polymorphism among SSR polymorphic markers |
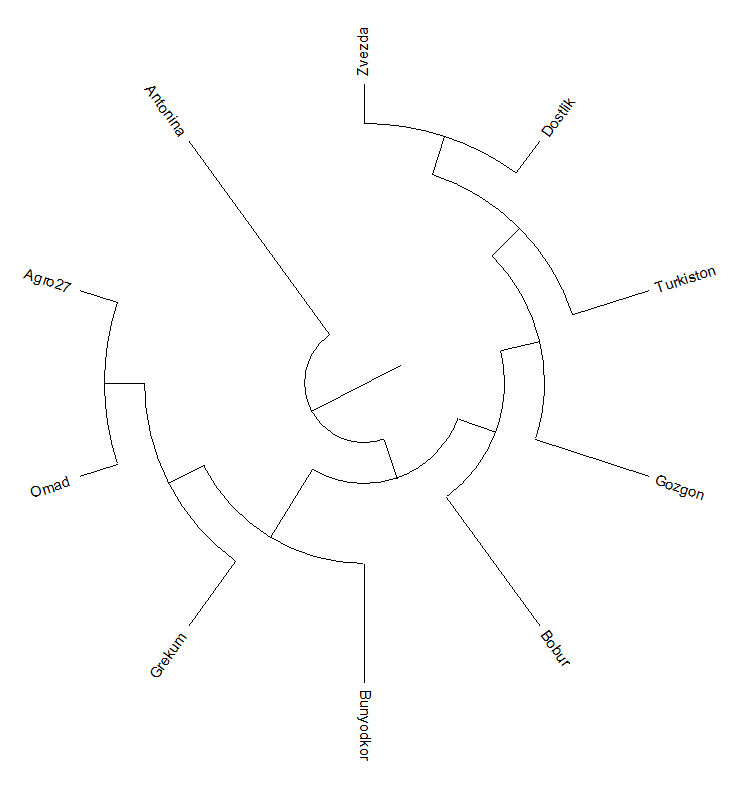 | Figure 5. Phylogenetic family tree based on polymorphism among SSR polymorphic markers |
5. Conclusions
- Of the 10 SSR (Simple sequence repeat) markers associated with wheat salt resistance markers, 9 had genetic differences between the study materials. These identified polymorphic SSR markers will be used in further studies for molecular mapping to identify genes responsible for resistance to salinization of winter wheat. Based on the obtained data of genetic polymorphism, a phylogenetic family tree of 10 varieties of wheat samples was compiled. According to phylogenetic analysis, the proximity of the varieties Zvezda, Babur, Gazgan and Turkestan to the variety Druzhba, resistant to salinization, among the selected wheat genotypes, indicates the common origin of these genotypes.