-
Paper Information
- Paper Submission
-
Journal Information
- About This Journal
- Editorial Board
- Current Issue
- Archive
- Author Guidelines
- Contact Us
International Journal of Genetic Engineering
p-ISSN: 2167-7239 e-ISSN: 2167-7220
2022; 10(1): 5-9
doi:10.5923/j.ijge.20221001.02

Formation of a Digital Database on Wheat Genotypes Resistant to Salinization
 Abstract
 Reference
 Full-Text PDF
 Full-text HTML
Utkirjon T. Jumanov1, Khabibjon Kh. Kushiev2, Abdulaziz O. Abdukarimov3
1Researcher, Gulistan State University, Gulistan, Uzbekistan
2Doctor of Biological Sciences, Professor, Gulistan State University, Gulistan, Uzbekistan
3Master's Student, Gulistan State University, Gulistan, Uzbekistan
Copyright © 2022 Scientific & Academic Publishing. All Rights Reserved.
This work is licensed under the Creative Commons Attribution International License (CC BY).
http://creativecommons.org/licenses/by/4.0/

This article describes the procedure for using digital technologies in the selection of salinization-resistant genotypes of winter wheat. 268 genotypes of soft wheat (Triticum aestivum L.) were obtained as experimental objects. The experiment was carried out on a pilot plot of a lightly salted field. The SSPS-17 program was used for statistical analysis of the primary data of the studied genotypes. With the help of this program, coefficients of variation, correlation and determination were calculated for 10 traits of genotypes. Factor analysis was used in the selection of salinization-resistant genotypes of winter wheat. At the same time, it is noted that productivity and the number of thorns strongly associated with it and the mass of thorns are one of the main criteria for the selection of genotypes resistant to salinization. In the case of gross selection of salt-resistant genotypes, it was recommended to pay attention to productivity, and in the case of individual selection, to the length of the spike and its weight. Using factor analysis, more than 20 mutant genotypes were selected and recommended as the primary source for selection. A digital database was formed on the genotypes of each studied winter wheat.
Keywords: Collection sample, Gene pool, Variation, Correlation, Determination, Factor analysis, Factor load, Genotype
Cite this paper: Utkirjon T. Jumanov, Khabibjon Kh. Kushiev, Abdulaziz O. Abdukarimov, Formation of a Digital Database on Wheat Genotypes Resistant to Salinization, International Journal of Genetic Engineering, Vol. 10 No. 1, 2022, pp. 5-9. doi: 10.5923/j.ijge.20221001.02.
1. Introduction
- Grain farming is one of the main branches of agriculture and plays an important role in meeting the needs of the population for food. Further development of this sphere is defined as one of the priorities in the "strategy for the development of agriculture of the Republic of Uzbekistan for 2020-2030", which provides for bringing the yield of grain varieties to an average of 70.0 quintals per hectare in the future. For this purpose, the selection and creation of varieties suitable for the soil and climatic conditions of each region remains currently one of the priority tasks of grain breeding.As you know, the salinity resistance of plants is one of the urgent and complex issues of breeding. The peculiarity of the influence of salinity is explained by a decrease in yield, and the complexity is due to dependence on factors such as soil fertility, degree of salinity, type of salinity. Scientific sources note that in conditions of slightly saline soil, there is a decrease in plant yield by 10-20%, with average salinity-by 20-50%, with strong salinity-by 50-80% [1]. According to these data, although there is an inverse relationship between the degree of salinity of the soil and its fertility, in turn, productivity is the main criterion for the selection of saline-resistant genotypes. This makes it possible to select plant varieties resistant to salinization and create new ones using breeding methods [2]. To do this, it is desirable to select genotypes primarily in a salty environment. A striking example of this is that in Central Asia there are more than 700 species of genotypes resistant to salinization, and 206 of them are endemic to the territory [3].As it is known, breeding begins with the study of raw materials. However, the selection of initial sources for winter wheat breeding in saline soils, their assessment, especially systematic analytical work, have not been carried out in full. In turn, it should be noted that a large number of genotypes (200-300) are involved in the selection and evaluation of initial sources and complex computational work will need to be performed. In this case, it is desirable to use the capabilities of digital technologies.It is known from world experience that with the help of digital technologies, raw materials for plant breeding are selected [4-7], the degrees of variability and determinacy of traits are determined [8-10]. At the same time, the possibility of assessing and selecting the plant gene pool using factor analysis was noted and scientifically based indicator signs (biological, ecological, ecobiological, genotypic) were recommended for gross and individual selection [7,11].The main purpose of this study is to create a system for selecting salinization-resistant genotypes of winter wheat using digital technologies. The main objectives of the study are the recommendations of scientifically based criteria for the selection and evaluation of salinization-resistant genotypes, the formation of a digital database and recommendations of raw materials for breeding.
2. The Main Results and Findings
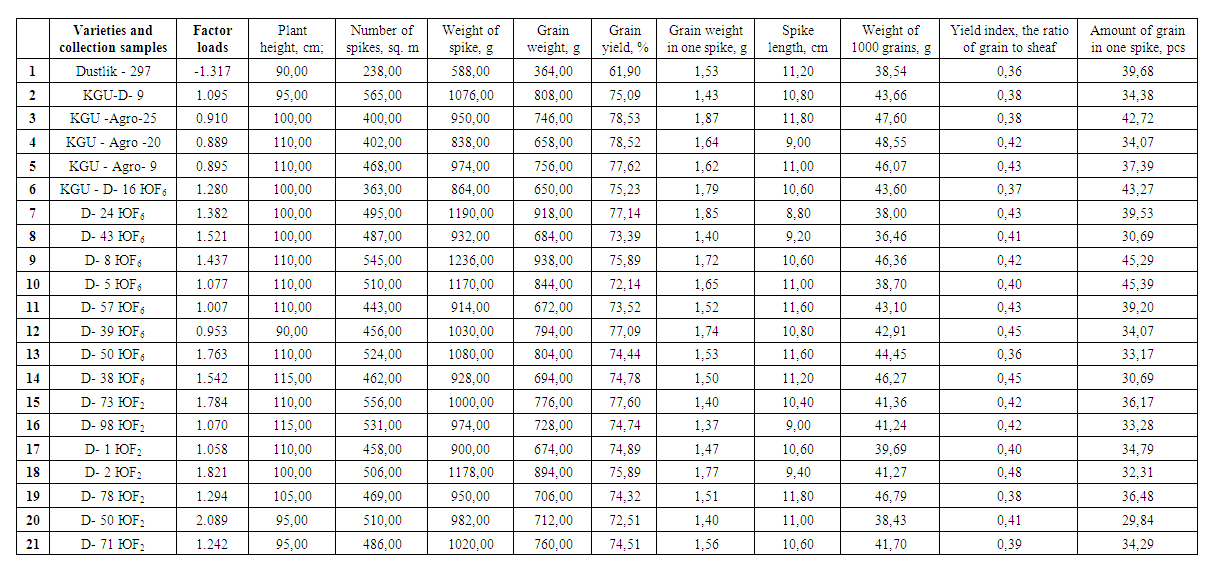
- 286 genotypes (varieties, selection material and collection samples) of soft wheat (Triticum aestivum L.) varieties were obtained as experimental objects. The study was conducted in 2019-2021 at the lightly salted Field experimental site of the Scientific and Practical Center for technologies for growing and processing plant products. All phenological observations and calculation work were carried out on the basis of methodological guidelines issued by UzIICS. When calculating the correlation coefficients (r), determination (r2) and variation (cv,%) between the studied features, the statistical program SPSS-17 was used [7,12].When describing genotypes, external morphological signs of the plant and mainly plant growth are most often recorded as the main indicators. The primary data obtained for 268 studied mutton wheat genotypes are shown in Table 1. Based on the data in the table, it can be noted that the average height of the plant is 95.51 cm. In the studied genotypes, the minimum growth rate of the plant was 60 cm, the maximum was 165 cm. This indicates a strong variability of this trait. The number of spikes (per 1 sq. m of area) was 308 pieces. According to this indicator, there was also a strong variability (25-576 pcs.). The mass of the spike (1 sq. m) averaged 663.19 g/m2, the yield was 490.36 g/m2. From these data it can be seen that in saline soils, the yield of winter soft wheat varieties averages 490.36 g/m2. Grain yield is 73.53%, grain weight in one spike is 1.64 g.ga became equal. The length of the spike was 10.34 cm, the weight of 1000 grains was 41.91 g, the yield index was 0.39, and the amount of grain in the spike was 39 pieces.From these data it can be seen that the studied signs of winter wheat and their quantitative indicators have a variable character. This is also evidenced by the minimum and maximum indicators of signs. This served as the basis for the analysis of the features of variation of these features. These data are shown in table 1. From the table data, it was found that the number of spikes (2), the weight of spikes (3) and the number of grains (4) vary greatly and are deterministic. These symbols are located on the right and top of the diagram. Note that the determinant-r2 is the square of the correlation coefficient, meaning that the sign is bounded. These signs will depend not only on the genotype and the external environment. Their variations were carried out in connection with other signs. Consequently, although productivity varied greatly, its variability became dependent on other characteristics. The fertility of the genotype in this salty environment indicates its resistance to salinization. The weight of grain in one spike (6), the amount of grain in one spike (10) were found to be moderately variable and deterministic.
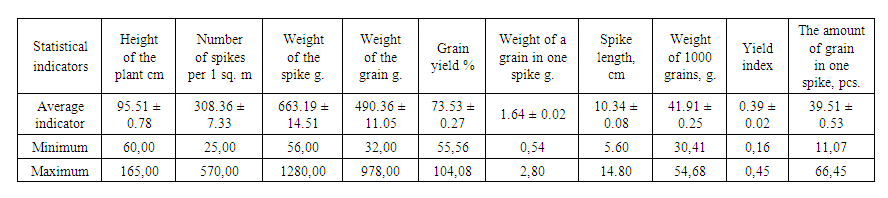 | Table 1. Primary data on the characteristics of genotypes of winter soft wheat and their statistical indicators |
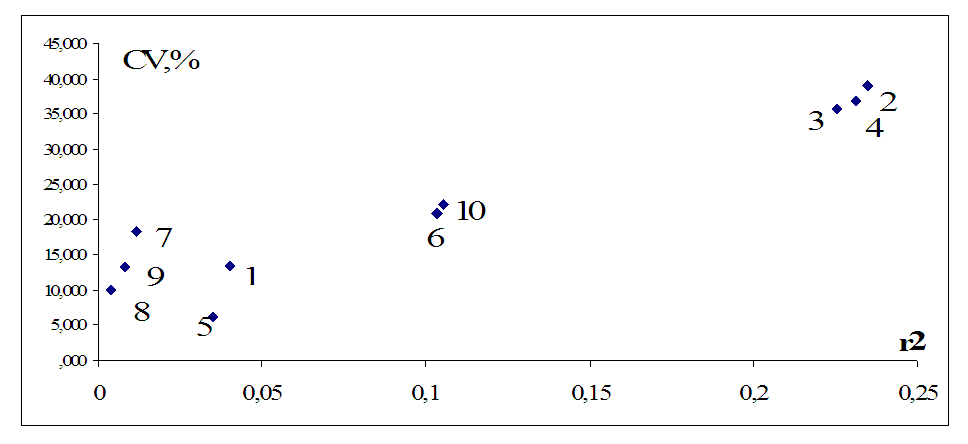 | Figure 1. Degrees of variability (Cv,%) and determinism (r2) of quantitative indicators of traits of winter soft wheat (Note. (the numbers represent the traits): 1 - plant height, cm; 2-number of Spikes, pcs./ 1 sq. m; 3-spike weight, g/ sq.m; 4-grain weight, g/sq. m; 5-grain yield, %; 6-grain weight in one spike, g; 7-Spike length, cm; 8-weight of 1000 grains, g; 9-yield index; 10-number of grains in one spike, pcs.) |
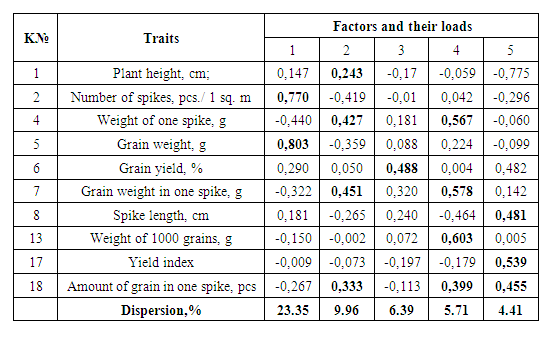 | Table 2. Load of traits of winter wheat by factors |
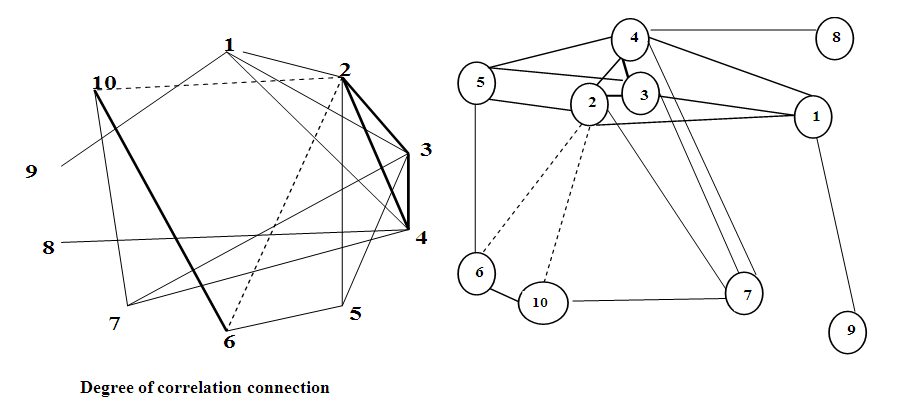 | Figure 2. Degree and structure of correlations between quantitative indicators of traits of winter wheat genotypes (Note. the numbers represent the traits: 1 - plant height, cm; 2-number of Spikes, pcs./ 1 sq. m; 3-spike weight, g/ sq.m; 4-grain weight, g/sq. m; 5-grain yield, %; 6-grain weight in one spike, g; 7-Spike length, cm; 8-weight of 1000 grains, g; 9-yield index  r=0.3-0.5; r=0.3-0.5;  r=0.5-0.7; r=0.5-0.7;  r=>0.7 r=>0.7  r=-0.3-0.5) r=-0.3-0.5) |
 | Table 3. Genotypes of winter wheat selected by factor analysis |
3. Conclusions
- In general, as a result of studying 268 genotypes of winter wheat in saline soils, the following conclusions were made:1. It was noted that the number of spikes per 1 sq.m of winter wheat, the weight of the spike and the weight of the grain are strongly deterministic and variable traits. It was noted that the height of the plant, the length of the spike are stable traits. Productivity and related signs are recognized as eco-biological, and the length of spikes and height of plants are biological indicators.2. There was a strong correlation between plant height, number of spikes, spike weight, spike length, average weakness, number of spikes, spike weight and amount of grain.3. The results of factor analysis showed that productivity is one of the main criteria when choosing genotypes resistant to salinization. According to productivity, the selection of salt-resistant genotypes was considered expedient.4. A digital database has been formed on the studied gentians of winter wheat in saline soils. Promising genotypes were selected and winter wheat was recommended as a starting material for breeding.5. When gross choosing in saline soils, it was recommended to pay attention to the yield, and when choosing single ones - to the length of the spike and its weight.