-
Paper Information
- Paper Submission
-
Journal Information
- About This Journal
- Editorial Board
- Current Issue
- Archive
- Author Guidelines
- Contact Us
International Journal of Finance and Accounting
p-ISSN: 2168-4812 e-ISSN: 2168-4820
2024; 13(2): 29-38
doi:10.5923/j.ijfa.20241302.01
Received: Apr. 24, 2024; Accepted: May 19, 2024; Published: Jun. 24, 2024

The Impact of Business Intelligence on Financial Performance, with a Focus on the Mediating Role of Organizational Innovation and Learning, as Perceived by Managers of International Trading Companies in Golestan Province
 Abstract
 Reference
 Full-Text PDF
 Full-text HTML
Alireza Maetoofi, Kianoosh Esmaeilpoortehrani
Azad University of Aliabad Katool Branch, Golestan, Iran
Correspondence to: Alireza Maetoofi, Azad University of Aliabad Katool Branch, Golestan, Iran.
| Email: |  |
Copyright © 2024 The Author(s). Published by Scientific & Academic Publishing.
This work is licensed under the Creative Commons Attribution International License (CC BY).
http://creativecommons.org/licenses/by/4.0/

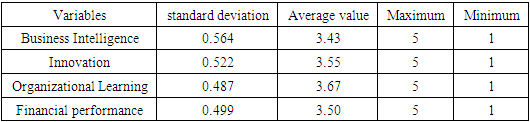
The aim of this study was to examine, from the viewpoint of managers of international trading companies in Golestan province, the impact of business intelligence on financial performance in relation to the mediating role of organizational innovation and organizational learning. The current study falls into the applied research category in terms of classification based on purpose, and it is a descriptive-survey type of correlational research in terms of data collection method and type. The 484 managers of international trading companies in the province of Golestan make up the statistical population for this study. A sample size of 214 participants was determined using Cochran's formula with a 5% margin of error and a simple random sampling method. The information was gathered using standard questionnaires. Using Pls Smart software, data analysis was carried out using the structural equation modeling method. The average amount of the research variables which include financial performance, organizational learning, innovation, and business intelligence was found to be 3.43; 3.55, 3.67, and 3.50 were obtained. Considering that the average of all questionnaires for all variables is equal to 2.5, it can be concluded that all variables are in a favorable situation.
Keywords: Business intelligence, Financial performance, Trading companies
Cite this paper: Alireza Maetoofi, Kianoosh Esmaeilpoortehrani, The Impact of Business Intelligence on Financial Performance, with a Focus on the Mediating Role of Organizational Innovation and Learning, as Perceived by Managers of International Trading Companies in Golestan Province, International Journal of Finance and Accounting , Vol. 13 No. 2, 2024, pp. 29-38. doi: 10.5923/j.ijfa.20241302.01.
1. Introduction
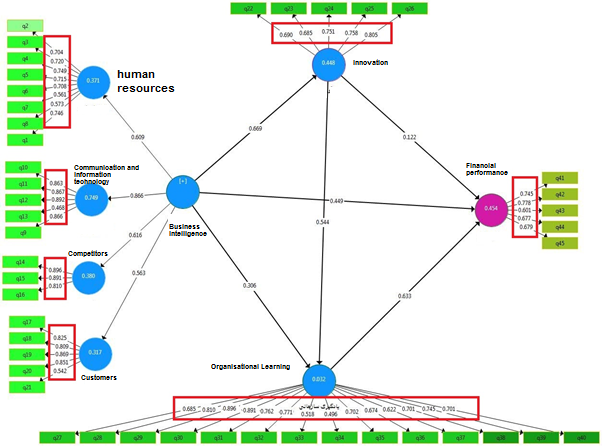
- Financial performance is a fundamental concern in all organizational analyses, and it is challenging to envision an organization that does not engage in performance evaluation and measurement. The evolving conditions of the global economy have introduced conflicting economic goals and expectations within organizations (Battilana et al., 2022). According to Itter et al. (2003), financial performance measures how effectively a business meets its shareholders' financial objectives to increase their wealth. Evaluating and measuring financial performance enhances system intelligence and encourages positive behaviors. As noted by Baah et al. (2021), the formulation and implementation of organizational policy are crucial components, significantly influenced by financial performance. Organizations, especially those in the economic and production sectors, struggle to meet stakeholders' needs and expectations if they exhibit poor financial performance (Akisik and Gal, 2017). Many stakeholders assert that employing business intelligence and optimizing financial outcomes such as productivity and profitability are primary goals for many firms. Factors like organizational innovation (Rouhani et al., 2016; Torres et al., 2018) and organizational learning (Arconte, 2018; Shao et al., 2022) enhance an organization’s financial performance. Companies aiming to improve their financial performance, increase earnings, and reduce costs should leverage elements like business intelligence, as it plays a critical role in this process. Organizational learning and innovation were considered regarding their influence on financial performance.However, effectively using data to make faster, more accurate decisions is crucial for many businesses' success. To achieve this, businesses must adopt powerful and efficient technologies like business intelligence (BI), which helps automate analysis, decision-making, strategy development, and forecasting (Niu et al., 2021; Di Vaio et al., 2022). In other words, businesses use BI to collect, process, and analyze large volumes of data, transforming it into business value that informs decision-making through intelligent analytical reporting platforms (Rikhardsson and Yigitbasioglu, 2018). BI enhances an organization's effectiveness and efficiency at all levels, fostering sustainable development (Visinescu et al., 2017). BI programs analyze activities and provide data to better understand, improve, and optimize corporate processes. BI significantly impacts cost control and performance assessment systems (Williams and Williams, 2010). Achieving organizational goals involves the intelligent use of all available resources, techniques, methods, and tools (Al-Okaily et al., 2023).Furthermore, an organization's ability to identify, accept, adapt to, and operate effectively amidst environmental changes is crucial for its survival. Organizational learning is essential for driving organizational change and adapting to the environment (Peschl, 2023). Organizational learning involves members identifying mistakes and taking corrective actions. According to Soomro et al. (2021), it is the process of improving performance through knowledge and understanding. Companies that can learn faster, better, and earlier than their competitors tend to be more successful (Sahibzada et al., 2021). A continuously learning business is more likely to identify and exploit market opportunities, provide relevant and targeted products, and maintain customer engagement, all contributing to increased economic and financial profitability, prioritizing production and sales (Chen et al., 2021). Organizational learning enhances companies' capabilities to boost sales, provide better support, and acquire, retain, and nurture new customers. Faster knowledge acquisition strengthens strategic capacities, competitive edge, and overall performance (Hina et al., 2021).Moreover, innovation is a key indicator of organizational sustainability, defined as the effective implementation of new ideas from organizational processes that integrate various resources (Jabłoński, 2016). Innovation is vital because it provides a sustainable competitive advantage, ensuring survival and growth. It is a prerequisite for the progress, development, and excellence of both organizations and society (Zimmerman, 2000). Manufacturing workers without the necessary skills struggle to collaborate, generate new ideas, and execute planned tasks. Structural capital, the ability of an organization to maintain its regular business procedures and structures, enables employees to achieve optimal intellectual and overall business performance (Kanjanajuta, 2016). Given the importance of financial performance to organizations and companies, we decided to investigate the factors influencing it based on the above information. In addition, it is crucial to explain in more detail how the hypotheses arise from the theoretical background.Research conceptual modelThe conceptual model of the research is presented as follows:
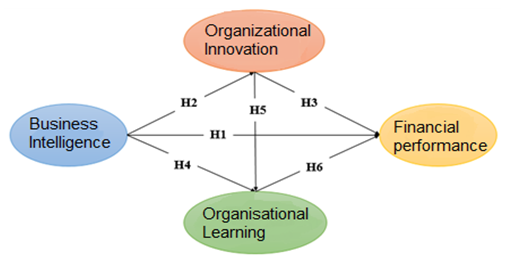 | Figure 1. Conceptual model of research |
2. Methodology
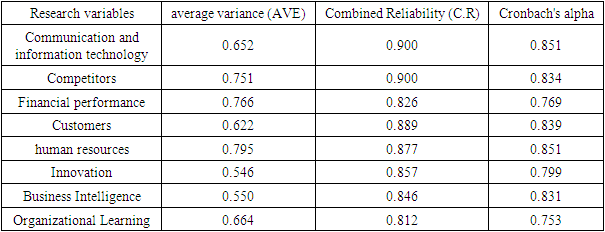
- The current study falls into the applied research category in terms of classification based on purpose, and it is a descriptive-survey type of correlational research in terms of data collection method and type.Society, statistical sample size and sampling methodThe study's statistical population comprises 484 managers from international trading companies in Golestan Province. Using Cochran's formula, a 5% margin of error, and a simple random sampling method, a sample size of 214 was selected.Methods and tools of information gatheringTwo field methods (standard questionnaires) and library studies were employed in this study to gather the necessary data.A. Questionnaire of Financial Performance: Khatri (2000) created this questionnaire in 2000, and Imanipour translated it in 2017. There are five questions on it. A five-point Likert scale—very high, very moderate, low, and very low—is used to determine its setting. It uses a scoring system of 1 for extremely low and 5 for very high. This test has a minimum score of 5 and a maximum score of 25. A better financial performance is indicated by a higher score. It is assumed that the mean is 10.B. Organizational learning questionnaire: Shiva et al. created this 14-item questionnaire in 2007. This questionnaire uses a 5-point Likert scale for responses (very little = 1 to very much = 5). This questionnaire consists of five sections: questions 1-2 on gathering experiences; questions 3–4 on taking risks; questions 5–11 on interacting with the outside world; and questions 12–14 on collaborative decision-making and dialogue. A score of 14 is the minimum and a score of 70 is the maximum. The mean in theory is equal to 28.C. Innovation Questionnaire: This five-item questionnaire was created in 2016 by Gandhi et al. The scoring system uses a five-point Likert scale, with 1 representing very low and 5 representing very high. The score ranges from 5 at the lowest to 25 at the highest, with an average of 10. Greater innovation is indicated by higher scores.D. Business Intelligence Questionnaire: This 21-item, 4-dimensional questionnaire was created in 2013 by Rezaeilarijani and associates. Questions pertaining to human resources (numbers 1–8), communication and information technology (numbers 9–13), competitors (numbers 14–16), and customers (numbers 17–21) are scored using a 5-point Likert scale, with 1 representing very little and 5 representing very much. The score ranges from 21 to 105, with an average of 42. Greater innovation is indicated by higher scores.Structural equation modelingOne of the most effective and suitable techniques for multivariate analysis and research is structural equation modeling, which is based on path analysis or path-structural modeling (variance-based approach). Several criteria are used in the structural equation modeling method to assess the fit of the structural model. The first and most fundamental criterion is the significance coefficients Z, also known as t-values. In actuality, the primary standards for accepting or rejecting hypotheses are the coefficients of the t statistic.The path coefficient is the structural model's second fit criterion. The way the model fits the path coefficient results in coefficients that are between 1 and -1 that represent the direct and indirect effects of an independent variable on a dependent variable in the path model. It can be inferred that when the independent variable increases, the dependent variable will also increase if the path coefficient between the independent and dependent variables is positive. Conversely, if the path coefficient between the independent and dependent variables is negative, it indicates that when the independent variable increases, the dependent variable will also increase. The dependent variable will decrease relative to the independent variable.Path analysisOne method for examining the relationship and dependence between variables is path analysis. As a generalization of normal regression, the path analysis method can interpret the relationships and correlations observed between the dependent variables logically and show the direct effects, indirect effects, and total effect of each independent variable. The standardized regression coefficient is the basis for calculating path coefficients. A regression model is created based on the assumption that a variable is a function of other variables. It is sufficient to return each dependent (endogenous) variable to the variables that it directly influences in order to derive estimates of the main path coefficients. The causal model of the structure is the only model included in path analysis; the measurement model is not available. Only variables that have been observed can be used for path analysis. The path analysis demonstrates the strength and direction of the relationships between the research variables. Path coefficients are values that indicate the direction and strength of influence between variables; they are commonly denoted by the Latin letter β. Since path coefficients and standardized regression coefficients are the same, path analysis should be performed using simple linear regression.The contents state that the conceptual model was created initially based on the research variables, and that Pls Smart software was used to conduct the structural equation modeling method of data analysis.Descriptive StatisticsTable 1 and Figure 2 present the gender distribution of sample participants. Within the research's statistical sample of 214 individuals, 203 are male and 11 are female.
|
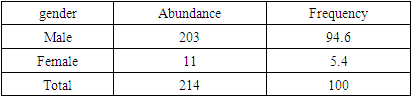
 | Figure 2. Frequency of statistical sample based on gender |
|
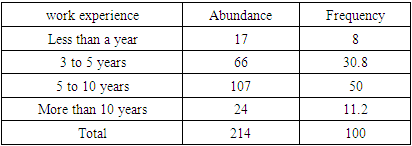
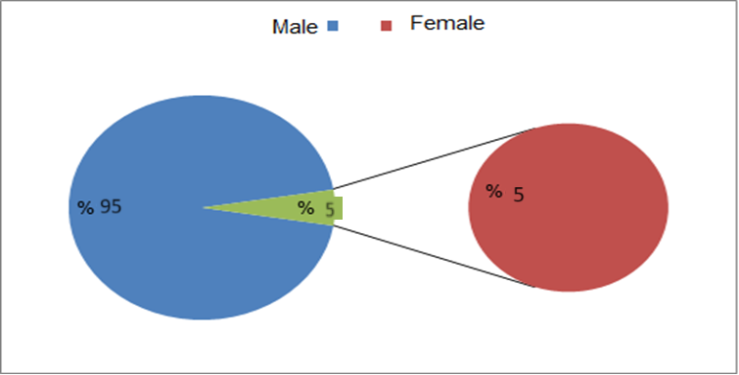
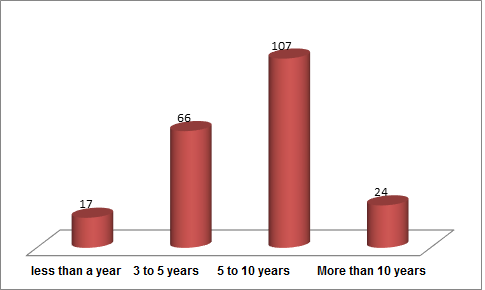 | Figure 3. Frequency percentage of statistical sample based on work experience |
|
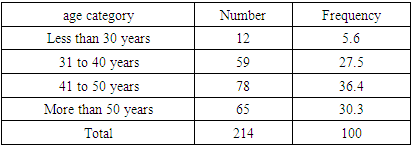
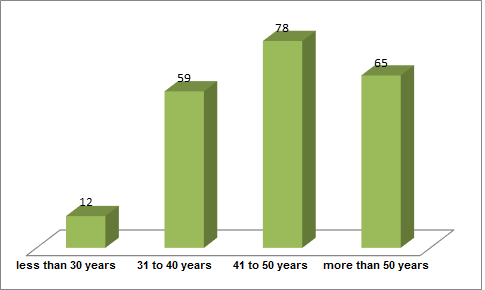 | Figure 4. frequency of respondents' age group |
|
 | Figure 5. The factor load value of the questions related to the research variables |
|
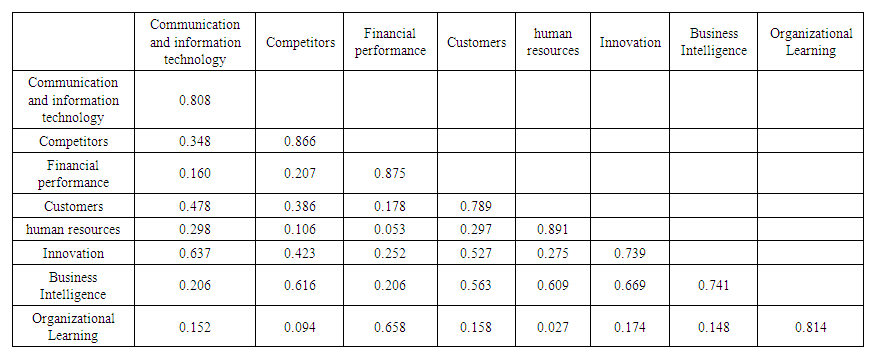 | Table 6. Divergent validity results |
|
|
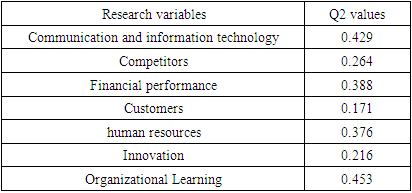
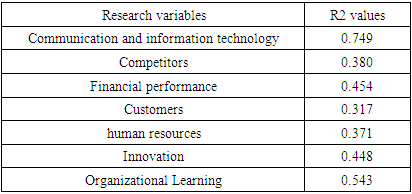
 R2 is the mean value of the model's endogenous constructs, and communalities is the mean value of each construct's shared values. Three values—0.25,0.36, and 0.36—have been introduced by Vetels et al. as weak, medium, and strong values. The computed value, which equals 0.498, shows that the overall research model fits the data very well.
3. Results and Discussion
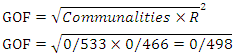
- Testing research hypothesesIt's time to look over and test the research hypotheses after determining whether the measurement model, structural model, and general model fit together. The following figures present the model that was implemented in the pls software environment to test the research hypotheses.
 | Figure 6. The structural model of examining the research hypotheses in the significance mode |
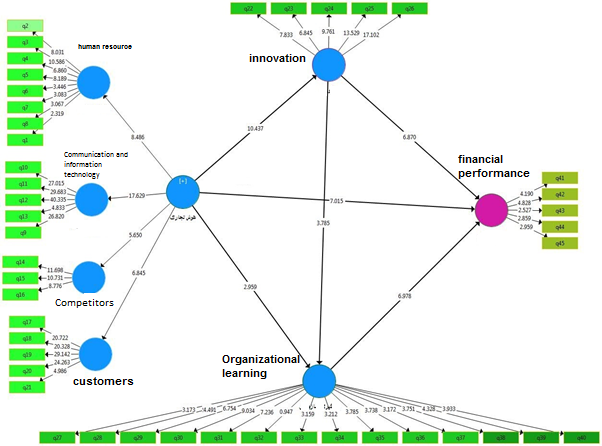
 | Figure 7. The structural model of the research hypotheses in standard coefficient mode |
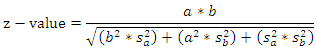 a: the value of the path coefficient between the independent variable and the mediatorb: Path coefficient value between mediating and dependent variablesa: the standard error of the path between the independent variable and the mediatorsb is the standard error of the path between the mediator and the dependent variableThe results of the hypothesis test are as follows:
 The hypothesis that business intelligence influences financial performance through the mediating role of organizational innovation, as perceived by managers of international trading companies in Golestan province, is supported by the obtained z-value of greater than 1.96.Determining the intensity of the influence of the mediating variableA statistic known as the VAF is used to quantify the strength of the mediating variable's influence. Its value ranges from 0 to 1, and the closer the value is to 1, the greater the influence of the mediating variable. Actually, the ratio of the indirect effect to the overall effect is measured by this value. The following formula is used to determine the value of VAF.
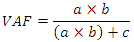 where a is the value of the path coefficient between the independent variable and the mediator, b is the value of the path coefficient between the mediator and dependent variable, and c is the value of the path coefficient between the independent and dependent variable.
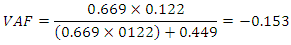 The indirect effect is less than the direct effect, as indicated by the independent variable's 0.449 direct effect value on the dependent variable and the mediator variable's 0.153 effect value when analyzed using the Variance Analytic Function (VAF).In relation to the mediating role of organizational learning variable, the results are as follows:The results of the hypothesis test are as follows.
 The hypothesis that business intelligence influences financial performance through mediating organizational learning, as perceived by managers of international trading companies in Golestan province, is supported by the obtained z-value of greater than 1.96.Determining the intensity of the influence of the mediating variable
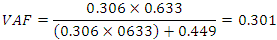 Based on the value of the independent variable's direct effect on the dependent variable (0.449), which was also the effect value of the mediator variable (VAF = 0.301), it can be concluded that the indirect effect is smaller than the direct effect.Test of sub-hypothesesThe first sub-hypothesis states that managers of foreign trade companies in the province of Golestan believe that business intelligence has an impact on financial performance.Figure 6 shows that the T statistic value obtained is 7.015, indicating that this value is greater than 1.96. This confirms the research hypothesis, which states that business intelligence affects financial performance. In the province of Golestan, the opinions of managers of foreign trade firms have a big influence. Additionally, as shown in Figure 7, the obtained path coefficient equals (β=0.449); this effect is direct because the obtained path coefficient is positive. Thus, from the perspective of managers of international trading companies in Golestan province, it can be concluded that business intelligence has a positive and significant impact on financial performance.The second sub-hypothesis states that managers of foreign trade companies in the province of Golestan believe that business intelligence influences organizational innovation.Based on Figure 6, the T statistic value obtained is 10/437, indicating that this value is greater than 1.96. This confirms the research hypothesis, which states that business intelligence influences organizational innovation. In the province of Golestan, the opinions of managers of foreign trade firms have a big influence. Additionally, as shown in Figure 7, the obtained path coefficient equals (β=0.669); this effect is direct because the obtained path coefficient is positive. Consequently, managers of international trading companies in Golestan province believe that business intelligence has a positive and significant impact on organizational innovation.The third sub-hypothesis states that managers of foreign trade companies in the province of Golestan believe that organizational innovation has an impact on financial performance.The value of the T statistic obtained is 6.870, as shown in Figure 6, indicating that this value is greater than 1.96. This confirms the research hypothesis, which states that organizational innovation affects financial performance. In the province of Golestan, the opinions of managers of foreign trade firms have a big influence. Additionally, as shown in Figure 7, the obtained path coefficient equals (β=0.122); this effect is direct because the obtained path coefficient is positive. Thus, from the perspective of managers of international trading companies in Golestan province, it can be concluded that organizational innovation has a positive and significant impact on financial performance.The fourth sub-hypothesis is that managers of international trading companies in the province of Golestan believe that business intelligence influences organizational learning.Figure 6 shows that the T statistic value obtained is 2.959, indicating that this value is greater than 1.96. This confirms the research hypothesis, which states that business intelligence influences organizational learning. The viewpoint of international trade company managers in the province of Golestan holds considerable influence. Additionally, as shown in Figure 7, the obtained path coefficient equals (β=0.306); this indicates that the face is straight because the obtained path coefficient is positive. From the perspective of managers of international trading companies in Golestan province, business intelligence thus has a positive and noteworthy effect on organizational learning.The fifth sub-hypothesis states that managers of foreign trading companies in the province of Golestan believe that organizational innovation has an impact on organizational learning.As can be seen in Figure 6, the T statistic value obtained is 3.785, indicating that this value is greater than 1.96. This confirms the research hypothesis and leads to the conclusion that organizational innovation influences organizational learning. The perspectives of international trade company managers in the province of Golestan have an effect. Additionally, as shown in Figure 7, the obtained path coefficient equals (β=0.544); this effect is direct because the obtained path coefficient is positive. Thus, from the perspective of managers of international trading companies in Golestan province, it can be concluded that organizational innovation has a positive and significant effect on organizational learning.Sixth sub-hypothesis: Managers of international trading companies in the province of Golestan believe that organizational learning affects financial performance.The value of the T statistic obtained is 6.978, as shown in Figure 6, indicating that this value is greater than 1.96. This confirms the research hypothesis, which states that organizational learning affects financial performance. The opinions of international trade company managers in the province of Golestan have a big influence. Additionally, as shown in Figure 7, the obtained path coefficient equals (β=0.633). This indicates that the face is straight because the obtained path coefficient is positive. Thus, from the perspective of managers of international trading companies in Golestan province, it can be concluded that organizational learning has a positive and significant impact on financial performance.
4. Conclusions
- In the study's sample of 214 individuals, 203 are male and 11 are female. Among the 107 respondents, the majority had been in service for five to ten years, while the fewest had less than one year of service. The largest age group in the sample is 41 to 50 years old, representing 36.4%, whereas the smallest group is under 30 years old, with 12 individuals.Regarding education, 48.5% of the sample had completed graduate school, while only 1.6% had a diploma or less. The average values for the research variables—financial performance, organizational learning, innovation, and business intelligence—were 3.43, 3.55, 3.67, and 3.50, respectively. Considering the average questionnaire value for all variables is 2.5, it can be concluded that all variables are in a favorable condition.