-
Paper Information
- Paper Submission
-
Journal Information
- About This Journal
- Editorial Board
- Current Issue
- Archive
- Author Guidelines
- Contact Us
International Journal of Finance and Accounting
p-ISSN: 2168-4812 e-ISSN: 2168-4820
2024; 13(1): 1-19
doi:10.5923/j.ijfa.20241301.01
Received: Feb. 23, 2024; Accepted: Mar. 27, 2024; Published: Apr. 10, 2024

Industry-Specific Prior Accuracy as a Measure for Sell-Side Analysts’ Industry Knowledge
 Abstract
 Reference
 Full-Text PDF
 Full-text HTML
Niklas Blümke
Formerly University of Cologne, AlbertusMagnus-Platz, 50923 Cologne, Germany, Now Zeb Consulting, Hammer Str. 165, 58153 Münster, Germany
Correspondence to: Niklas Blümke, Formerly University of Cologne, AlbertusMagnus-Platz, 50923 Cologne, Germany, Now Zeb Consulting, Hammer Str. 165, 58153 Münster, Germany.
| Email: |  |
Copyright © 2024 The Author(s). Published by Scientific & Academic Publishing.
This work is licensed under the Creative Commons Attribution International License (CC BY).
http://creativecommons.org/licenses/by/4.0/

Analysts’ earnings forecasts are of high importance in multiple areas as, e.g., company valuation or asset management. In addition, analysts vary significantly in their earnings forecast accuracy. While existing literature finds that analysts’ relative earnings forecast accuracy is influenced by a variety of analyst and forecast characteristics such as the number of companies followed, both academics and practitioners emphasize the value of analysts’ industry knowledge. In this paper, I introduce industry-specific prior accuracy as a forecast-based proxy for industry knowledge and show that this characteristic is an important determinant of analysts’ relative performance. In addition, superior forecast-based industry knowledge has important implications for analysts: In particular, analysts with higher industry-specific prior accuracy are more likely to issue more informative forecasts, are more likely to be All-Stars and have more favorable career outcomes, respectively.
Keywords: Sell-side analysts, Forecast accuracy, Industry knowledge
Cite this paper: Niklas Blümke, Industry-Specific Prior Accuracy as a Measure for Sell-Side Analysts’ Industry Knowledge, International Journal of Finance and Accounting , Vol. 13 No. 1, 2024, pp. 1-19. doi: 10.5923/j.ijfa.20241301.01.
Article Outline
1. Literature Review
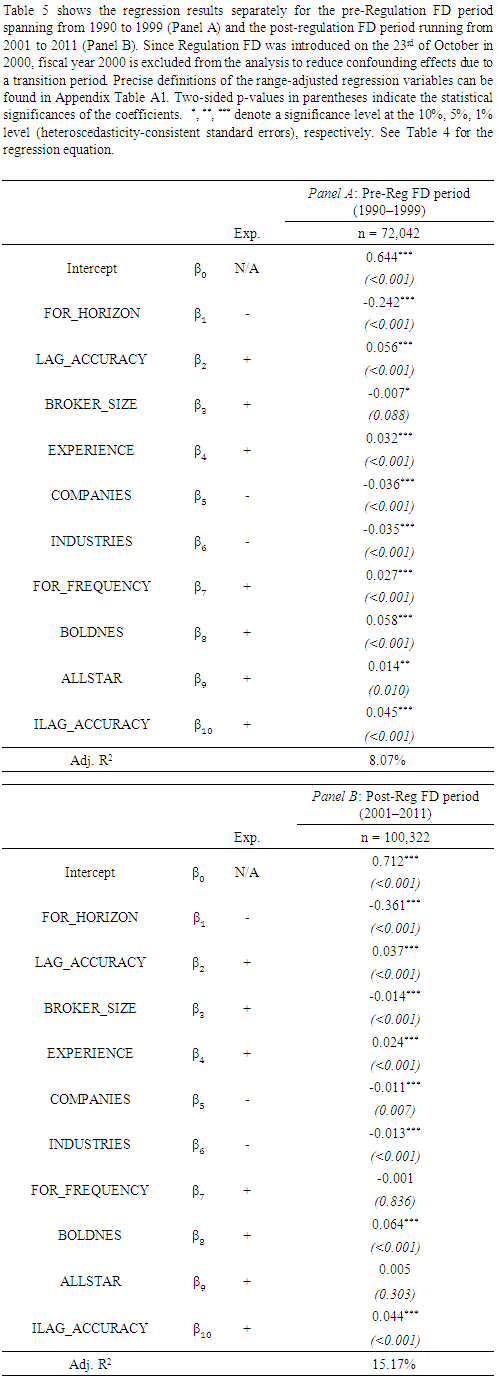
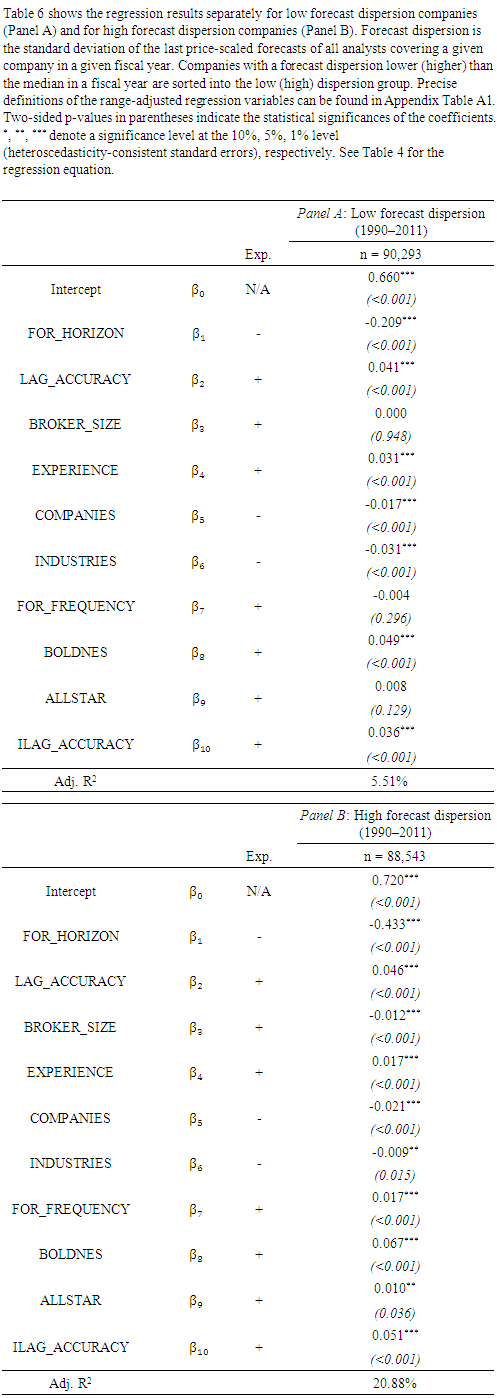
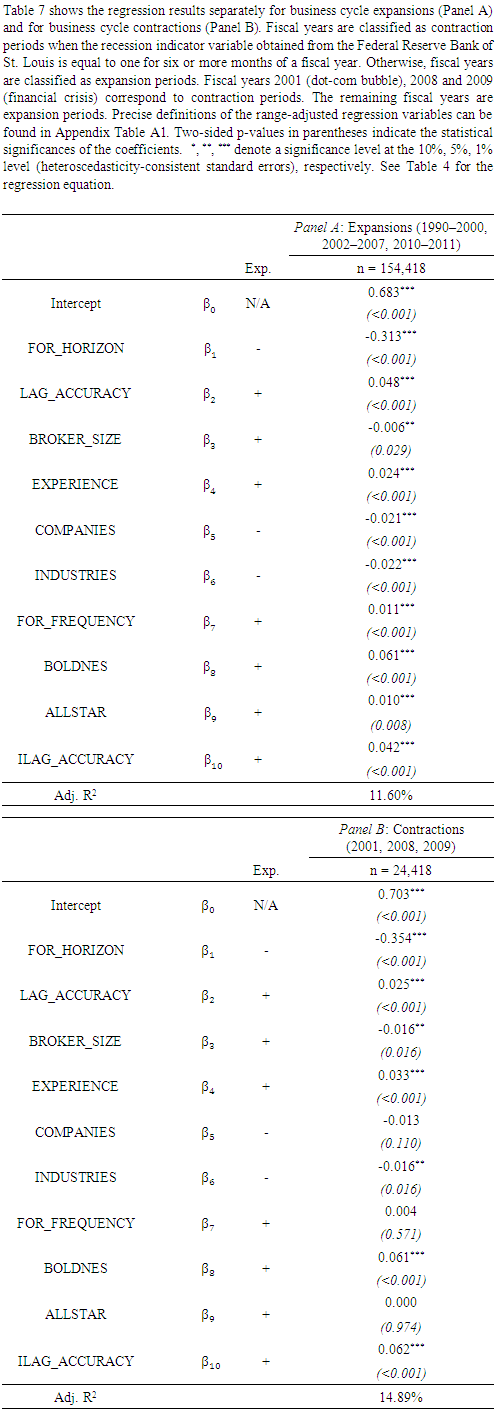
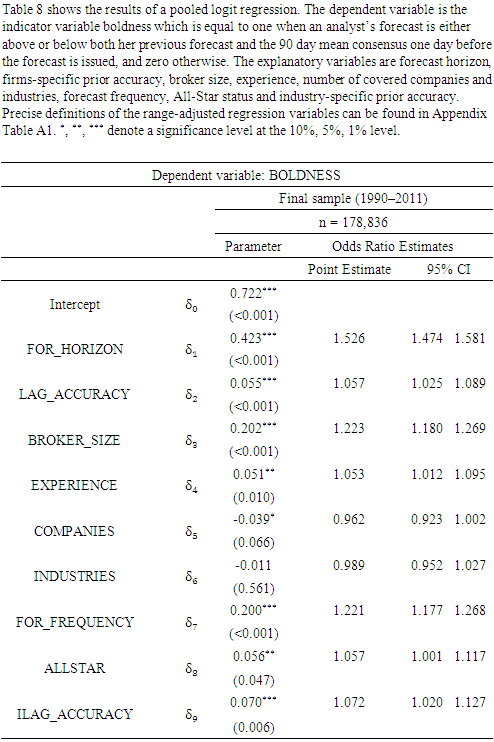
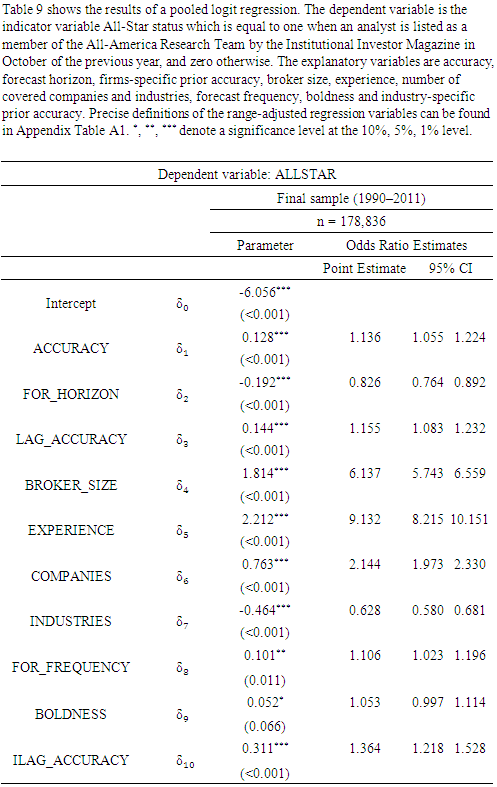
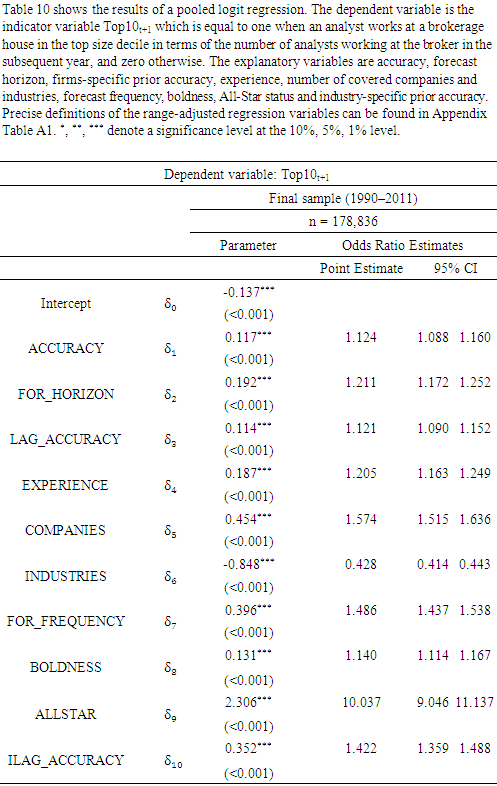
- Sell-side analysts are highly important for financial markets.1 Employed by brokerage houses and investment banks, they serve as information intermediaries between the companies they cover and market participants such as investors (e.g., Schipper (1991)).2 Analysts’ main task is to issue written research reports which typically contain three key elements: A forecast for the company’s future earnings, a stock price target and a stock recommendation (e.g., Bradshaw (2002), Bradshaw, Brown and Huang (2013)). Of these three components, the earnings forecast is the most fundamental one. This is because analysts frequently base their price targets and stock recommendations on simple earnings multiples (Asquith, Mikhail and Au (2005), Brown et al. (2015)). For example, analysts often use heuristics such as the price to earnings ratio or the price to earnings growth ratio to derive an estimate for the equity value. Correspondingly, Gleason, Johnson and Li (2013) relate the accuracy of analysts’ earnings forecasts to the quality of their price targets. Similarly, Loh and Mian (2006) as well as Ertimur, Sunder and Sunder (2007) find that forecast accuracy is positively associated with the profitability of analysts’ stock recommendations.3Sell-side analysts in general and their earnings forecasts in particular are a promising field of study for three reasons. First, it has long been established that analysts’ earnings forecasts outperform timeseries models in terms of accuracy and function as superior proxies for market expectations (Brown and Rozeff (1980), Fried and Givoly (1982)). Second, analysts’ forecasts of future earnings are widely used by academics and practitioners as inputs for equity valuation models and to calculate implied cost of capital estimates (e.g., Dechow, Hutton and Sloan (1999), Claus and Thomas (2001), Gebhardt, Lee and Swaminathan (2001)). Third, existing literature suggests that sellside analysts’ research is used by buy-side analysts as well who work for money management firms such as mutual funds (Groysberg, Healy and Chapman (2008), Ljungqvist et al. (2007)). That is, the output generated by sell-side analysts might also influence the investment decisions of the portfolio managers of these funds. Thus, sell-side analysts’ earnings forecasts play a crucial role in capital markets and constitute an interesting topic for future research.Prior literature, however, finds that sell-side analysts are not equally skilled in terms of their forecasting abilities.That is, prior literature has established that individual analysts vary substantially in their forecast accuracy (e.g., Sinha, Brown and Das (1997)) and that these differences can be explained by various analyst and forecast characteristics. For instance, analysts’ relative forecast accuracy has been linked to their working experience, to their employer size, to their portfolio complexity (e.g., Clement (1999)) or to the effort they exert to the forecasting task (e.g., Jacob, Lys and Neale (1999)). Besides, more recent papers even associate analysts’ accuracy with their political views (Jiang, Kumar and Law (2016)) or show that analysts located near terroristic attacks are less optimistic and, thus, more accurate (Antoniou, Kumar and Maligkris (2016)).While the explanation of differences in analysts’ relative earnings forecast accuracy has been subject to a large body of research, academics and especially practitioners consistently highlight the importance of analysts’ industry knowledge (e.g., Bagnoli, Watts and Zhang (2008), Bradley, Gokkaya and Liu (2017)). For example, Brown et al. (2015) note that surveys by the Institutional Investor (II) Magazine emphasize the value of analysts’ industry knowledge. Moreover, a large survey by Brown et al. (2015) themselves supports this notion. Among others, the authors find that industry knowledge is a major determinant of analysts’ compensation.In this paper, I bring these two strands of literature together. That is, I introduce analysts’ industryspecific prior accuracy as a determinant of current relative accuracy and, at the same time, as a forecast-based measure for industry knowledge. Using a sample of 178,836 oneyear ahead earnings forecasts issued within 1990 and 2011, I regress analysts’ industry-specific prior accuracy on relative performance.4 Thereby, I control for a comprehensive set of analyst and forecast characteristics such as analysts’ experience, broker size or the number of covered companies and industries, which are known to be linked to relative accuracy (e.g., Blümke, Hess and Stolz (2017)).First, the results indicate that analysts’ industry-specific prior accuracy is an important determinant of relative performance. The coefficient estimate is not only highly significant but also third largest in absolute values, as compared to the remaining analyst and forecast characteristics.5 For example, the coefficient on industry-specific prior accuracy surpasses the coefficient estimates on other wellknown determinants of relative accuracy such as forecast frequency, general experience or the size of the brokerage.6 This result is in line with Bradley, Gokkaya and Liu (2017) who show that preanalyst industry working experience, as an alternative measure for industry knowledge, increases accuracy.Second, the association of industry-specific prior accuracy with relative performance does not diminish after the introduction of the Regulation Fair Disclosure (Reg FD). Thus, the effect does not seem to be influenced by managements’ selective disclosure of private information to certain analysts. In contrast, some of the established determinants of analysts’ relative accuracy such as an analysts’ forecast frequency, for instance, lose their significance in the post-Reg FD period. This is consistent with Keskek et al. (2017) who report a decrease in the explanatory power of some common analyst and forecast characteristics after the introduction of Reg FD but an increase in the importance of firmspecific prior accuracy.Third, I examine whether industry-specific prior accuracy is more helpful to explain differences in relative accuracy when uncertainty is high. That is, when the identification such differences is most interesting. In particular, I divide the sample into two parts. On the one hand, I run the regression separately for companies with a low or a high dispersion of analysts’ forecasts (e.g., Blümke, Hess and Stolz (2017)). On the other hand, I estimate the effect the forecast-based measure for industry knowledge separately in periods of business cycle expansions and contractions, respectively. The results suggest that the influence of industryspecific prior accuracy on relative performance is more pronounced for high dispersion companies and in contraction periods, respectively. In other words, industryspecific prior accuracy seems to be particularly helpful to explain analysts’ relative accuracy when uncertainty is high, that is, when it is most interesting.Having established the positive association between industry-specific prior accuracy and current relative accuracy, I next assess the connection between forecast-based industry knowledge and the informativeness of analysts’ forecasts, their All-Star status and their career outcomes, respectively.First, I follow Clement and Tse (2005) and explain analysts’ boldness by industry-specific prior accuracy while additionally including the remaining analyst and forecast characteristics. An analyst’s boldness is an indicator variable equal to one if her forecast is above (or below) both her previous forecast and the outstanding consensus. Otherwise, it is equal to zero. Clement and Tse (2005) suggest that bold forecasts are issued by analysts with superior private information. I find that industryspecific prior accuracy is a significant determinant of analysts’ boldness, even after taking into account the comprehensive set of control variables. For example, analysts with the highest level of industry-specific prior accuracy are 1.072 times more likely to issue a bold forecast than analysts with the lowest level of industryspecific prior accuracy.Second, following Kumar (2010), I examine the relation between industry-specific prior accuracy and reputation as measured by the likelihood of being an II All-Star analyst. Every year in October, the II Magazine publishes the so-called All-America Research Team. Existing studies find that AllStar analysts possess fundamentally different characteristics than their peers. For example, Stickel (1992) shows that analysts nominated as All-Stars outperform their non-All-Star peers. In addition, Groysberg, Healy and Maber (2011) find that All-Star analysts earn a substantially higher compensation. Most importantly, my results indicate that industry-specific prior accuracy has a significant and positive effect on an analyst’s chance to be a member of the All-America Research Team.Third, similar to Keskek et al. (2017), I evaluate the degree to which industry-specific prior accuracy influences analysts’ career outcomes. That is, I define an indicator variable equal to one if an analyst works at a top size decile brokerage in terms of the number of analysts employed in the following year. Otherwise, the variable is set to zero (e.g., Clement (1999)). I choose this variable since the size of the brokerage is related to its status and because analysts employed at larger brokers earn a higher compensation (Hong and Kubik (2003)). I find that the likelihood of a favorable career outcome significantly increases with analysts’ forecastbased industry knowledge. In summary, industryspecific prior accuracy is an important determinant of current relative performance. This relation holds both before and after the introduction of Reg FD, for low and high dispersion companies and in business cycle expansions and contractions, respectively. Furthermore, analysts with superior forecast-based industry knowledge issue more informative forecasts, are more likely to be All-Stars and have more favorable career outcomes, respectively.Closely related to my research is the paper by Bradley, Gokkaya and Liu (2017). The authors handcollect biographical information on analysts’ employment before becoming an analyst and match this data to the firms being followed. Analysts are then classified as industry experts if they have previously worked in the industry of the covered firm. Among others, Bradley, Gokkaya and Liu (2017) show that these analysts issue more accurate earnings forecasts, are more likely to be elected as All-Stars and generate stronger market reactions. While the results of Bradley, Gokkaya and Liu (2017) are in line with the findings provided in this paper, my forecast-based measure for industry knowledge is more readily observable. That is, I claim that is it generally easier to find information on (industry-specific) prior accuracy than to hand-collect each analyst’s previous employment data from LinkedIn.com, for instance. Correspondingly, Bradley, Gokkaya and Liu (2017) themselves state that “[…] industry knowledge is inherently difficult to measure”. I propose an intuitive and easy solution to this issue by computing analysts’ industryspecific prior accuracy as a forecast-based measure of industry knowledge. Moreover, Bradley, Gokkaya and Liu (2017) do not evaluate the effect of preanalyst industry experience on boldness and do not differentiate between companies with a low or high forecast dispersion as well as between business cycle expansion and business cycle contraction periods, respectively. Besides, my study is related to Brown and Mohammad (2010) who show that analysts’ general forecasting abilities are incremental to their firmspecific forecasting abilities.7 While controlling for firm-specific lagged accuracy, the authors find that general lagged accuracy for all other covered firms also helps to explain relative performance.8 In contrast, I evaluate the effect of industryspecific prior accuracy both before and after the introduction of Reg FD, for low and high dispersion firms as well as in expansions and contractions, respectively. In addition, I examine whether forecastbased industry knowledge influences an analyst’s boldness, her All-Star status and her career outcomes, respectively.I make three contributions to the existing literature on sell-side analysts. First, I introduce industryspecific prior accuracy as an important determinant of current relative performance and as a forecast-based proxy for industry knowledge. Second, I show that the influence of this characteristic is pronounced not only during the preReg FD period but afterwards as well. Likewise, it does not diminish for low or high dispersions companies and in periods of expansions and contractions, respectively. Third, I find that this forecast-based measure for industry knowledge is also associated positively with the likelihood of issuing more informative forecasts, being an All-Star and working at a highstatus brokerage in the future, respectively.Besides, my study has three major theoretical and practical implications. First, the usefulness of industry-specific prior accuracy in explaining current relative accuracy implies that superior consensus forecasts could be created. In turn, these consensus forecasts could be used to enhance firm valuations or estimations of a company’s implied cost of capital. Second, prior studies find that analysts’ earnings forecast accuracy is related to the accuracy of their stock price target forecasts and to the performance of their stock recommendations (e.g., Loh and Mian (2006), Ertimur, Sunder and Sunder (2007), Gleason, Johnson and Li (2013)). Thus, to follow analysts with superior forecast-based industry knowledge might also enable the identification of profitable trading strategies. Third, the results suggest for brokerages to hire analysts with superior industry-specific prior accuracy as these analysts outperform their peers.The remainder of the paper is organized as follows. Chapter 2 describes the research design. Chapter 3 explains the data and sample selection restrictions. Chapter 4 reports the empirical results and Chapter 5 concludes.
2. Research Design
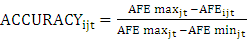
- I am interested in the effect of analysts’ industry-specific prior accuracy on their current accuracy, relative to all analysts following the company in a given fiscal year. Thus, I standardize analyst i’s last forecast for company j issued in fiscal year t to obtain a relative accuracy measure (e.g., Clement and Tse (2005)).
 | (1) |
 is analyst i’s absolute forecast error for company j in fiscal year t.
  and
and  are the maximum and minimum absolute forecast errors of all analysts covering company j in fiscal year t. Correspondingly, the independent variables are range-adjusted as follows.9
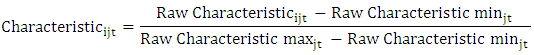 | (2) |
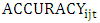 of zero (one) is least (most) accurate in a given fiscal year, relative to all analysts following the firm. The same holds for the independent variables. For instance, an analyst with a range-adjusted forecast frequency of zero (one) has issued the least (most) forecasts of all analysts covering the company in a given fiscal year. This rangeadjustment between zero and one now allows to directly compare the estimated regression coefficients and, thereby, the influence of each explanatory variable on relative accuracy.I then regress analysts’ relative performance on their industry-specific prior accuracy as well as on a comprehensive set of control variables (e.g., Blümke, Hess and Stolz (2017)).
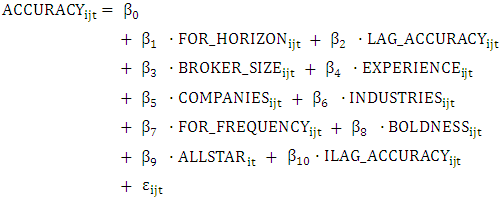 | (3) |
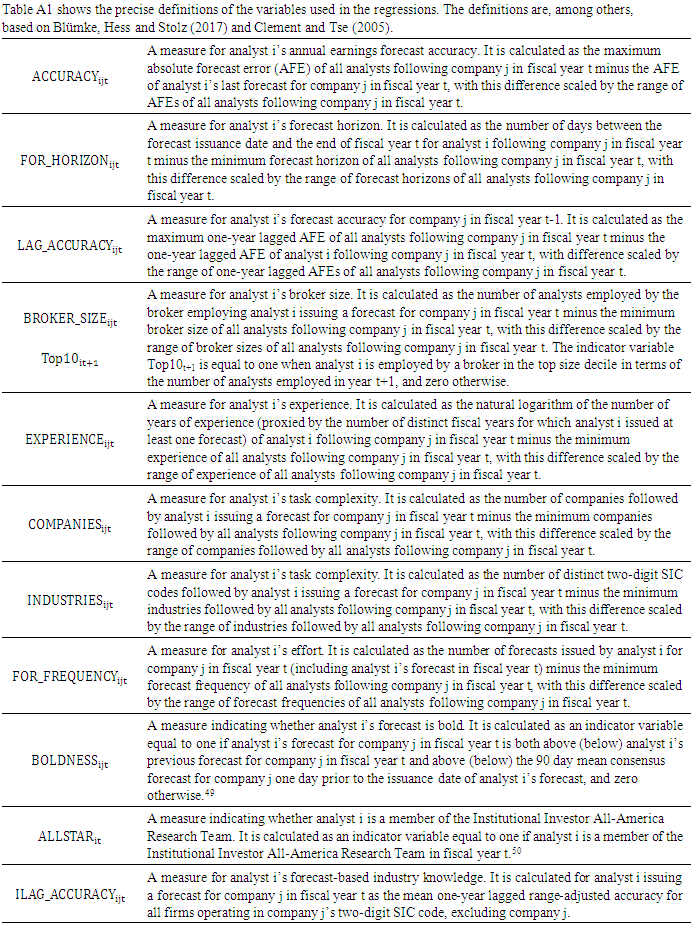
 which I expect to be positive and significant. Following Klettke, Homburg and Gell (2015), I compute analysts’ industry-specific prior accuracy based on their range-adjusted firm-specific prior accuracy.10 Specifically, I calculate the forecast-based proxy for industry knowledge as the average range-adjusted prior accuracy for all firms operating in the given firm’s industry, excluding that firm.11 I separately include analysts’ firm-specific prior performance (e.g., Brown (2001)) since I am interested in the incremental effect of industry-specific prior accuracy.Besides, I use an analyst’s forecast horizon, broker size, experience, portfolio complexity, forecast frequency, boldness and All-Star status as additional explanatory variables. The forecast horizon functions as an important control variable for the information available to the analyst at the time the forecast is issued (e.g., Brown and Mohd (2003)). Broker size in terms of the number of analysts employed captures the amount of resources available to the analyst, among others (e.g., Clement and Tse (2005)). The natural logarithm of the number of years of an analyst’s working experience proxies for her learning curve (e.g., Mikhail, Walther and Willis (1997), Jacob, Lys and Neale (1999)). Portfolio complexity, measured by the number of covered companies and industries, respectively, accounts for the difficulty of the forecasting task (e.g., Jacob, Lys and Neale (1999)). Forecast frequency is a proxy for the effort the analyst devotes to forecasting the covered company’s earnings (e.g., Klettke, Homburg and Gell (2015)). An analyst’s boldness indicates if she deviates from her previous forecast and from the outstanding consensus. It is associated with the amount of private information available to the analyst (e.g., Clement and Tse (2005)). An analyst’s All-Star status proxies for her reputation (e.g., Stickel (1992)). More precise variable definitions can be found in Appendix Table A1.In line with the findings by previous research, I expect firm-specific prior accuracy, broker size, experience, forecast frequency, boldness and AllStar status to have a significantly positive effect on relative accuracy. In contrast, forecast horizon as well as the number of covered companies and industries are supposed to have a significantly negative influence (e.g., Blümke, Hess and Stolz (2017)).
3. Data and Sample Selection
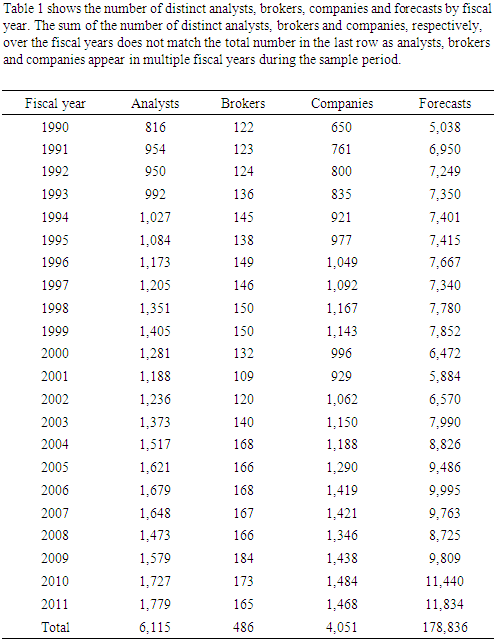
- My primary data source is the Institutional Brokers’ Estimate System (I/B/E/S) from which I obtain analysts’ annual earnings per share forecasts and the corresponding actual earnings in the period between 1990 and 2011.12 Besides, I use COMPUSTAT and the Center for Research in Security Prices (CRSP). From COMPUSTAT, I retrieve annual earnings announcement dates, following Acker and Duck (2009).13 From CRSP, I obtain stock prices to deflate absolute forecast errors as well as adjustment factors to account for stock splits.Consistent with previous literature, I focus my analyses on analysts’ last active one-year ahead forecasts issued before the earnings reporting date (e.g., Brown (2001), Call, Chen and Tong (2009), Brown and Mohammad (2010)).14 Moreover, only forecasts by uniquely identifiable analysts are considered. That is, I drop analysts whose identification code refers to a team, is missing or equal to zero (e.g., Clement (1999), Jacob, Lys and Neale (1999)). Besides, I exclude observations with missing actual earnings, stock prices, adjustment factors and Standard Industrial Classification (SIC) codes. Two-digit SIC codes are needed to categorize the industry a given company operates in (e.g., Clement (1999), Clement and Tse (2005)). Ambiguous forecasts as well as forecasts with inconsistent activation or revision dates, respectively, are classified as data errors and therefore dropped. The same is done with forecasts which do not use the same accounting basis as the majority of the estimates.15 Moreover, in line with O’Brien (1990), Sinha, Brown and Das (1997) and Brown and Mohammad (2010), the sample is restricted to companies with fiscal year-ends in December. Likewise, I delete the first firmyear after a fiscal yearend change as well as the following transition firm-years. Consistent with Clement and Tse (2005), I exclude outliers defined as forecasts with an absolute forecast error of 40.0 percent or more of a company’s stock price. Finally, a minimum of two analysts is required to cover a company as I evaluate the influence of industryspecific prior accuracy on analysts’ relative performance (e.g., Clement, Koonce and Lopez (2007)).16The final sample comprises 178,836 annual earnings forecasts for 4,051 companies issued by 6,115 analysts who are employed by 486 brokerage houses. As shown in Table 1, the number of forecasts increases from 5,038 in 1990 to 11,834 in 2011.
|
4. Results
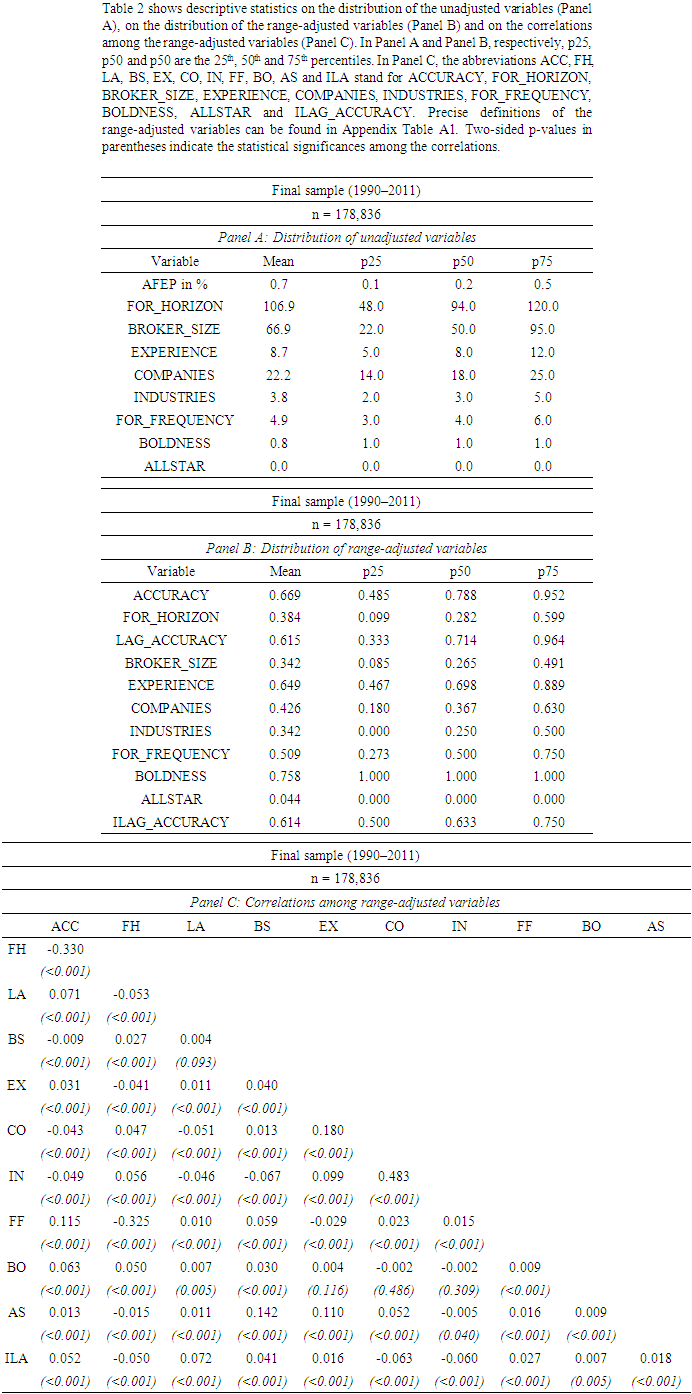
- Descriptive statisticsBefore examining the relation between industry-specific prior accuracy and current relative performance, I first provide some descriptive statistics. Table 2 shows the distribution of the unadjusted variables (Panel A), the distribution of the range-adjusted variables (Panel B) and the correlations among the rangeadjusted variables (Panel C). The distribution of the variables before applying the range-adjustment in Panel A of Table 1 is comparable to existing literature (e.g., Clement and Tse (2005), Klettke, Homburg and Gell (2015)). For example, analysts issue almost five forecasts in a given firm-year and follow around 22 companies operating in about four industries, on average. While the average brokerage size of about 67 analysts is larger than in prior studies (e.g., Clement and Tse (2003)), more recent papers report similar figures (e.g., Klettke, Homburg and Gell (2015)). Panel B of Table 2 shows the distribution of the variables after the adjustment. Correspondingly, all variables range from zero to one. The distribution is broadly consistent with prior literature as well (e.g., Clement and Tse (2005)). Last, Panel C of Table 2 reports the correlations among the adjusted variables. Analysts’ relative accuracy is significantly correlated with all explanatory variables, including industry-specific prior accuracy. In particular, there is a positive correlation between accuracy and analysts’ firm-specific prior accuracy, working experience, forecast frequency, boldness, All-Star status and, most importantly, industry-specific prior accuracy. Likewise, accuracy is negatively correlated with the forecast horizon, the number of covered companies and industries, as well as with the size of analysts’ brokerages.17As broker size is a proxy for the available resources and for the access to the management of the followed firm (e.g., Clement (1999)), the latter result is somewhat surprising.18 Note, however, that there is also evidence on a negative relation between analysts’ relative accuracy and the size of their employers (e.g., Bonner, Walther and Young (2003), Sonney (2009)). In this context, Keskek et al. (2017) show that broker size positively affects analysts’ performance only before the introduction of Regulation Fair Disclosure (Reg FD). In the post-Reg FD period, the coefficient estimate becomes significantly negative. The authors explain this finding with the restricted access of analysts employed by large brokerages to the covered company’s management after the enactment of Reg FD.Industry-specific prior accuracy, on the other hand, is also significantly correlated with the remaining analyst and forecast characteristics. For instance, a higher industry-specific prior accuracy is associated with a lower forecast horizon and a lower task complexity. In turn, analysts with superior forecast-based industry knowledge work at larger brokers, are more experienced, issue more forecasts and are more likely to be bold and All-Stars, respectively.19
|
|
|
|
|
|
|
|
|
 from analyst i’s absolute forecast error
  The demeaned absolute forecast error is then scaled by the mean absolute forecast error and multiplied by minus one.41
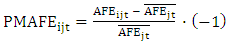 | (4) |
5. Conclusions
- Previous studies have identified several analyst and forecast characteristics that determine relative accuracy such as the number of years of working experience, the size of the brokerage house or even analysts’ political views (e.g., Clement (1999), Jiang, Kumar and Law (2016)). Of all these determinants, however, analysts’ industry knowledge is frequently named by academics and practitioners as the most important characteristic (e.g., Bagnoli, Watts and Zhang (2008), Brown et al. (2015)). Therefore, this paper introduces analysts’ industry-specific prior accuracy as an easily observable measure for industry knowledge. The results show that the forecastbased proxy for industry knowledge is positively and significantly associated with relative performance. Furthermore, the performance advantage of analysts with higher industryspecific prior accuracy is presumably caused by a superior interpretation of industry-relevant public information. In other words, it is not due to management providing analysts with private information. This is because the positive influence on relative accuracy does not diminish after the introduction of Regulation Fair Disclosure which prohibits the selective dissemination of private information from companies to analysts and other market participants (e.g., Bradley, Gokkaya and Liu (2017)). In contrast, some other wellknown accuracy determinants lose statistical significance in the postregulation period (Keskek et al. (2017)). Besides, industry-specific prior accuracy appears to be particularly helpful when the explanation of differences in analysts’ performance is most interesting, that is, when uncertainty is high. Moreover, the results indicate that the acquisition of forecast-based industry knowledge has positive consequences for analysts beyond the influence on relative performance. Specifically, industryspecific prior accuracy has a significantly positive effect on the likelihood to issue a bold forecast, to be an All-Star and to work at a prestigious brokerage house in the future, respectively (e.g., Bradley, Gokkaya and Liu (2017), Keskek et al. (2017)).These findings have three important theoretical and practical implications. First, more accurate consensus forecasts could be calculated by increasing the weight of analysts with superior forecast-based industry knowledge. Consequently, the more accurate consensus forecasts could be used in the context of company valuation or implied cost of capital estimation. Second, following analysts with higher industryspecific prior accuracy might enable investors to identify profitable trading strategies. This conjecture is based on the result by existing literature that earnings forecast accuracy is closely linked to stock price target accuracy and recommendation profitability, respectively (e.g., Loh and Mian (2006), Ertimur, Sunder and Sunder (2007), Gleason, Johnson and Li (2013)). Third, the findings suggest that brokerage houses should focus on employing analysts with superior industryspecific prior accuracy since these analysts achieve higher relative performance than their peers.
Appendices
Notes
- 1. The terms “sell-side analysts” and “analysts” are used interchangeably. The same holds for the terms “relative accuracy” and “relative performance”.2. For example, Kelly and Ljungqvist (2012) as well as Bradley, Gokkaya and Liu (2017) find that closures of brokerage houses as a proxy for exogenous stock coverage terminations by analysts increase information asymmetries.3. In addition, the results by Park and Stice (2000) and by Clement and Tse (2003) indicate that earnings forecasts by accurate analysts generate more pronounced stock market reactions than the forecasts by their inaccurate peers.4. In this context, the terms “(relative) accuracy” and “(relative) performance” are used interchangeably.5. As explained in Chapter 2, the dependent variable as well as the independent variables are adjusted and range from zero to one. Therefore, the absolute values of the coefficient estimates are directly comparable (Klettke, Homburg and Gell (2015)).6. Only the coefficient estimates on boldness and the control variable forecast horizon are larger in absolute values.7. Similarly, Brown (2001) finds that firm-specific lagged accuracy is a major determinant of current relative accuracy.8. When I additionally include analysts’ prior accuracy for all covered firms except those from the given firm’s industry as an alternative measure for general forecasting ability into the regression equation, industry-specific prior accuracy is still highly significant. Furthermore, the coefficient estimate is more than twice as high, indicating that industryspecific prior accuracy is more important than nonindustry-specific prior accuracy. Even when I include general forecasting ability as measured in Brown and Mohammad (2010), the coefficient estimate on industry-specific prior accuracy is still positive and significant (cf. Chapter 4).9. Except for analysts’ firm-specific prior accuracy which is adjusted as the dependent variable, the two indicator variables boldness and All-Star status which already range from zero to one and industry-specific prior accuracy (see next page).10. Note that only the range-adjusted variables account for firm-year effects and can thus be reasonably compared (Klettke, Homburg and Gell (2015)).11. Of course, analysts’ industry-specific prior accuracy ranges from zero to one as well.12. To measure analysts’ experience more reliably and to calculate analysts’ prior accuracy in 1990, I initially retrieve forecasts issued as early as 1981.13. Besides, I require earnings announcement dates to be consistent. For example, I drop firm-years in which companies report their earnings more than 90 days after the fiscal year-end as this violates the U.S. Securities and Exchange Commission disclosure rules (cf. https://www.sec.gov/answers/form10k.htm). The filter, however, affects only less than one percent of all observations. Moreover, the results remain unchanged if I do not apply the filter.14. Duplicates are already dropped in the initial sample.15. These forecasts are labeled as excluded by I/B/E/S (cf. Thomson Reuters (2013)).16. The application of the filters is specific to the unadjusted variable being calculated. For more details regarding the sample construction, see Blümke, Hess and Stolz (2017).17. I find a significantly negative coefficient on broker size in the multivariate regression as well (see below).18. Correspondingly, several studies report a positive association between relative accuracy the size of analysts’ brokerages (e.g., Clement, Rees and Swanson (2003), Dunn and Nathan (2005), Herrmann and Thomas (2005), Malloy (2005)). In contrast, Call, Chen and Tong (2009), Keung (2010) as well as Klettke, Homburg and Gell (2015) do not find that relative accuracy is significantly influenced by the broker size.19. These results are confirmed in a multivariate analysis in which I regress industry-specific prior accuracy on the remaining control variables (unreported). In particular, all coefficient estimates have the same signs as in the correlation matrix and are significant at the 1 percent level (except for analysts’ boldness which is significant at the 10 percent level).20. I partition the whole sample in one step instead of splitting each firm-year separately. This is possible because all variables are adjusted such that they range from zero to one and thereby account for firm-yearspecific influences (cf. Chapter 2 as well as Klettke, Homburg and Gell (2015)).21. The standard errors are heteroscedasticity-consistent. Note that the range-adjustment already controls for firmyear effects.22. The results remain robust when I additionally include the industry specialization of the analyst, the industry specialization of the broker (Jacob, Lys and Neale (1999)) or the industry experience of the analyst into the regression equation (Mikhail, Walther and Willis (1997); cf. Chapter 4).23. Specifically, Sonney (2009) uses an indicator variable for sector-specialists in his accuracy regression. This indicator variable is based on a Herfindahl Index (HI) which is computed for every analyst in every year in two steps. First, for each sector, the ratio of the number of companies covered by the analyst in the sector to the total number of companies covered in a given year is calculated. Second, the ratios are summed across sectors to obtain the HI.24. Even though some of the remaining independent variables such as the number of covered companies and the number of covered industries exhibit a high and significant correlation, multicollinearity does not seem to be a problem. Specifically, no variance inflation factor (VIF) of any explanatory variable is greater than 2. According to Wooldridge (2013), only a VIF greater than 10 may suggest that multicollinearity is an issue.25. The adjusted coefficient of determination of 12.04 percent is roughly similar to the adjusted R2s reported by previous studies (e.g., Clement (1999), Herrmann and Thomas (2005), Keskek et al. (2017)). If I exclude analysts’ industryspecific prior accuracy from the regression equation, the adjusted R2 decreases to 11.96 percent (unreported).26. Correspondingly, Findlay and Mathew (2006) find that the coefficient on the size of the brokerage house as well as the one on firmspecific experience lose influence post-Reg FD. This is because these two variables proxy for the flow of private information from management to analysts.27. The results remain qualitatively unchanged when I do not exclude fiscal year 2000 or when I extend the transition period to fiscal years 2001, 2002 and 2003, respectively (unreported).28. The adjusted coefficient of determination, however, increases in the post Reg-FD period.29. The data are publicly available (cf. https://fred.stlouisfed.org/series/USREC) and were originally published by the National Bureau of Economic Research (cf. http://www.nber.org/cycles/cyclesmain.html).30. Consistent with Clement and Tse (2005), I exclude analysts’ current relative accuracy as an explanatory variable.31. In line with Clement and Tse (2005), I use the 90 day mean consensus forecast. Following Blümke, Hess and Stolz (2017), I further set the indicator variable boldness equal to zero for an analyst’s first forecast in a given fiscal year as there is no previous forecast in these instances.32. Note that the regression variables are adjusted and range from zero to one. Thereby, a value of zero (one) indicates the lowest (highest) level of a variable among all analysts in a given firm-year. For instance, an analyst with a rangeadjusted broker size of zero (one) works at the smallest (largest) broker, relative to all analysts issuing forecasts in the firm-year. The odds ratio for an independent variable in the logistic regression is the change in odds if the that variable changes by one unit (that is, increases from the lowest to highest level), holding constant the remaining independent variables (Clement and Tse (2005); cf. University of California, Los Angeles, Institute for Digital Research and Education, https://stats.idre.ucla.edu/sas/output/proc-logistic/).33. Clement and Tse (2005) find a significant influence of the number of covered industries on boldness. Their coefficient estimate on the number of covered companies, however, is not significant. This might be due to the high correlation between these two explanatory variables.34. In line with Kumar (2010), the indicator variable All-Star status is equal to one for analysts who were voted into the All-America Research Team in October of the previous year. Otherwise, the variable is set to zero.35. Kumar (2010) reports results which are generally similar. Two exceptions are the non-significant coefficients on accuracy and on forecast horizon in his regression. My results remain robust when I exclude accuracy from the regression equation (unreported).36. See Klettke, Homburg and Gell (2015) for a similar argument.37. This implies that analysts’ industry-specific prior accuracy is measured slightly different here as it includes firmspecific prior accuracy. Thus, the latter variable is dropped from the regression equation and industry-specific prior accuracy functions as a proxy for overall prior performance. To ensure that the measure still approximates industry knowledge, I restrict the sample to analysts who only cover firms from a single industry in a given fiscal year, retaining 58.6 percent of the initial observations in this robustness check.38. In other words, an analyst’s career outcome is defined as favorable when she stays at or moves to a top size decile brokerage house in the subsequent year (Hong and Kubik (2003)).39. The other analyst and forecast characteristics are significant at the 1 percent level as well. The likelihood to work at a high status brokerage increases with analysts’ (prior) accuracy, forecast horizon, experience, number of covered companies, forecast effort, boldness and All-Star status but decreases with the number of industries followed.40. As with an analyst’s All-Star status, it can be argued that Top10t+1 is an analyst-year-specific and not an analyst-firm-year-specific variable. In particular, whether an analyst works at a prestigious broker is constant for all firms covered in a given year. Therefore, I again re-estimate the regression but replace analysts’ accuracy, forecast horizon, forecast frequency, boldness and industry-specific prior accuracy by the respective average values for all companies covered in each year and restrict the sample to analysts who solely follow firms from one industry. The results remain unchanged. The same holds true when I do not lead Top10t+1 by one year and when I exclude accuracy from the regression equation (unreported).41. The explanatory variables are demeaned as well. Thus, the PMAFE also accounts for firmyear-specific influences.42. Interestingly, the coefficient estimate on broker size in the pooled regression becomes significantly positive when the PMAFE is used as the dependent variable.43. All-Star status, however, is now insignificant in this regression specification (pooled analysis).44. In contrast, Brown and Mohammad (2010) compute general prior performance for analyst i in year t as the average prior accuracy for all covered firms, except firm j. The coefficient estimate on industry-specific prior accuracy even remains positive and significant at the 5 percent level when general prior accuracy as measured in Brown and Mohammad (2010) is alternatively included into the regression.45. Firm-specific prior accuracy is excluded from the regressions in this robustness check.46. This is probably due to the high correlation between general and industry experience of 0.896 (pvalue < 0.001). When I exclude general experience from the pooled regression, the coefficient estimate on industry experience becomes significant at the 1 percent level. The coefficient on industry-specific prior accuracy, however, stays significantly positive and is about 1.8 times larger than the one on industry experience (0.025 vs. 0.045).47. An analyst’s industry specialization and broker specialization are both calculated in absolute and relative terms. That is, an analyst’s absolute (relative) industry specialization is computed as the number of companies covered in each industry (relative to the total number of companies covered in a given fiscal year). The absolute (relative) broker specialization is the number of analysts covering companies from the same industry (relative to the total number of analysts working at the broker in a given fiscal year).48. The coefficient estimates on broker size and All-Star status, in turn, are not significant at conventional levels in this pooled regression analysis.49. Following Blümke, Hess and Stolz (2017), I set boldness equal to zero for analyst i’s first forecast for company j in fiscal year t since there is no previous forecast in these cases.50. The All-America Research Team is compiled by the Institutional Investor Magazine each year in October (Green, Jegadeesh and Tang (2009)). Therefore, the indicator variable All-Star status is equal to one when forecasts are issued in between November in the year of the All-Star nomination and October in the year afterwards, and zero otherwise (Blümke, Hess and Stolz (2017)).