-
Paper Information
- Paper Submission
-
Journal Information
- About This Journal
- Editorial Board
- Current Issue
- Archive
- Author Guidelines
- Contact Us
International Journal of Finance and Accounting
p-ISSN: 2168-4812 e-ISSN: 2168-4820
2022; 11(2): 61-74
doi:10.5923/j.ijfa.20221102.03
Received: Nov. 1, 2022; Accepted: Nov. 11, 2022; Published: Nov. 14, 2022

Effect of Fundamental Firm Characteristics on Operational Efficiency of Microfinance Banks in Kenya
 Abstract
 Reference
 Full-Text PDF
 Full-text HTML
Christian Dominic Witila1, Ibrahim Tirimba Ondabu2
1Department of Economics, Accounting and Finance, Jomo Kenyatta University of Agriculture and Technology, Nairobi, Kenya
2Department of Economics, Accounting and Finance, KCA University, Nairobi, Kenya
Correspondence to: Ibrahim Tirimba Ondabu, Department of Economics, Accounting and Finance, KCA University, Nairobi, Kenya.
| Email: |  |
Copyright © 2022 The Author(s). Published by Scientific & Academic Publishing.
This work is licensed under the Creative Commons Attribution International License (CC BY).
http://creativecommons.org/licenses/by/4.0/

This study seeks to examine the effect of fundamental firm characteristics on the operational efficiency of microfinance banks in Kenya. The independent variables were: firm size, liquidity, leverage, cash reserves and asset tangibility. Descriptive research design was adopted, and study collected data from twelve (12) licensed microfinance banks in Kenya. This study adopted panel data regression model to analyse data with the assistance of STATA version 12. The analysed data was presented using tables and figures. The study found that firm size and asset tangibility had statistically significant positive effect on operational efficiency of microfinance banks in Kenya. The study further found that that liquidity, leverage and cash reserve had statistically insignificant negative effect on operational efficiency of microfinance banks in Kenya. The study recommends that microfinance banks should embrace asset tangibility on their strategic decision making and also that they can issue more debt as a strategy for more revenue generation. Also, the Central Bank of Kenya should formulate and enact a policy which makes commercial debt cheaper hence reduce cost of operations of microfinance banks so as to reduce interest rates in order to attract investors who will inject more funds into these financial firms. The study also recommends that microfinance banks ought to increase their network of branches countrywide to attract new customers to open new accounts and in so doing increase their deposits and that the Central Bank of Kenya should formulate policies that encourage microfinance banks to invest more in research and development and innovation so as to enable microfinance banks to design and develop competitive products or services that add value to the customers and which will foster their growth at large.
Keywords: Firm size, Liquidity, Leverage, Cash reserves, Asset tangibility, Operational efficiency
Cite this paper: Christian Dominic Witila, Ibrahim Tirimba Ondabu, Effect of Fundamental Firm Characteristics on Operational Efficiency of Microfinance Banks in Kenya, International Journal of Finance and Accounting , Vol. 11 No. 2, 2022, pp. 61-74. doi: 10.5923/j.ijfa.20221102.03.
Article Outline
1. Introduction
- Operational efficiency has attracted much interest in corporate finance literature over several decades. However, in the context of agricultural sector, it has received little attention in developing economies such as Kenya. Fundamental firm characteristics such as liquidity, leverage and investments produce a positive effect on the operational efficiency of a firm [1]. One of the main factors that affect the solvency of businesses in the long run is operational efficiency and more so there are firm specific factors that determine operational efficiency. The concept of operational efficiency is attracting a lot of attention because of increasing competition, new technology and dynamic business processes [2].The conceptual relationship between fundamental firm characteristics and operational efficiency can be anchored on stakeholder’s theory, stewardship theory, agency theory and wealth maximization theory [3], trade off theory, liquidity preference theory, economies of scale theories and financial distress theory [4] and, Baumol inventory model and Miller – Orr Cash management model [5].Firm characteristics are distinct features of a firm such as ownership structure, capital structure, firm age, firm size, number of employees and liquidity level [6]. [7] stated that fundamental factors such as turnover, growth in sales and assets, liquidity, leverage and firm size constitute a firm’s characteristics. Other firm characteristics consist of the structure of ownership, how old the firm is, board characteristics, dividend policy, capital market accessibility, profitability and avenues for growth [8].This study used the log of total assets to measure firm size. Many studies have used the log of total assets as the proxy for firm size [4]. [9] stated that liquidity refers to the firm’s ability to pay its short-term financial obligations. Liquidity is key in ensuring that a business firm is functioning successfully. Liquidity refers to the ease of converting assets into cash [10]. Current ratio is a metric that measures the ability of the firm to meet its current obligations when they fall due and a ratio of 2:1 is an indicator of a strong financial position of the firm [11]. Current ratio reflects the ability of the firm to pay its liabilities using its assets thereby it is a measure of financial health [11]. A firm with a high current ratio can meet its obligations when they fall due because of the high value current assets compared to the value of its current liabilities. Leverage denotes using loans as a source of capital to finance a company [12]. Firms finance their investments using either equity and / or debt. Financial leverage refers to the use of a mix of owner’s equity, preference capital and debt in its capital structure. Levered firms employ both debt and owner’s equity while an all-equity firm is referred to as an unlevered firm. Asset tangibility is the ratio of tangible assets to total assets or the ratio of property plant and equipment to total assets [13]; [14]. Managers of competitive firms mix intangible and tangible assets effectively and efficiently [15]. Firms can easily collateralize tangible assets and the loss of value for tangible assets during financial distress is small. There is a positive relationship between tangibility and leverage because firms match the maturity of liabilities with the maturity of assets [16]. A firm’s liquidation value depends on its share of tangible assets because during bankruptcy tangible assets are the collateral for debt.Cash reserves is the money held by the firm to cater for emergencies and a firm holding a large amount of cash reserve is in a better position to pay for unforeseen emergencies. Cash reserves include short term investments that generate low rates of return such as treasury bills. Firms hold cash reserves to pay for emergencies and other short-term needs. Firms with adequate cash reserves have the necessary liquidity to pay for immediate purchases and invest in potential investments while firms with insufficient cash reserves must borrow to remain afloat [11].In financial terms, operational efficiency is a proportion of the yields of a company's actions and strategy [17]. The ratio of actual productivity to the maximum attainable productivity is the real measure of operational efficiency. Desired productivity refers to the maximum possible realizable productivity. Different metrics are used to measure operational efficiency, such as the total asset turnover ratio, which is calculated by dividing net sales by average total assets, the fixed asset turnover ratio, which is calculated by dividing net sales by average net fixed assets, and the equity turnover ratio, which is calculated by dividing net sales by average net fixed assets. These measurements assess a company's capacity to effectively control operational costs and, as a result, influence profitability [18]. The total asset turnover ratio (TATO) will be used to assess operational efficiency in this study.Microfinance institutions have a structure that enables them to reach out to customers of varying gender, age, race right from the grassroots levels [19]. According to [19], these institutions set targets based on gender balance, age balance among other considerations and which makes them superior to conventional banks that have registered gender discriminations.Besides, MFIs can lend without collateral requirements as their main requirement is that of guarantor-ship compared to tangible collateral which especially this target group who are in the low class cannot afford [20]. Therefore, in terms of poverty alleviation and grassroots reach, MFIs have been ranked ahead of the conventional banks [19].Microfinance banks play a critical role to the development of any country. The current situation is that microfinance banks contribute approximately 44% to the Kenyan GDP (in 2008) while accounting for over 40% of the country’s total employment rates and around 80% of all new jobs [21]. The study by [22] established that borrower numbers for microfinance banks in Kenya have changed from 466,700 in 2013 to 264,000 in 2017. This clearly reveals that microfinance banks are essential institutions that should not be overlooked especially on the context of developing nations. The ideal situation if microfinance banks are to be supported by both regulation and enhanced confidence of clients is that microfinance banks should overtake the conventional banks which have been blamed of high interest rates and loaning only in the presence of collateral. [23] reports that microfinance banks had made a loss of Kes322,780,000 compared to a loss of Kes128,400,000 in the year 2016. In general, microfinance banks face a myriad of challenges ranging from product failure, default and high drop-out rates which have a direct bearing on the performance [24]. Failure to protect the interests and growth of microfinance banks could cripple the economy since the poor are dependent on these banks as their last resort when it comes to credit access. Further, In Kenya the microfinance sector has experienced extremely high competition evidenced by the shifting market share and profitability. The competition is among the MFIs sector, mainstream commercial banks and the telecommunication money transfer platforms such as Mpesa [25]. While over the time credit-only institutions have been slowly improving, banks and DTM improved in 2010-2011 but then worsened slightly in 2011-2012. As such, microfinance banks in Kenya have also reported very high competitive pressure in terms of pricing since they have less flexibility to adjust prices due to their financial structure. The causal nexus between fundamental firm characteristics and operational efficiency of the microfinance institutions in Kenya has not received much attention. While it is expected that firm characteristics should influence operational performance positively, [26] established a negative effect on this kind of relationship. On the other hand, [27] established a positive effect while [28] established that there is no clear effect between firm characteristics and operational efficiency. Current studies conducted on firm characteristics and operational efficiency of microfinance banks have therefore being argued to yield mixed reactions. This study sought to clear the air by determining the effect of fundamental firm characteristics on the operational efficiency of microfinance banks in Kenya.
2. Literature Review
2.1. Conceptual Framework
- The conceptual framework below was used to illustrate the relationship between the independent and the dependent variables:
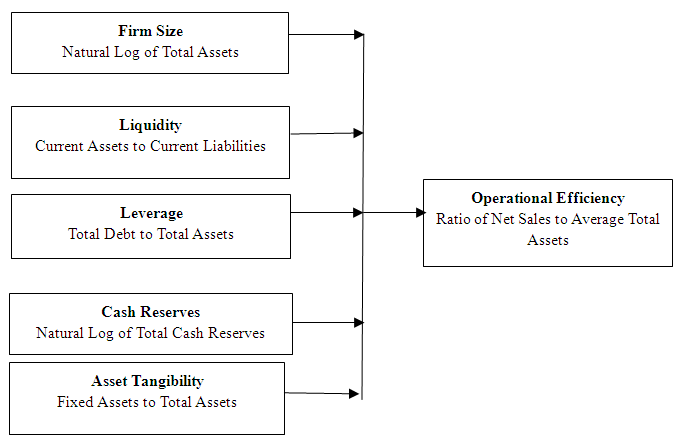 | Figure 1. Conceptual Framework |
2.2. Empirical Review
2.2.1. Firm Size and Operational Efficiency
- [29] examined determinants of financial performance of micro finance banks in Kenya. The study used secondary data and focused on seven microfinance banks in Kenya for the years 2011 to 2015 and applied a descriptive research design. Correlation and regression analysis was used in data analysis. The study found that firm size, capital adequacy, and operational efficiency have a significant positive influence on financial performance of microfinance banks in Kenya.[30] examined the effect of firm size on the financial performance of agricultural companies listed on Nairobi securities exchange. The study used secondary data for the period 2003 to 2013 and the pooled OLS model was used for data analysis. The study used total assets to measure firm size and earnings per share, return on earnings and return on assets to measure financial performance. The study found that total assets as the proxy of firm size has a significant positive effect on financial performance of agricultural companies listed on Nairobi securities exchange. [31] examined the relationship between firm size and financial performance of commercial banks in Kenya using secondary data. The study focused on commercial banks for the period from 1998 to 2012. Number of employees, total deposits, total loans and total assets were used to measure firm size and return on assets was used to measure performance. The study found a statistically significant relationship between total loans, total assets and total deposits, and return on assets. Furthermore, the effect of number of employees on financial performance of commercial banks was not statistically significant.[32] investigated the effect of firm size on the performance of firms in the building industry in Nigeria using secondary data for the period 2004 to 2017. The study used accounting and economic measures to measure performance and the fixed effects model for data analysis. The study found that sales and firm age have a positive significant effect on firm performance. [33] used secondary data from companies registered on the Istanbul stock exchange between 2008 and 2011 to investigate the impact of firm size on profitability. To determine firm size, the researchers looked at total assets, total sales, and the number of employees. Profitability was calculated using the Return on Assets formula. Companies in the financial sector were excluded due to the differences in their financial structures. In order to analyze the data, the researchers employed numerous regression and correlation approaches. Size parameters (number of employees, total sales, and total assets) have a considerable beneficial effect on profitability, according to the study.[34] investigated the connection between firm size and benefit of assembling organizations recorded on Colombo Stock Exchange (CSE) between years 2008 and 2012. The review zeroed in on 15 assembling organizations and utilized numerous relapse and connection models in information examination. Normal logs of all out resources and regular logs of complete deals were utilized to quantify firm size though return on resources was utilized to gauge productivity. The investigation discovered that firm size doesn't significantly affect benefit.[35] examined the influence of firm size on the performance of the manufacturing sector in Croatia for a period of 10 years from 2002. The study used secondary data obtained from creation financial agency website and Amadeus database. The study used natural logarithm of fixed assets and natural logarithm of number of employees to measure firm size. The study found that firm size has a weak positive effect on profitability and stated that the weak relationship is because of separation of ownership and management in modern firms that led to a shift in management focus from profit maximization to managerial utility maximization.
2.2.2. Liquidity and Operational Efficiency
- [36] inspected the impact of internal factors on productivity of commercial banks in Kenya. The review utilized a descriptive research configuration including panel information. Target population comprised every one of the 43 business banks and considering accessibility of five years’ information a statistics study was finished. Empirical outcomes exhibited that liquidity significantly affects benefit, the review noted comparative outcomes for banking risk, store risk, liquidity and bank size. The target population constituted 11 sugar firms registered with Kenya Sugar board 2010 and 5 firms were sampled using purposive sampling technique. The study used the random effects regression model and empirical results revealed that there is a negative insignificant relationship between liquidity management and firm performance. The findings revealed that liquidity negatively affect firm performance indicating that firms in the Kenya sugar industry operate on low cash flows and are highly geared. The firms require asset and liability strategies to improve their performance. [11] sought to establish the relationship between liquidity and financial performance of firms listed on Nairobi securities exchange and evaluated three liquidity ratios. The target population comprised of all the 66 firms listed on Nairobi securities exchange. A sample size of 30 firms was selected using purposive sampling technique. The study covered the period covering 2010 to 2015 by considering consistency in publishing financial statements. The study used causal research design and multiple regression method to determine how each variable affects financial performance. The current ratio has a considerable impact on financial performance, according to the study, and cash reserves have similar implications. [37] sought to determine the effect of financial distress on financial performance of firms listed at Nairobi Securities exchange. The study investigated how liquidity affect listed manufacturing companies in Kenya from 2009 to 2018. The study reported that the effect of liquidity on financial performance of select firms was positive and significant. [38] investigated the interactions between liquidity and viability of non-financial companies listed on Ghana stock exchange using a target population of 28 non-financial firms listed on Ghana stock exchange and a sample 15 companies. The study used purposive sampling. Empirical results revealed that current ratio significantly affects the viability of non-financial companies, different results were noted for cash flow ratio, company size, growth, efficiency, and tangibility. [39] examined the effect of firm characteristics on financial performance and firm value of food and beverage companies listed on Indonesia stock exchange. By using purposive sampling, the sample size was 7 food and beverage companies listed on Indonesia stock exchange, the period considered was 2015 – 2017. Empirical results revealed that liquidity had a significant positive effect on financial performance and the study found different results for efficiency and leverage.[40] used time series data from 1998 Q1 to 2015 Q3 to investigate the impact of liquidity on the financial performance of the Turkish retail business. The goal of the research was to look into the link between liquidity, growth, and profitability. Empirical results indicated that there is a positive and statistically significant relationship between liquidity and profitability in the Turkish retail industry.
2.2.3. Leverage and Operational Efficiency
- [41] sought to find out the relationship between financing strategies and operational efficiency of cooperative societies that take deposits in Nairobi County. This study described the relationship between financing strategies and operational efficiency of deposit taking SACCOs in Nairobi using a target population of 39 SACCOs registered with SASRA as at 2016. The study conducted a census. In conclusion external borrowing, institutional capital and members’ funds have a significant influence on operational efficiency of deposit taking SACCOs. The study found that members’ funds have a strong positive effect on operational efficiency, and the study noted similar results external borrowing, and institutional capital. [42] studied the association between capital structure and the profitability of agricultural companies in Kenya. The study sought to describe how the capital structure affects the profitability of quoted companies in Kenya using a target population of 7 firms. The study constituted a census survey for the period 2011 – 2015. In conclusion relationship between capital structure and earning yield was not significant. Debt to assets ratio had a low positive effect on return on equity. [43] studied the influence of capital structure on performance of agricultural companies listed on NSE. This study examined the effect of debt ratio, financial leverage and debt equity ratio on financial performance using longitudinal research design and a target population of 6 agricultural firms listed on NSE for the period 2010 – 2014. A census was conducted as part of the research. The debt ratio, as measured by total debt to total assets, has a positive significant effect on financial performance, according to the results of the regression study. The study also discovered that combining debt and equity, as assessed by total debt to equity, had a negative substantial impact on financial performance. Financial leverage, as measured by fixed charged capital to equity, has a negative and minor effect on financial performance, according to the findings. [44] examined relationships between financial leverage and financial performance of firms listed in the agricultural sector of Nairobi securities exchange. This study examined financial leverage ratios affecting financial performance of 7 agricultural companies listed at Nairobi securities exchange covering the period 2011 – 2015 using descriptive and analytical research design. The target population constituted 7 agricultural companies listed at the NSE and the study conducted a census. The findings of the regression analysis found noted that the effect of leverage was negligible. The study proved the existence of a positive relationship between leverage and financial performance of agricultural companies listed on NSE. The study concluded that leverage has no effect on the financial performance of agricultural firms quoted on NSE. [45] examined the determinants of leverage of agricultural companies listed on Nairobi securities exchange including firm size and earnings. The study employed panel data for the period of 5 years from 2008 to 2012 and empirical results revealed that the standardized beta coefficient for firm size was greater than zero implying that firm size of agricultural companies listed on Nairobi securities exchange has a direct influence on leverage. [46] investigated the best capital structure for a company to improve its financial performance. The impact of debt ratio, asset turnover, size, age, and growth chances on the financial performance of 10 Nigerian listed non-financial enterprises from 2006 to 2010 was investigated. The study discovered that capital structure and financial performance had a significant negative association. Asset turnover was discovered to be a key driver of financial performance in the study. Furthermore, according to the research, asset tangibility has a detrimental impact on financial success as evaluated by ROA. According to the findings, firms did not use the fixed assets component of their total assets wisely enough to positively impact firm performance. [47] wanted to know if there was a link between financial leverage and the efficiency of non-financial enterprises listed on the Ghana and Nigeria stock exchanges. This study used a target population of 510 listed companies and a sample of 103 non-financial companies based on the availability of financial data to describe the relationship between financial leverage and working capital management efficiency of listed and non-financial firms in Ghana and Nigeria. The study revealed that financial leverage has a significant negative effect on working capital. Firms in Ghana and Nigeria were overleveraged thereby excess leverage reduces working capital management efficiency. Employing too much debt in the capital structure hinders efficient management of working capital. [48] investigated the association between capital structure and non-financial firm performance in Pakistan. This study used a target population of 411 non-financial firms listed on the Karachi stock exchange from 2003 to 2009 and a sample of 240 firms based on observations with a complete set of useful information to describe the relationship between capital structure and non-financial firms quoted on the Karachi stock exchange. Empirical results revealed that there is a negative relationship between measures of capital structure and return on assets, implying that agency issues may cause firms to use debt levels that are higher than appropriate in their capital structure. Over borrowing increases the lenders influence thereby limiting managers’ ability to effectively manage operations hence negatively impact on the firm’s performance.
2.2.4. Cash Reserves and Operational Efficiency
- [49] sought to assess the relationship between cash reserves and performance of commercial banks in Kenya using Pearson correlation matrix. The study sought to evaluate the effect of cash reserves on the performance of cash reserves in Kenya using a comparative analysis approach. The target population was two commercial banks operating in Kenya, the period considered was 2007 to 2010 and the study was a census. The study reported that cash reserves have a negative and insignificant effect on ROA and a positive significant effect on ROE for Equity Bank. For National Bank the study found a significant negative relationship between cash reserves and NIM, ROE and ROA. In conclusion an increase in cash reserves is not profitable for the banks because cash reserves do not generate income.[50] examined the effect of liquidity risk management on the performance of commercial banks in Kenya by evaluating cash reserves, customer deposits and non-performing loans and asset base. The study used a target population of 11 commercial banks quoted on Nairobi securities exchange and conducted a census. The empirical findings revealed that cash reserves, non-performing loans, customer deposits and asset base significantly affect the banks financial performance. In conclusion liquidity risk management factors as measured by cash reserves, non-performing loans, customer deposits and asset base have a significant effect on financial performance of commercial banks quoted on Nairobi securities exchange.[51] explored the connection between liquidity management and financial execution of commercial banks in Kenya. This review analyzed what liquidity management and capital ampleness meant for the financial performance of 43 commercial banks during the period 2010 – 2013 utilizing descriptive research plan. The review set up that the connection between liquidity management and benefit of business banks in Kenya is strong and critical. [52] studied the effect of holding excess cash on firm value. This study examined how investment, leverage, dividend pay-out and profitability affect firm value by employing unbalanced nonfinancial listed companies panel data for the period 1992 – 1999. Empirical results revealed that financial decisions affect firm value significantly. The study used three models for data analysis and in the second model, the study assessed the effect of cash accumulation on the major financial decisions of the firm by predicting levels of cash accumulation that is normal, low or high. Results for the second model found that investment decisions have a positive and significant effect on firm value. The study reported similar results for leverage and dividends. In general, findings revealed that the firm’s financial decisions namely investment, leverage and dividends and their respective market values depend on the amount of cash available. Using a sample of 2575 Chinese enterprises from 2003 to 2016, [53] investigated the moderating effect of firm specific characteristics on the link between cash holdings and firm performance. State ownership has a favorable moderating influence on the connection between cash holdings and firm performance, according to the empirical findings. For corporate governance mechanisms, similar findings were obtained.
2.2.5. Asset Tangibility and Operational Efficiency
- [53] sought to examine the determinants of productivity of firms recorded in the agricultural sector of Nairobi securities exchange. The objective populace comprised 7 rural firms cited at the Nairobi securities exchange, and an evaluation was directed for the period 2006 to 2014. Experimental outcomes uncovered a negative huge connection among substantial quality and benefit though firm size and liquidity have a critical positive relationship with productivity of horticultural firms recorded at Nairobi securities exchange. The review reasoned that tangibility influences profitability negatively. [54] studied the association between capital structure and the profitability of quoted companies trading on the capital market in Nigeria from 2006 to 2016. Empirical results revealed that asset tangibility has a negative significant effect of ROA as a measure of financial performance. The study concluded that firms in the sample data did not judiciously utilize the fixed assets component of their total assets to impact their firm’s performance positively. [55] examined the relationship between firm specific factors and the profitability of the insurance sector in Ethiopia. The study sought to evaluate the effect loss ratio, leverage, liquidity, growth company size and age of the company on return on assets of insurance companies. The target population was 14 registered insurance companies in Ethiopia and a purposive sampling was used to select a sample size of 9 insurance companies. Empirical results revealed that firm size, tangibility and leverage have a positive significant effect on performance. In conclusion firm size, tangibility, loss ratio and leverage affect the profitability of insurance firms. [56] used diagnostic tests and Stock and Watson's dynamic ordinary least squares methodology to investigate the impact of asset tangibility on the financial performance of Turkey's manufacturing industry (1993). Asset tangibility has a positive and considerable impact on financial performance, according to the study. Similar results were reported for operating efficiency, corporate liquidity and financial leverage. [57] studied the effect of leverage and debt maturity structure on the probability of a firm being financially distressed and analyzed the moderating role of asset tangibility on the association between capital structure and financial distress and, the association between debt maturity and financial distress. The target population was 207 non-financial firms listed in the agricultural sector of Pakistan stock exchange. Considering availability of data, the sample size was 187 firms. According to this study asset tangibility has an inverse moderating effect on the association between the probability of financial distress and debt maturity structure.
3. Research Methodology
- This study used a descriptive research design because of the need to tabulate data and use charts and graphs to describe how the data is distributed. The target population was all the thirteen (13) licensed microfinance banks in Kenya. This study used elimination criteria to pick 12 licensed microfinance banks as at year 2015 and which makes year 2016 the base year. That means that one microfinance institution (Maisha Microfinance Bank Limited) which was licensed on 21st May 2016 was not used for this study. Further, the year 2020 was excluded due to the Covid 19 situation, which may have affected the performance of these microfinance banks directly, and the effect of the study factors may therefore not be predicted with accuracy within this period. The study collected secondary data from the 12 licensed microfinance institutions for 4 years (2016-2019) which made the total number of observations to be forty-eight (48). This study used a data collection sheet to collect secondary data from the audited financial statements of the licensed microfinance banks. Data was collected for a period of 4 years (2016 -2019). The study used a balanced panel data set by ensuring that the time t, is uniform for all units of analysis. The quality and quantity of panel data is enhanced because it varies cross-sectional and over time [58].This study used STATA software version 12 to analyze data and present findings. A dynamic panel data regression model was used for data analysis and the study performed tests to select the appropriate model between random effects, fixed effects and pooled OLS model. This study employed a panel data regression model. A panel data set has observations that vary cross-sectional and over multiple time periods [59]. A panel data structure presents data with variations generated by both the units of analysis and the time series [62]. The study used a panel data regression model because it is possible to control for individual heterogeneity using panel data and exclude biases caused by the presence of individual effects [59]. This study focused on 12 firms and incorporating a time series of 4 years will generate 48 observations. The following models were evaluated for their suitability in this study. Another unique merit of dynamic panel-data model is that it gives the fundamental stage to represent past behaviour impact straightforwardly on current behaviour. GMM model was deemed suitable model for this study since it took care of endogeneity problems and unobserved heterogeneity. The dynamic panel regression model is given by:
 | (3.1) |
 | (3.2) |
 This study used scatter plots to test for linearity. Scatterplots with a linear pattern have points that seem to generally fall along a line while nonlinear patterns seem to follow along some curve. This study used the variance inflation factor (VIF) test to check for the multicollinearity and performed the multicollinearity test as follows: VIF < 5.0 No multicollinearity, VIF > 5.0 there is multicollinearity and VIF > 10 Indicate severe multicollinearity. The study used Pagan–Hall test as suggested by [60] to test for heteroscedasticity as the study used the random effect model based on Hausman Test results. Arellano Bond test was employed test to ascertain for auto correlation in the study. The null hypothesis is that there is no serial correlation in either first order autocorrelation or second order autocorrelation. Failure to reject the null hypothesis signifies absence of serial autocorrelation while the rejection of the null hypothesis signifies presence of the given order of serial correlation.
4. Findings and Discussion
4.1. Diagnostic Tests
- This section presents the outcomes of the following diagnostic tests: Linearity, Multicollinearity test, autocorrelation test, heteroscedasticity test, panel unit root, and model specification test which comprise fixed and random effect models.
4.1.1. Linearity Tests
- The study used scatter plots to test for linearity.
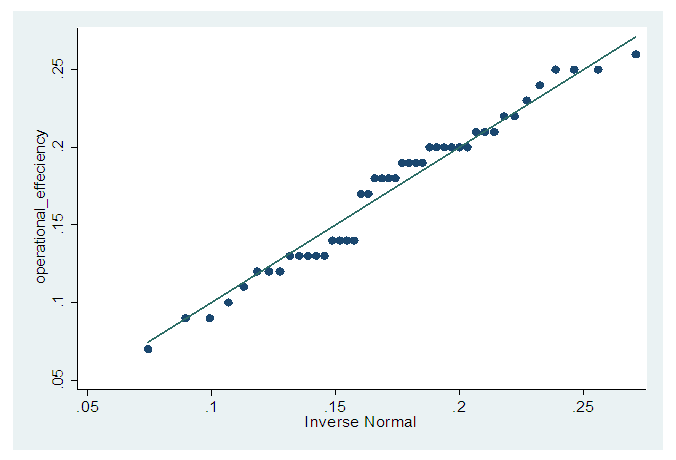 | Figure 4.1. Scatter Plots |
4.1.2. Multicollinearity Test
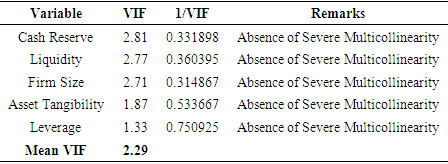
- Table 4.1 documents the VIF for Ln Cash Reserve (VIF=2.81), Liquidity (2.77), Firm Size (VIF=2.71), Asset Tangibility (1.87), Leverage (1.33) and mean VIF was 2.29. A VIF for all the independent less than 3 (VIF ≤ 3) indicates no multicollinearity while a VIF of ≥ 3 indicates collinearity and more than 10 indicated a problem with multi-collinearity. The outcome, thus inferred as non-presence of a multicollinearity issue among the variables and henceforth the degree of multicollinearity in the model, could be endured.
|
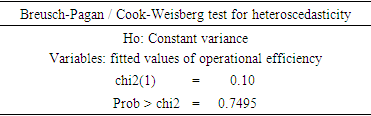
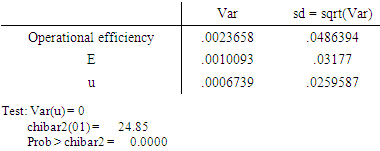
4.1.3. Heteroscedasticity Test
- The researcher used Breuch Pagan test to detect the problem of heteroscedasticity in the model.
|
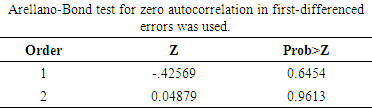
4.1.4. Autocorrelation Test
- The output in Table 4.3 presents no significant evidence of serial correlation in the first-differenced errors at order 1 and at order 2. Thus, the null hypothesis of no serial correlation is evident, and the study concluded that residuals were not serially correlated.
|
4.2. Model Specific Test
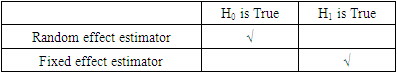
- [61] alludes that for a researcher to conclude whether to employ fixed effect model or random effect model on the panel data, model specification test is significant.
4.2.1. Pooled OLS Test
- The pooled OLS entailed linear regression without fixed and or random effects was used to test pooled OLS test. The test assumes a constant intercept and slopes regardless of group and time as shown in the table below:
|
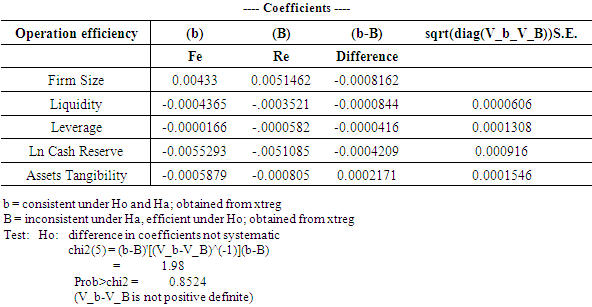
4.2.2. Hausman Test
|
|
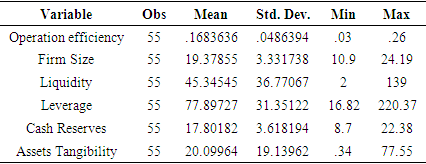
4.3. Descriptive Statistics
- Descriptive statistics is a summary statistic that summarizes features of information that is collected. It aims to summarize a sample [63]. The output is as shown below:
|
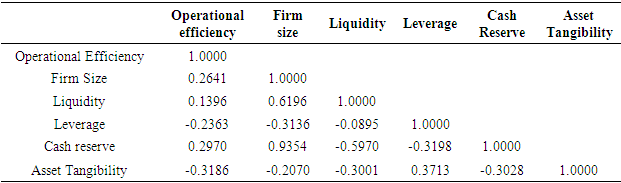
4.4. Correlation Analysis
- The study used Pearson correlation analysis to establish the relationship between fundamental firm characteristics and operational efficiency variables. The findings regarding this were summarized and presented as indicated:
|
4.5. Regression Analysis
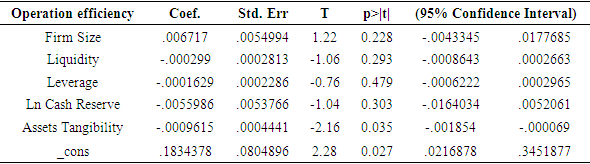
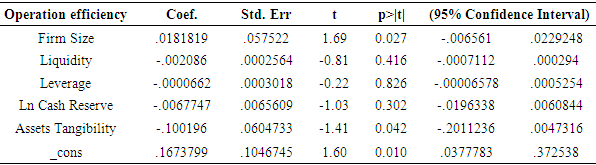
- The effect of independent variables and dependent variable was determined using dynamic panel regression analysis. To establish the statistical significance of the stated hypotheses, dynamic panel regression analysis was conducted at 95% confidence level (α=0.05). The results of the dynamic panel regression model were as shown below:
|
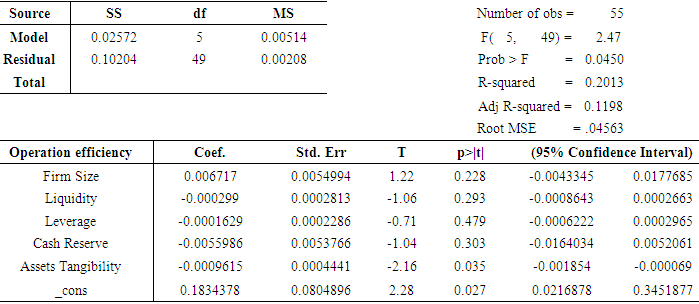
4.6. Fundamental Firm Characteristics and Operational Efficiency
- Table 4.10 presents the outcome of dynamic panel regression model on the direct effect of fundamental firm characteristics and operational efficiency. Fundamental Firm characteristics were the independent variables, with operational efficiency as the dependent variable.The outcome in Table 4.10 shows that Wald Chi square is highly significant (P=0.0345<0.05). This suggests that jointly Firm size, Leverage, Liquidity, cash reserves and asset tangibility determined Operational efficiency. From the findings, the operational efficiency had a significant p value of less than 0.05 (P=0.0345<0.05). The following null hypotheses were tested.
|
5. Summary of Findings and Recommendations
- This section presents the summary of findings as well as the recommendations to both policy and areas for further research:
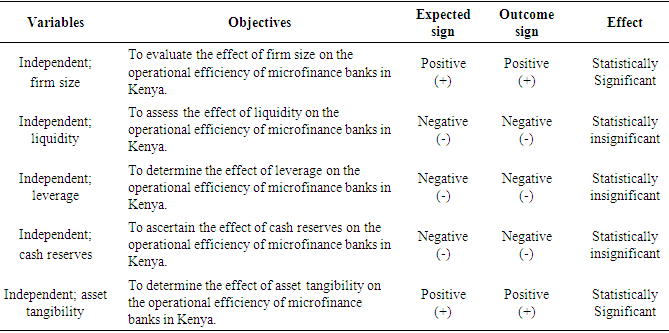
5.1. Summary of Findings
5.2. Recommendation
5.2.1. Policy Recommendations
- The study found out that asset tangibility had a statistically significant effect on operational efficiency of Microfinance banks in Kenya. From the findings on asset tangibility, the study recommends that microfinance banks should embrace asset tangibility on their strategic decision making and also that they can issue more debt as a strategy for more revenue generation. The study recommends that the Central Bank of Kenya to formulate and enact a policy which makes commercial debt cheaper hence reduce cost of operations of microfinance banks so as to reduce interest rates in order to attract investors who will inject more funds into these financial firms.The study also established that firm size affects operational efficiency of microfinance banks in Kenya. The study recommends that microfinance banks ought to increase their network of branches countrywide to attract new customers to open new accounts and in so doing increase their deposits. This will increase the pool of funds for investment and impact positively on their profitability. Also, the Central Bank of Kenya should formulate policies that encourage Microfinance banks to invest more in research and development and innovation so as to enable microfinance banks to design and develop competitive products or services that add value to the customers and which will foster their growth at large.
5.2.2. Recommendations for Further Study
- The study's findings have a distinctive impact on the literature and the way forward for operational efficiency in Kenyan microfinance banks. The study established that the current model accounts for only 20.13% and which means that the other 79.87% was unaccounted for by this study. The study recommends further research to determine the other factors which could account for the remaining 79.87% with regards to affecting the operational efficiency of microfinance banks in Kenya. The study further recommends for future researches to consider long periods and also to use time series data to validate the results realized in this study. The study also recommends further research on the other fundamental firm characteristics that this study did not research on as the current study only concentrated on five factors. It is also recommended that further research can be done on this vein but on different sectors of the economy such as non-banking sectors.