-
Paper Information
- Paper Submission
-
Journal Information
- About This Journal
- Editorial Board
- Current Issue
- Archive
- Author Guidelines
- Contact Us
International Journal of Finance and Accounting
p-ISSN: 2168-4812 e-ISSN: 2168-4820
2022; 11(1): 20-30
doi:10.5923/j.ijfa.20221101.03
Received: Feb. 14, 2022; Accepted: Mar. 14, 2022; Published: Apr. 29, 2022

Efficiency Model Approach to Implementation of the Public Sector Reforms: Evidence from Nigeria
 Abstract
 Reference
 Full-Text PDF
 Full-text HTML
Eunice Ngozi Okoroafor
Centre for International Development and Policy Studies, Abuja, Nigeria
Correspondence to: Eunice Ngozi Okoroafor, Centre for International Development and Policy Studies, Abuja, Nigeria.
| Email: |  |
Copyright © 2022 The Author(s). Published by Scientific & Academic Publishing.
This work is licensed under the Creative Commons Attribution International License (CC BY).
http://creativecommons.org/licenses/by/4.0/

This paper evaluates the implementation frameworks and processes in the Nigerian public sector reforms and finds that there is a lack of model for direction and a lot of gaps exists as a result. The study undertakes an evaluation of the public sector reforms in Nigeria to determine whether or not the expected results of efficiency and economic growth have been achieved. The study employed the descriptive and ex-post facto research designs. Samples were drawn from macro-economic indices published in the Statistical Bulletin of the Central Bank of Nigeria. The data were subjected to statistical analyses using simple percentages, graphs, correlation analyses, and regression analyses statistical models. Findings reveal that the present cash-based accounting and budgeting systems have not supported the achievement of economic and development targets as major objectives of the Public Sector Reform as embedded in the Fiscal Responsibility Act (FRA) 2007. A model developed by the researcher is proposed as a guide for economic and fiscal planning, and to reflect the relationships which have been established by the findings of this research.
Keywords: Efficiency Index, Implementation Frameworks, Public Sector Reforms, Fiscal Responsibility Act
Cite this paper: Eunice Ngozi Okoroafor, Efficiency Model Approach to Implementation of the Public Sector Reforms: Evidence from Nigeria, International Journal of Finance and Accounting , Vol. 11 No. 1, 2022, pp. 20-30. doi: 10.5923/j.ijfa.20221101.03.
Article Outline
1. Introduction
- Public sector reform is one of the elements of economic reforms (Wynne, 2007; Ouda, 2004). Public Sector Reform has in the past focused on structural reforms and capacity building. Increasingly now the focus is the need for governments to demonstrate quality improvements and value for money in public services. It entails role changes and impacts on public/private relationships, resource use and efficiency, and decentralized planning. It is actually an integrated package of reforms that may include financial reforms, public service reforms, and workplace relations (Ouda, 2004). The public sector reform in Nigeria was introduced in 2004 but the legal framework was signed into law as the Fiscal Responsibility Act (2007). Prior to the reforms, the Nigerian public sector underperformed and imposed a significant financial drain on the treasury (Okonjo-Iweala and Osafo-Kwaako, 2007; Soludo, 2007). State-owned enterprises were managed poorly and became liabilities to the state.The Public Sector Reforms is one of the four major components of the comprehensive economic reform program introduced shortly after the return of democracy in Nigeria. Under the public sector reform, there has been a restructuring of some government agencies and an increased focus on service delivery. Being so, public expenditure and matching results with expenditure form the focal point of the reforms in this area. The reforms in this area have given rise to a number of Bills and Acts such as the Fiscal Responsibility Act and the Public Procurement Act.The Public Sector Reform was embarked upon to improve efficiency, fiscal accountability and transparency in the public sector. These, in turn, should translate to improved economic and development indicators such as per capita, fiscal balance, rate of inflation, GDP, citizen welfare in terms of life expectancy, availability of adequate health and other social services, as well as good business climate needed to expand the economy.The poor performance of the Nigerian economy can be attributed to two major factors. One is the inefficient and ineffective use of resources and leakages. Two is the absence of adequate framework to properly direct planning and execution of programmes. This is despite the introduction of the public sector reforms and the fact that the reforms have a legal framework embodied in the FRA 2007 which provides for performance budgeting via the Medium-term Fiscal Strategy (MTFS), Medium-term Expenditure Framework (MTEF), and Medium-term Revenue Framework (MTRF). Moreover, the FRA 2007 has clauses that empower the Fiscal Responsibility Council, which has the responsibility to implement the provisions of the Act, to fashion out and adopt adequate and appropriate accounting systems to ensure the achievement of the reform objectives.An appropriate accounting system useful for performance measurement which is a major objective of the public sector reform should provide information that can be used to assess both the efficiency and effectiveness of decision-making. Efficiency is the analysis of input-output relationships while effectiveness measures the extent to which policy objectives are attained. According to Folscher (2007), different countries have applied different mechanisms within MTEFs to improve the quality of information used to make resource allocations. He maintains that successful MTEFs denote more than just a set of multi-year spending plans. They should be the outcome of an approach to budgeting that requires early policy prioritization, a better evaluation of competing policies and programs, and a deliberate matching of current and medium-term plans with available resources through a disciplined process. MTEFs have been proposed as an essential element of modern budgeting practice.Lüder (1992) developed and published the Contingency Model of Government Accounting Innovations in an attempt to explain the transition from traditional government accounting to a more informative system. According to him, a more informative system performs two functions: i. It supplies comprehensive and reliable information on public finance, and ii. it provides a basis for improved financial control of government activities. However, Chan (2003) pointed out that the Contingency Model (Lüder, 1992) was not explicit about what constitutes a more informative system. But according to Ouda (2003), it may be inferred that such a system would call for full disclosure of a government’s financial condition and performance, measured under the accrual basis of accounting.In his own work, Ouda (2004) proposed a model that specifies the basic requirements that should be available if a certain country confirmed its intention to implement accrual accounting in the public sector. In other words, it brings the government’s attention, from the outset, to the changes and factors that should be made simultaneously and coordinated if it wants to implement the accrual accounting in the public sector in an efficient, effective and economic way, to attain the target benefits from that implementation and to avoid the problems which can emerge if these factors or one of them have not been taken into consideration. He refers to these factors as the driving forces of government accounting changes and can be one or more of the following stimuli: Financial Problems; Financial Scandal; Corruption and Fraud; Globalization; Economic Crisis; and Change Agent.In further developing the basic requirement model for the implementation of accounting reforms in the public sector, Ouda (2003) dwelt on the implementation framework. However, factors used in the model are hardly measurable and therefore would be difficult to replicate. Luder, on the other hand, attempted to explain the reasons for the transition from one accounting system to another, although Guthrie (1998) has argued that the work was not explicit as to what a more informative system would be. However, Ouda’s model (Ouda, 2003), though useful in evaluating performance, cannot be used for comparative analyses, monitoring, and predictive purposes. This is so because it does not take into consideration other factors such as inflation, population growth rate, and other variables that impact the value of economic indicators. This evidently creates significant knowledge gap. There is no evidence that another model to smoothen such distortions and shortcomings that are inherent in the above model has been developed. This paper seeks to fill this gap.The rest of the paper is organized as follows. The need for improved fiscal outcomes, efficiency, and effectiveness in the use of public resources is a given but how to achieve these outcomes remain a bit contentious. Some background to the study and the objectives of public sector reforms generally, and in Nigeria specifically, is briefly reviewed in Section 2. The research method applied and the sources of data for the study are described in Section 3. The data for this study and the analyses of the data using appropriate tools of analysis are presented in Section 4. A discussion of the results of the study is presented. An earlier work by another respected author in the area of public sector reforms in 2004 developed a model to measure the efficiency level of government operations based on the matching principle of accrual accounting. This study developed and proposes another model based on the same principles to smoothen the distortions and shortcomings of the older model. The proposed model is presented in Section 5. Concluding remarks follow.
2. Reform Objectives
- The major objective of the reform process in the Nigerian public sector is to increase the efficiency and effectiveness of public spending. To this end, a number of implementation frameworks were introduced and adopted. Some of the measures include the introduction of the FRA 2007 and the adoption of IPSAS in principle. However, much as a number of measures and frameworks have been adopted, the problem of lack of efficiency and effectiveness of public spending persists. As a result, the economy has continued to record poor performances in virtually all its sectors. The continued poor performance of the economy is reflected in poor socio-economic indices. The standard of living has remained low despite government’s seeming best efforts. Leakages have not abated. Managers of public resources still operate under the public administration system and therefore, it is difficult to hold any particular person accountable for non-performance. Poverty rate has increased despite poverty alleviation interventions by the government. From 2006 to 2010, the incidence of poverty was at 54. In the same period, the unemployment rate was on a steady rise from 12.3% in 2006 to 12.7% in 2007, then 14.9% in 2008, 19.7% in 2008, and 21.1% in 2010 (CBN Annual Reports, 2010). The incidence of poverty increased to 71.5 in 2011 and 72 in 2012 (CBN Annual Reports, 2015). Inflation rate rose from 8.5% in 2013 to 16.5% in 2017 (CBN Annual Reports, 2018) after a decrease from 10.8% in 2011 and 12.2% in 2012 (CBN Annual Reports, 2015). Other macroeconomic and social indicators, such as life expectancy and literacy rates have not fared any better.Much has been done by different scholars in a bid to ascertain the objectives of reforms in the public sector. All are agreed that the major objective envisaged to be achieved when embarking on public sector reform is to improve efficiency and effectiveness. According to Ouda (2004) and Wynne (2007), public sector reforms are carried out to address economic crises. New Zealand embarked on reforms to tackle the economic crises it faced (Wynne, 2007). Ouda (2004) points out that Australia’s poor economic performance of the 1970s led to a reassessment of the role of the Australian public sector and its management which, according to Mascarenhas (1990), was suffering from the lack of a system of performance measurement, the absence of incentives to encourage greater efficiency and the lack of competition as a pressure for improved performance. Some scholars like O’Flynn (2015) have also wondered why there are so many public sector reform programs initiated by governments from which very few clearly apparent and measurable benefits result. This situation has been referred to as the conundrum of public sector reforms (Shannon, 2016). Both O’Flynn (2015) and Shannon (2016) are not necessarily opposed to public sector reforms. Rather, a close look at the study carried out by O’Flynn suggests that there are many angles, which have not been explored but which have the potential to make a big difference, from which public sector reforms ought to be tackled and implemented if success is to be achieved.Nigeria has undertaken a number of economic reforms before the present one. None of the previous ones was successful as they did not achieve the objectives for which they were carried out. The failures have always been attributed to a lack of proper implementation framework and process. A number of reasons can be adduced for the failures to achieve previous reform objectives and border mostly on the shortcomings of cash accounting in the public sector. One major reason for the non-realization of set targets is that cash-based accounting and budgeting systems are only concerned with actual cash flows and ensuring that funds are released as approved. This is good. However, this system does not concern itself with whether or not the objective for which the money is released is achieved. Moreover, the public administration concept under which it operates does not really hold anybody responsible for achieving any particular objective. Neither does it provide any framework that can compel resource managers to take responsibility for the proper use of resources entrusted to them. On the other hand, accrual-based fiscal indicators arguably provide a better measure of the effects of government policies on aggregate demand (Athukorala and Reid, 2003).Another reason that can be adduced for the above result is the treatment of capital expenditures under cash-based regime. There is no distinction between capital and current expenditures under a cash-based regime. Capital expenditures are not spread out over the life of the project for which it was spent. For this reason, Boothe (2007) argues, there is an inherent bias against the accumulation of public sector capital in a cash accounting regime. He explains that the interaction of the different accounting regimes with the fiscal rules produces different incentives and government behavior because the variable on which one of the fiscal rules is based, the deficit, is measured differently under different accounting regimes. The essence of the public sector reforms is to enhance fiscal transparency, improve efficiency and ensure accountability in the public sector. The Fiscal Responsibility Act (2007) is one of the frameworks provided for the implementation and achievement of the public sector reforms objectives undertaken by the government. It seeks to provide the framework that will ensure prudent management of public resources in order to increase citizen welfare and rapid economic growth by matching inputs with outputs and outcomes. However, as pointed out in the same section, the successful implementation of the FRA (2007) depends heavily on the existence of enabling structures and environment to translate the provisions into workable solutions and to monitor its performance.The Public Sector Reform was embarked upon to improve efficiency, fiscal accountability and transparency in the public sector. These, in turn, should translate to improved economic and development indicators such as per capita, fiscal balance, rate of inflation, GDP, citizen welfare in terms of life expectancy, availability of adequate health and other social services, as well as good business climate needed to expand the economy.
3. Methods and Procedure
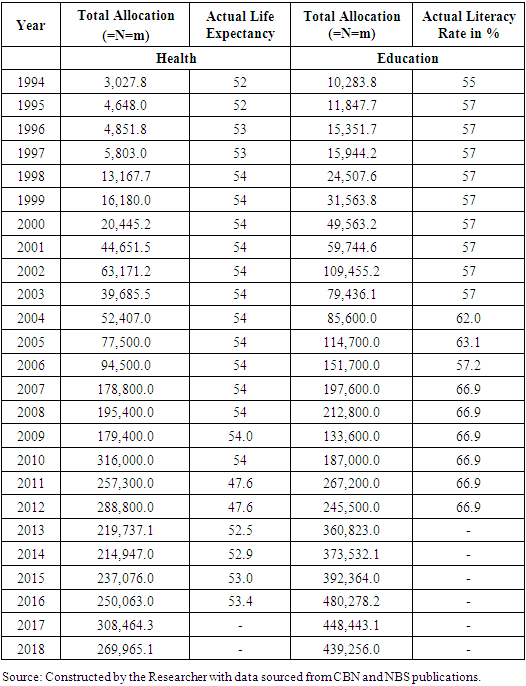
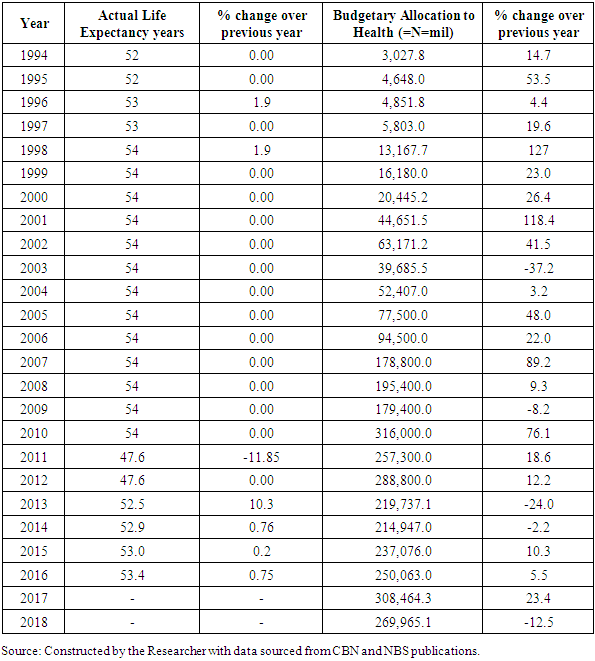
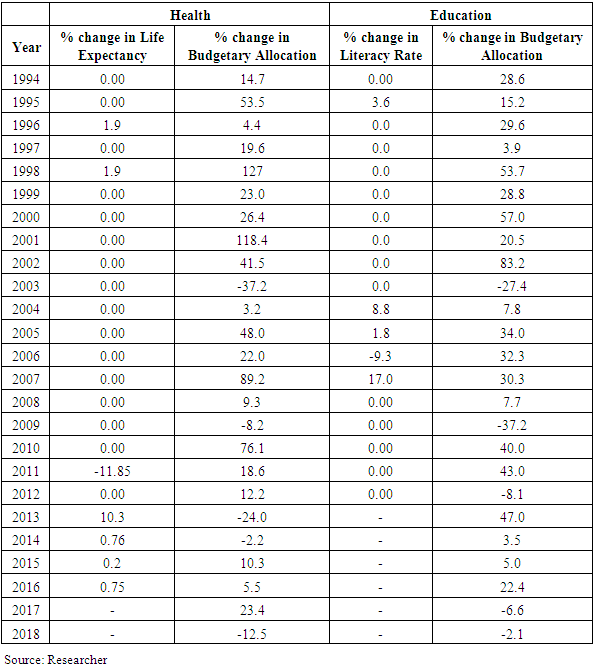
- This study employs the descriptive and ex-post facto research designs. The descriptive design is employed to determine the extent of the association between the variables and to draw inferences. The ex-post facto research design is also adopted in addition to the above in order to make meaningful comparison between the pre and post FRA 2007 periods. This is especially necessary as the study seeks to determine whether or not there are changes in economic indices in both periods as an indication to the effectiveness of the Act. The data have been subjected to statistical analyses using tables and charts.To achieve the objectives of this study, the frameworks and objectives of the public sector reforms and the fiscal strategy designed to achieve them are examined. In particular, the Fiscal Responsibility Act 2007, being a major framework for carrying out the public sector reforms in Nigeria is examined. Two socio-economic indicators of the economy, namely: literacy rate and life expectancy rate are analyzed over a twenty-year period covering both pre- and post-reform periods.Given that this study is a descriptive research which is also employing explanatory methods in seeking to determine the extent of the association between the variables, simple frequency tabulations and percentages, and the application of Correlation Analyses and Simple Regression statistical analyses tools such as correlation coefficients, and sample t-test statistical formulae are used.The data used for this study are drawn from the sources listed below and have been used for constructing tables for data presentation and analyses in the subsequent sections:i. Central Bank of Nigeria Annual Report and Statement of Accounts (covering financial years 1990-2019);ii. The Nigerian Statistical Fact Sheets on Economic and Social Development (2009);iii. Central Bank of Nigeria Statistical Bulletin;iv. National Bureau of Statistics Year Books, National Accounts, among others.Following is a table of the relevant population of macro-economic indices to be used in this study as constructed by the researcher using data extracted from the afore-mentioned sources.
|
4. Data Presentation and Analyses
- The tables and graphs presented in this section are constructed by the researcher using the data extracted from table 1 presented in section 3 above.
4.1. Analyses of Actual against Expected Selected Socio-Economic Indicators for selected years
|
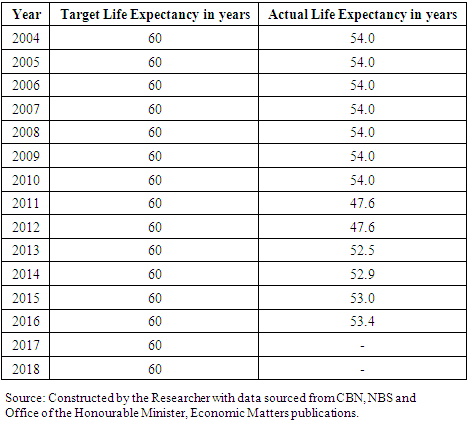
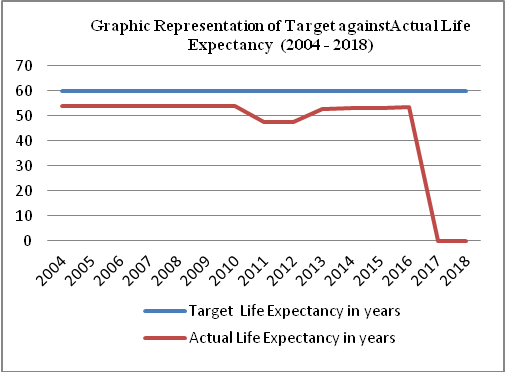 | Figure 1. Graphic representation of Target Life Expectancy (in years) against Actual for the period 1994 to 2018 (Source: Researcher) |
|
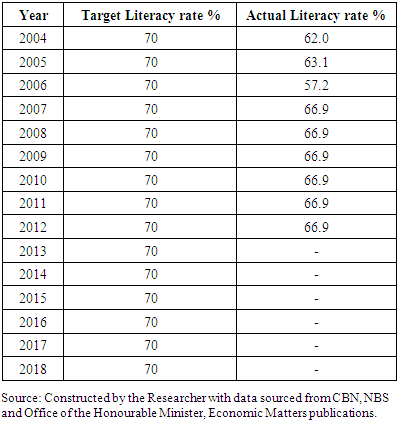
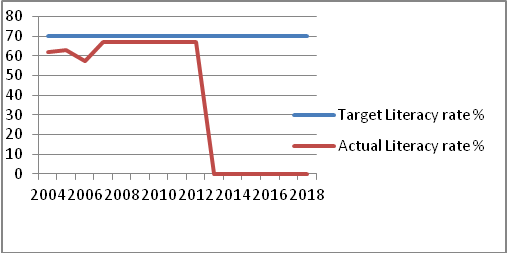 | Figure 2. Actual against Target Literacy rate for years 2004 to 2018 (Source: Researcher) |
4.2. Analyses of Performance of Budgetary Allocations and Socio-Economic Indicators
|
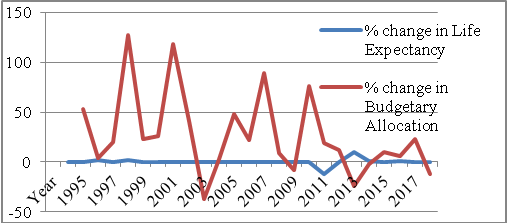 | Figure 3. Graphic analyses of percentage changes in life expectancy and budgetary allocations from 1994-2018 (Source: Researcher) |
|
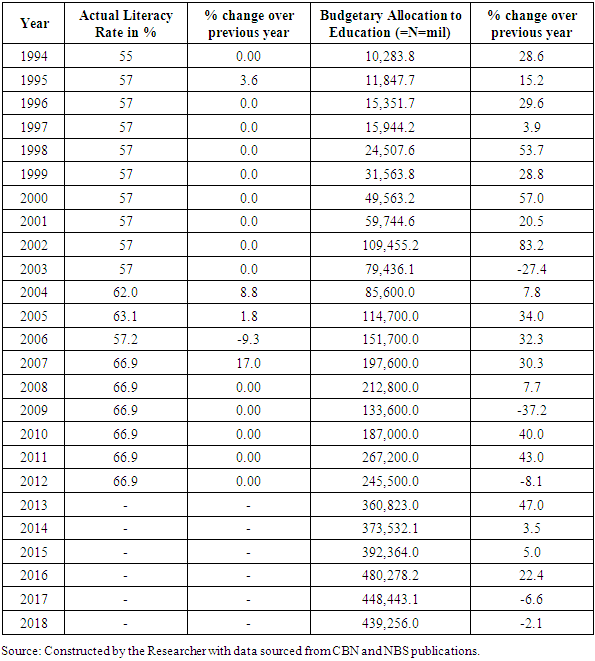
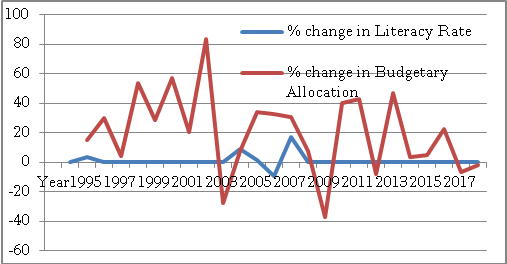 | Figure 4. Graphic analyses of percentage changes in literacy rates and budgetary allocations to Education from 1994-2018 (Source: Researcher) |
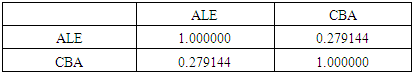
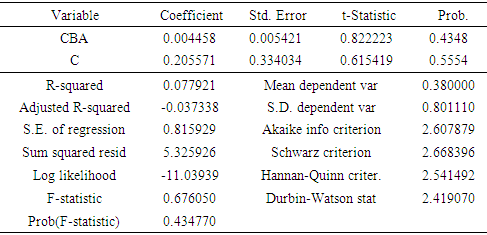
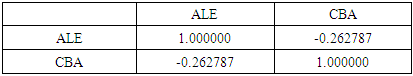
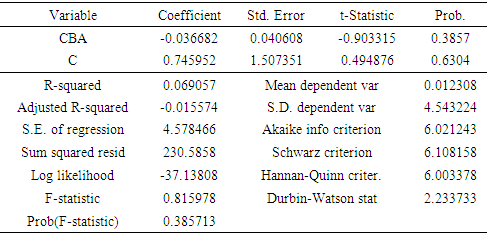
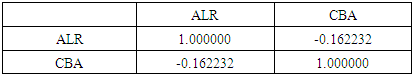
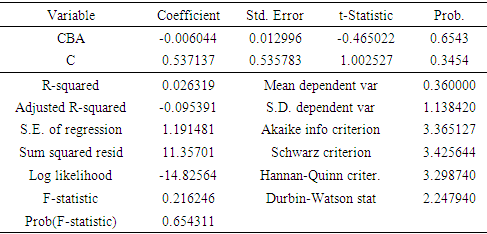
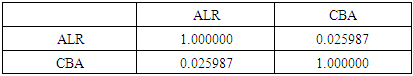
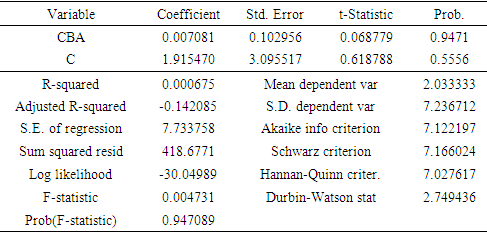
4.3. Statistical Analyses of Budgetary Performance and Socio-Economic Indicators
|
|
|
|
|
|
|
|
|
5. Discussion of Results/Proposed Efficiency Model to Implement PSR
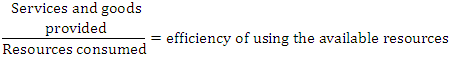
- The results of the analyses show that the relationship between the increases in budgetary allocations and the outputs as expressed by the social indicators is highly insignificant. In other words, the increases in budgetary allocations have not been efficiently applied and so have not resulted in improved socio-economic indices. Also, the fact that the allocations increase almost every year even though the previous allocations did not make any impact is a pointer to the fact that there does not exist any suitable framework to measure or ensure accountability and efficiency. The insignificant relationship between the socio-economic indicators and the budgetary allocations in the pre-PSR period shows that there is no improvement in the indices despite the increases in allocations. The public resources are not effectively and efficiently managed. This can be attributed to the fact that proper frameworks to encourage and ensure efficiency, effectiveness, and accountability are lacking. Besides the above, it can be seen that for some of the tests, the value of the gradient is negative. This shows the existence of negative relationship between the dependent and independent variables. The implication, therefore, is that there is negative correlation between accountability and efficiency. For example, the post-PSR period even shows negative relationship, meaning that the more resources are allocated, the less the outcomes in terms of socio-economic well-being achieved.In an earlier work, Ouda (2003) developed a model to measure the efficiency level of government operations based on the matching principle of accrual accounting as follows:
 However, the model, though useful in evaluating performance, cannot be used for comparative analyses, monitoring and predictive purposes. This is so because it does not take into consideration other factors such as inflation, population growth rate, and other variables that impact on the value of economic indicators. This evidently creates significant knowledge gap. There is no evidence that another model to smoothen such distortions and shortcomings that are inherent in the above model has been developed. To fill this gap, the model in this paper, and presented below, has been developed by the researcher to reflect the relationship which has been established by the findings of this research.
 | (1) |
 is derived by
  and
and  is derived by
  And where
  = percentage change in expenditure
 = percentage change in economic indicator
 = economic indicator for base year
 = economic indicator for year n
 = expenditure for base year
 = expenditure for year n
 = transparency/efficiency indexDeriving from the above, using a perfectly suitable accounting system, and other factors held constant, there should be no leakages and no corruption. Therefore, any change in expenditure will bring about at least equal change in economic indicator for the same period. This relationship can be reduced to the following model formulated by the researcher as:
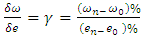 Therefore,
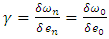 | (2) |
6. Conclusions
- Most of the literature on the Public Sector Reform in Nigeria and the Fiscal Responsibility Act (2007) dwell on the outcome (see Banjo, 2017) of the reform programme and attribute the failure to lack of political will. The successful implementation of the PSR in Nigeria is not necessarily a political matter. It has gone beyond political will by the very enactment of the FRA (2007) which presents opportunity for deployment of technical will. An indepth study of the reform frameworks and the determination of implementation strategies that best suit the frameworks are lacking.This is a major and significant knowledge gap that this work has filled. This study set out to examine whether the PSR in Nigeria can be successfully implemented without reforms in the public sector accounting and budgeting systems. In particular, the FRA, being a major framework of the PSR, was examined to determine the best ways to implement its provisions. To the best of my knowledge, no study has been done on fiscal responsibility and accounting system, and how proper coordination between fiscal responsibility and accounting and budgeting could achieve the economic objective of fiscal transparency, accountability, efficiency and economic growth in the Nigerian setting. The FRA (2007) needs an accounting and budgeting system that can assign responsibility and provides the incentives for resource managers to be both accountable and efficient in their use of resources. Many authors and commentators focus on the legal aspect of the FRA such as whether or not the government is adhering to the fiscal deficit rule. None has examined the provisions and the fiscal strategies as contained in the FRA and relating these to the frameworks for implementing and monitoring them. The successful implementation of the PSR generally and FRA in particular, is not necessarily a legal issue. It is a question of adjusting the structures upon which the implementation and monitoring rest, namely, the public sector accounting and budgeting systems and processes.The practical and theoretical implications of the model developed in this work is that a desired economic index can be used to derive and prepare budget estimates much the same way that economic variables can be used to predict economic indicators. For example, just as expenditure and population figures can be used to predict per capita GDP, the desired economic index and transparency index can be used as guide to prepare budget estimates targeting particular set objectives. The model also recognizes the constraints within which budgets are prepared. The models developed in this work are particularly relevant in achieving Section 12 (1) of the FRA which stipulates that the budget deficit should not exceed three percent (3%) of estimated national GDP for any particular year; and 19(e) of the FRA which stipulates that the Annual Budget shall be accompanied by a ‘Fiscal Target Appendix derived from the underlying MTEF setting out target inflation rate, target fiscal account balances, and any other developmental target deemed appropriate’.