Dhanya Jagadeesh
Economics Lecturer at BA Isago University, Gaborone, Botswana
Correspondence to: Dhanya Jagadeesh , Economics Lecturer at BA Isago University, Gaborone, Botswana.
| Email: |  |
Copyright © 2022 The Author(s). Published by Scientific & Academic Publishing.
This work is licensed under the Creative Commons Attribution International License (CC BY).
http://creativecommons.org/licenses/by/4.0/

Abstract
The purpose of this study is to analyse the impact of stock price volatility in Indian manufacturing sector using Vector Error Correction Model. The result of the trace and maximum eigen value statistics indicate the presence of one cointegrating vector among the variables at 5% significance level and the normalized coefficients of cointegrating vector are statistically significant and positive, indicating that all variables respond to the disequilibrium. The positive coefficient indicates the negative relationship between the Index of industrial production (IIP) and the stock market volatility. The research recommended that the government, the monetary authority and the research institutions should take the initiative to adjust its policies to stabilize stock market prices.
Keywords:
Volatility, Stock market, Manufacturing sector, Economic growth, VCEM
Cite this paper: Dhanya Jagadeesh , Stock Market Volatility and Its Impact on the Manufacturing Sector in the Indian Economy, International Journal of Finance and Accounting , Vol. 11 No. 1, 2022, pp. 1-8. doi: 10.5923/j.ijfa.20221101.01.
1. Introduction
A sound stock market is an indicator of any nation’s financial power and strength. It has an inevitable role in the growth of manufacturing sector of a country as it is an invaluable source of capital for business. The stock markets create opportunities for the manufacturing sector to flourish in the economy, and at the same time it gives a platform for individuals/ households to save and invest their small savings.The major impediments to the growth of a manufacturing unit or business is lack of capital (Luther Blissett, 2019). Businesses both in the developed and developing nations can raise enough funds from the public through a well-developed stock market, rather than going for huge loans from banks and other financial institutions, which then must be repaid with a huge amount of interest in the future, thereby they can easily expand their businesses at an affordable cost that create more production. From a national perspective, this will earn foreign exchange, lower unemployment levels, alleviate poverty, and generate more government revenue which then can be used for further developmental activities. Most of the firms in the most successful countries like the United States, United Kingdom, and other emerging countries generated the finances for their businesses from the stock market, rather going to banks. By holding these arguments, let’s say, a country which holds a sound stock market system will be become a powerful nation.One of the most important key elements to consider when evaluating the soundness of the stock market is price stability, the price stability is closely related to the term volatility. It is a statistical measurement, quantifying the uncertainty and risk associated with stock market assets. However, the thumb rule is the higher the risk, higher the return, most of the investors while making their investment prefer the asset with less risk, in fact, investing in stocks are riskier than any other investment as the stock market is always volatile. If a stock has frequent and drastic price changes, volatility will be high, when asset prices are consistent and hardly changes, then volatility will be considered as lower and the market is stable.Though a certain level of volatility is unavoidable, a frequent and drastic up and down swings will affect the confidence of the investors in the market, that will interrupt the smooth functioning of the stock market and finally this will lead to a negative impact on the country’s manufacturing sector. Indian stock markets are subject to greater volatility compared with the stock markets in many other countries such as China, Brazil and Russia. And it is almost five times the average volatility of developed markets.India VIX index foresees investors’ perceptions of volatility ahead, high India VIX values indicate the uncertainty in the markets, and a lower India VIX means that there is lower uncertainty and high market confidence. India VIX is negatively correlated with Nifty, when India VIX falls. India VIX, has escalated 54% in the year thus far. The index stood at 26.31 on April 23, 2019, the highest in the last five years. The VIX is coming up in an unabated manner, which fell 5.98% in March, has climbed 43.4% in April (Economic times, 2019).
1.1. Statement of the Problem
India, maintains a reasonably very high savings rate, which is one of the highest in the world at 30%, (Joseph Massey, 2011) Unfortunately, an enormous portion of these savings used to invest in unproductive assets like gold, low-yielding fixed bank deposits or real estate, statistics reports that the average Indian household holds 77% of total assets in real estate, 11% in gold while 5% in bank deposits (S. anagol, Balasubramaniam and Ramadorai, 2016) and only a very low percentage of the savings are invested in the stock markets. The Reserve Bank of India’s Handbook of Statistics (September 2018) reports that barely 0.2% of the Gross National Disposable Income of the household sector constituted towards the shares and debentures during the period from 2011 to 2014. This yardstick is increased to 0.3% in fiscal years 2015 to 2016, then again increased to 0.9% in 2017 to 2018 fiscal years; however, it is far below than it was expected and far lower than the contribution towards other physical assets like, real estate, gold and bank deposits. Together with all these India's industrial production growth, as measured by the Index of Industrial Production (IIP), slowed down to a seven-month low of 3.2% year-on-year (YoY) in May'17, from a growth of 4.9% YoY in the previous month. The slowdown was led by a weak growth in manufacturing at 2.8% YoY. Industrial Production in India decreased 0.30 percent in February of 2019 and it has averaged 6.04 percent between 2006 to 2019, (current affairs, 2019). Based on the statistics, we are leaving the guess that weak growth in the manufacturing sector might be correlated with a lower household sector and retail investor participation rate in the stock market, it’s mainly because of the investing in the stock market is perceived to be gambling due to its volatile nature. Normally, Indian investors have always been risk averse, therefore, prefer investing in less risky assets, like real estate, Gold, Bank deposit etc. Briefly a volatile stock market leads to lower household participation in the stock market, which makes serious impact on businesses, which then have repercussions in the manufacturing sector and overall economic growth and development.
1.2. Relevance
The relevance of this research stems from the following reasons: First of all, a strong and a sound stock market is essential for any nation’s development and growth. It plays an important role in gathering small savings and encouraging the domestic investments, though most of the savings channelized to other low income yielding saving schemes as it is highly volatile. So this study was organised to investigate the influences of stock price volatility on the growth of the Industrial Production in India, then finally come up with a solid policy framework is thus becoming very crucial for attaining the confidence in the Indian stock market thereby promoting the manufacturing sectors.Further, Many investors such as individual investors, portfolio managers, institutional investors including foreign investors would find this study as assistance before make investments. Also the volatile stock market is a serious concern for researchers, academicians and policy makers all the time, there for the study might be a reference for many of them.
1.3. Objectives
This paper examines how stock market volatility affects the manufacturing sector in India.1. To analyse the relationship between the manufacturing growth and Stock price volatility. 2. To come up with appropriate policies that would lead to better performance in the stock market.
1.4. Limitation of the Study
The following are the limitations of the proposed research: The study covers the aggregates of the manufacturing sector in India, rather considering the impact of stock price volatility in each firms. Further the study analysed the impact of stock market volatility in the manufacturing sector but the study leaving the determinants of volatility unattended and the data has been used covering only from 1995 as the unavailability of the data for some of the variables.
2. Literature Review
There are various other subjects involving the interaction of volatility, economic development and macroeconomic variables, though all these studies provide different conclusions related to their test and results, but there are also few studies made on the relationship between stock volatility with the manufacturing sector and Balance of Payments to gather.The issues of changes in volatility of stock returns in the emerging markets have picked up considerable attention in later years. The ground for this tremendous interest is that volatility is used as a criterion of risk. The securities industry participants also need this measure for several causes. It is required as an input in portfolio management. It is indispensable in the pricing of options.N.S. Mian, et al (2010) The study attempt to investigate the relationship between stock market movement and economic growth using ADF in Pakistan by taking size and fluidity of the livestock market. Rakesh & Muhammad (2011) The study examined the investor behaviour in connection with economic growth. Further the study applied GARCH model to examine the aspect of volatility with regards to expected and unexpected movements in stock returns. The findings reported that the investors are not sensitive for short periods by largely sensitive with a longer investment horizon.Zukarnain (2012) The studied the relationship between volatility in stock market return in Malaysia with five selected macroeconomic variables using VAR and granger causality test, the study confirmed volatility of all macro-economic variables being studied does not granger cause the volatility of stock market returns.Babatunde (2013) The study reveals that stock volatility is quite usual in Nigeria it affect the growth of the economy, therefor the study recommends strengthening the stock market by recruiting quality professionals with a special focus on in depth research. Dr. Srivastava (2014) This paper attempt to analyze the volatility and the behaviour of the Indian stock market and volatility during the post-recession period using descriptive statistics and Parkinson’s model, confirmed a highest volatility during 2008 and 2009, further the study confirmed the relationship of the volatility with the economic recession.Nishad et. al (2015) This paper focused stock return volatility of 5 major sectors which are, bank, energy auto, metal and finance using ARCH and EGARCH model. The result indicated that there are significant and negative leverage impact in these five sectors and also confirmed that the stock volatility is highly sensitive to market activities.Omoregie, Ekpoma Eromosele, (2016) The study examined the relationship between the stock market volatility and other independent variables like inflation and interest rate in Nigeria, using error correction model and the study confirmed all the variables have positive relationship with the dependent variable. Another study, Dany et. al (2017) used GARCH model to coduct similar study based on 3 countries Nigeria, the Ivory coast, and Cameroon and revealed that the stock market is insignificant to the economic growth of cameroon while the stock market significantly contributes to the economic growth in the other two countries.Luther Blissett (2019) A 2012 National Small Business Association survey revealed that one of the major hindrances to business growth was a lack of affordable capital. Companies listed on a stock exchange can quickly raise affordable capital by issuing more shares for investors to buy. The capital raised from the issuing of shares can be used to assist the company to develop and compensate for other costs.
3. Methodology
3.1. Data
The present study proposes to assess the impact of stock market volatility on manufacture sector growth in the Indian context by estimating a VECM model. Time series data will be collected from various publications by the Reserve bank of India, BSE, NSE, India fix, Yahoo finance, Boomerang, Global Financial Development, the Federal Reserve Bank of St. Louis and other related articles etc. The time series data that will span across a period of 22 years from 1996 to 2017 to portray a larger view of the relationship and it would give adequate degrees of freedom.
3.2. Variables
Variables namely: the Index of Industrial production (IIP) is dependent variable and the proxy that captures the changes in industrial activity in India, Stock price volatility, Real Exchange rate(REER) and Real interest rate (RIR) has been considered as independent variables.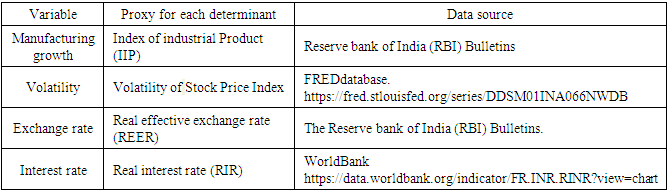
3.3. Model Specification
IIP = β0 + β1 volatility + β2 REER + β3 RIR + μ IIP = Index of Industrial production,Volatility = Stock price volatility,REER = Real exchange rate,RIR = Real interest rate.μ refers to the error or stochastic term; And β1, β2 & β3 refers to the coefficients. Expectation: The stock market price volatility, real exchange rate and real interest rate is expected to have a negative effect on Industrial production. Thus, β1, β2 and β3 < 0.
3.4. Unit Root Test
Testing Unit root is a pre requirement to run the vector autoregression (VAR) and Vector Error Correction model (VECM), to establish the long-run and the short-run dynamics among the variables. Therefore, the study will start analysing the data with the help of a unit root test to confirm the series of data does not have any unit root property. In econometrics generally, the augmented Dickey-Fuller (ADF) tests will be applied to determine the unit root. The general form of ADF test is estimated by the following regression equation: | (1) |
Where α is a constant, β the coefficient on a time trend and p is the order of lags of the autoregression process. The Augmented Dickey-Fuller test has three versions they are as follows.a. Test for unitroot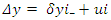 | (2) |
b. Test for unit root with drift 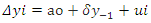 c. Test for unit root with drift and deterministic time trend:
3.5. Johansen’s Cointegration Test
The cointegration among the concerned variables is being checked if all the variables are integrated in the same order. The existence of Cointegration among variables indicates long run relationship among concerned variables. The cointegrating regression equations are calculated using VAR based Johansen’s cointegration approach to check the long-run equilibrium relationship among the variables. The VAR-based johansen’s cointegration test of order P is described below: If the economic variables are integrated of order one we can proceed to use the Vector Auto-regression (VAR) representation. Therefore this VAR can be rewritten as follows:
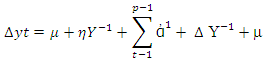
3.6. Vector Error Correction Model
There often exists a long-run equilibrium among the variables but sometimes there may be disequilibrium in the short run. If the variables are found to be cointegrated during the johansen cointegration test then we proceed to VECM to check the existence of any disequilibrium in the short run and the rate of correction back to the long-term equilibrium relationship among them. VECM: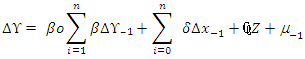 Cointegrating Equation –Long run Model
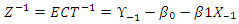
3.7. Diagnostic Tests
Conducting various diagnostic tests is an important step in data analysis which is to make sure the model reasonably captures the data generating process, also to examine the correlation structure of a time series data. Here we adopt serial correlation and Cusum test to check the stability and the serial correlation among the variables.
4. Empirical Results and Discussions
4.1. Unit Root Testing
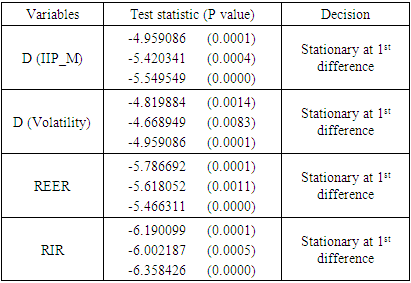
Table 1 represents the result for the unit root test which indicate that the ADF test statistic for all the variables are greater than the critical values at 1%, at constant, without trend and at the constant with linear trend. The null hypothesis for the variables at their first difference could not be rejected. Hence, all the variables are stationary at their first difference at the 1% level of significance. Also the ‘Coefficient’ of all the variables are negative. Meaning that the model accepts all the guidelines to reject the null of unit root, therefore it can be concluded that the model is viable.Table 1. Augmented Dickey-Fuller Unit root test
 |
| |
|
4.2. Johansen Co-Integration Test
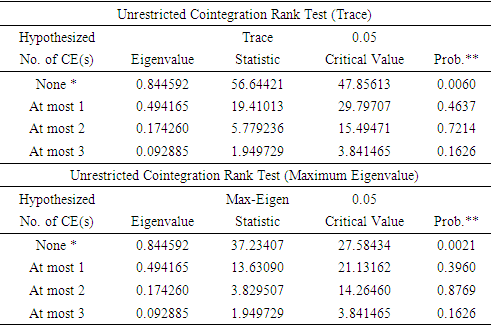
The unit root test result confirms the stationarity of the variables at first difference. That was precondition to run the cointegration test by applying the Johansen co-integration technique to check the longrun cointegration between variables. The result in Table 2 reports the presence of one cointegrating vector among the variables at 5% significance level. This entails that there is a long run equilibrium relationship between the index of industrial production and stock market volatility in India. Table 2. Johansen Co-Integration Test
 |
| |
|
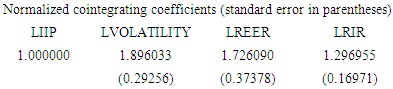
Table 3 indicate the normalized coefficients of cointegrating vector and of the coefficients of adjustment. Here all the error correction coefficients are statistically significant and positive, indicating that all the variables respond to the disequilibrium. The positive coefficient indicates the negative relationship with the dependent variable which confirms the negative relationship between Index of industrial production (IIP) and the stock market volatility. Thus, none of the variables can be regarded as weakly exogenous.Table 3. Normalized cointegrating coefficients
 |
| |
|
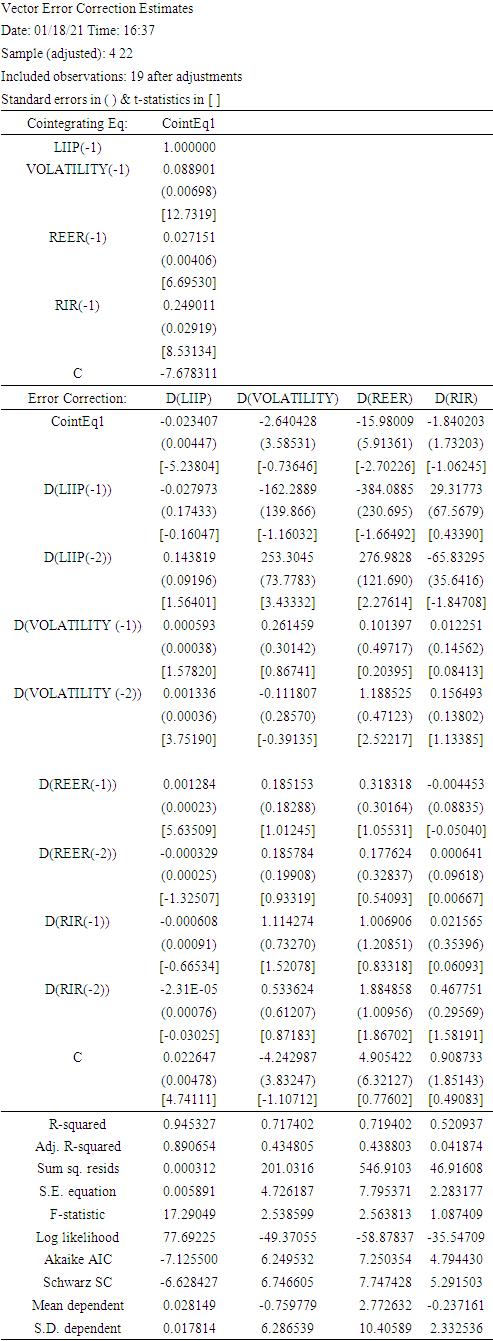
According to the result in table 4 indicate the coefficients of error correction term is negative (-0.023407) and significant at 1 percent level. 1% of the significance indicates the rate at which the model corrects the disequilibrium of the past. Thus, speeds of adjustment of index of industrial production towards the long-run equilibrium is 0.023407 percent per year. Meaning that the existence of cointegration among the variables. The next step is to construct a system equation to find out the P-value for each variable to be sure whether to accept or reject the null hypothesis. Table 4. Vector Error Correction Estimates
 |
| |
|
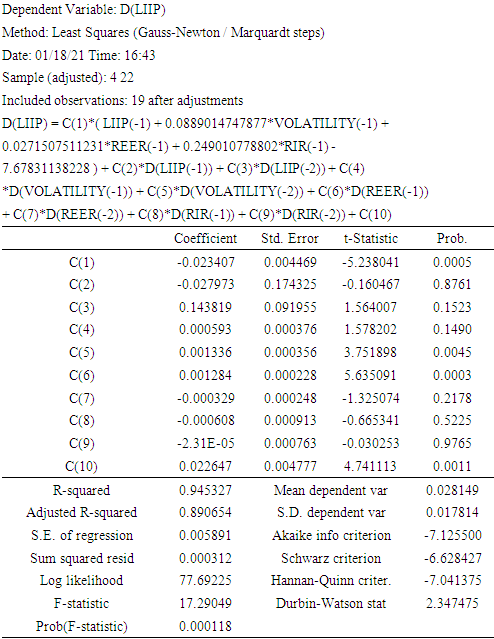
The C (1) represented in Table 5 is the error correction term which indicates the speed of adjustment towards to the long run equilibrium and the coefficient of the error term (C1) is negative as it supposed to be and statistically significant. The negative coefficient indicates that if there is any departure in one direction the correction would have to be pulled back to the opposite direction so as to ensure that the equilibrium is restored. Here C(4), C(5), C(6), C(7), C(8), C(9) represents the short run causality and we use this to check whether each independent variable cause change towards the dependent variable using Wald test. Table 5. Least Squares (Gauss-Newton/Marquardt steps)
 |
| |
|
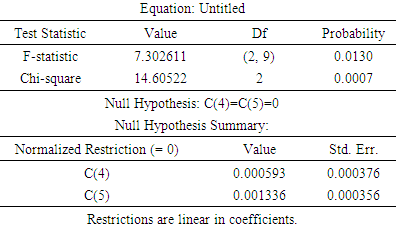
Results reported in Table 6a indicates the probability of the Chi-square associated with the wald test is less than 1%, meaning that we reject the null hypotheses C(4) = C(5) = 0. There is short-run causality running from stock price volatility to the Industrial production.Table 6a. Wald Test
 |
| |
|
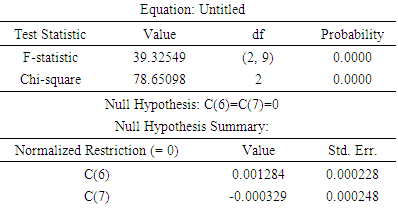
The Table 6b, reveals that the Chi-square p-value is less than 1%, meaning that we reject the null hypotheses C (6) = C (7) = 0. There is no short-run causality running from Real Exchange rate (REER) to the dependent variable Industrial production (IIP). Table 6b. Wald Test
 |
| |
|
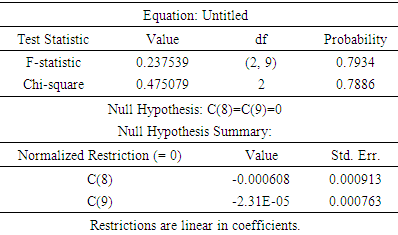
The Table 6c Reports that the probability value of the Chi-square is 78% which is greater than 0.05, we cannot reject the null hypothesis C (8) = C (9) = 0. meaning that Real Interest rate (RIR) does not has causal effect on industrial production (IIP) in the short run.Table 6c. Wald Test
 |
| |
|
4.3. Diagnostic Tests
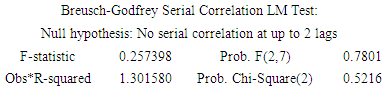
Breusch-Godfrey Serial Correlation LM Test: As represented in the Table 7, the probability of the Chi-Square associated with the Breusch-Godfrey Serial Correlation LM test value is greater than 0.05, meaning that we accept the null hypothesis of no autocorrelation at 5% significance level.Table 7. Breusch-Godfrey Serial Correlation LMTest
 |
| |
|
Figure 1 captures the CUSUM test for the stability of the model. The two boundary lines denote the critical bounds at a 5% significance level. CUSUM statistics plots do not cross the critical bounds, indicating stability in the VECM, but for the impact of macroeconomic indicating overall stability in the VECM. CUSUM test shows that the model is stable as it lies within the 5% significance boundary.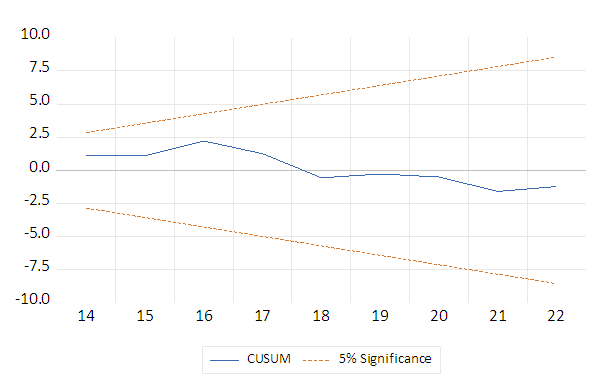 | Figure 1. CUSUM Test |
5. Conclusions and Suggestion
The study concludes that there is a co-integration and long run equilibrium between the dependent and explanatory variables as indicated in the VAR, VCEM and other diagnostic tests. Young innovative high-technology firms will be the main drivers of any country's long-term growth, and it is a promising platform to scale up the manufacturing sector to accelerate economic growth. A stable stock market is essential for the emergence and growth of these innovative firms. Paying less attention and less awareness about the stock market among the common economic participants would be a serious disadvantage for the development and growth of any economy. Therefore, the research recommends that both the government and the monetary authority of the country should adjust its policy to stabilize stock market prices as well as to propagate knowledge to the public of the benefits of investing in stock markets.Secondly, the government should form special departments to formulate and to implement appropriate policies which give equal importance to both the banking sector as well as the stock market of the economy to encourage savings and investments.Thirdly, The Securities and Exchange Board of India should consistently monitor practices by stock market operators such as brokers, agents and speculators in order to protect the interests of the shareholders. Additionally, more businesses should be inspired to get listed in the stock exchange, thereby more investment opportunities can be availed for the public and also stimulating the overall financial system.Furthermore, a lesson on the Stock market should be an essential part of any school curriculum which will take the fear of the stock market away from the young generation.Finally, the study recommends that the stock market practices has to be more transparent, for that purpose, the government, research institutes and the stock markets should ensure the free flow of information to the public at zero cost.
6. Recommendations
The study analysed the long run relationship between stock price volatility and the growth of manufacturing sector in India, and proved that there is a long run relationship with the variables also they are negatively related. However there is room for future research to analyse factors affecting stock market volatility in the Indian stock market, Further the research paved the attention of the impact of the overall Manufacturing sector in India, But the further research can narrow the field to a specific firm in India that is affected by stock price volatility, as each firms respond differently to volatility.
ACKNOWLEDGEMENTS
This research is supported by BA ISAGO University. Hence I take this opportunity to thank the management team at BA ISAGO for the kind of support, further this research would not have been possible without having enough resources / information and the data; therefore I take these opportunities to show my gratitude to all the journals which published articles and data which are relevant for this study. I would also like to extend my thanks to the IHS Markit for the EViews, the statistical package which I made use of my data analysis. Finally, I wish to thank my family for their support and encouragement to complete this paper successfully.
Conflict of Interest
This research will be supported by BA ISAGO University with the publication charges.
References
| [1] | A. E. Omoregie Eromosele, P.E Edo, 2013, “Stock market volatility and economic growth”, International Journal of Marketing & Financial Management, Volume 4, Issue 7, Oct-2016, pp 09-21 ISSN: 2348 –3954 (Online ISSN: 2349-2546 (Print). |
| [2] | Current affairs, 2018, “Data on industrial production- source: insightful analysis on the Indian economy”, http://985.so/97mw © GKToday. |
| [3] | Dr. S. Anubha, 2014, “Is India n Stock Market Highly Volatile? - A Comprehensive Study”. Economic voices, www.indiastat.com. |
| [4] | Economic Times. 2019. Dalal street week ahead: soaring VIX and F&O expiry promise choppier times ahead. http://985.so/97mx. |
| [5] | Joesph Massey. 2011, Inclusion will Drive Markets, http://985.so/97md. |
| [6] | K. Rakesh & T. Muhammad. 2011, “Economic growth, expected stock returns and volatility: A case of Indian stock market”. The international journal of applied economics and finance 5 (4): PP 257-268. |
| [7] | Luther Blissett. 2019, “Benefits of the Stock Exchange” https://finance.zacks.com/benefits-stock-exchange-6013.html. |
| [8] | Mian Sajid Nazir, et al. 2010, “Relationship between economic growth and stock market development”. African Journal of Business Management, Vol. 4 (16), pp. 3473-3479. At http://www.academicjournals.org/AJBM ISSN 1993-8233 ©2010 Academic Journals. |
| [9] | Nishad et al, 2015, “How volatile is an Indian stock market? A study based on selected sectoral indices”. Vol. 3 (Iss. 12): http://www.granthaalayah.com ©international journal of research - granthaalayah [142-149]. |
| [10] | N. Joseph & D. Dmbu, 2017, "Stock markets, volatility and economic growth: evidence from Cameroon, Ivory Coast and Nigeri," Panorama Económico, Escuela Superior de Economía, Instituto Politécnico Nacional, vol. 12(24), pages 145-175, Primer se. |
| [11] | O. A. Babatundeb, 2013, “Stock Market Volatility and Economic Growth in Nigeria (1980-2010)”. International review of management and business research, vol. 2 issues. |
| [12] | Reserve Bank Of India, 2016, “Handbook of statistics on the Indian economy”. (http://dbie.rbi.org.in). |
| [13] | S. Anagol etal, 2016, “Endowment Effects in the Field: Evidence from India’s IPO Lotteries”. Available at SSRN. https://gsm.ucdavis.edu/sites/main/files/file-attachments/endowment_effects.pdf. |
| [14] | Zukarnain Zakaria, 2012, Empirical evidence on the relationship between stock market volatility and macroeconomic volatility in Malaysia. Journal of Business Studies Quarterly, 4 (2): 61-71. |

 Abstract
 Reference
 Full-Text PDF
 Full-text HTML