-
Paper Information
- Paper Submission
-
Journal Information
- About This Journal
- Editorial Board
- Current Issue
- Archive
- Author Guidelines
- Contact Us
International Journal of Finance and Accounting
p-ISSN: 2168-4812 e-ISSN: 2168-4820
2020; 9(4): 77-85
doi:10.5923/j.ijfa.20200904.01
Received: Jun. 23, 2020; Accepted: Aug. 3, 2020; Published: Sep. 15, 2020

The Effect of Managers' Social Capital on Investment Sensitivity and External Financing of Firms
 Abstract
 Reference
 Full-Text PDF
 Full-text HTML
Elham Heidari
MSc. Financial Management from Science and Research University, Tehran, Iran
Correspondence to: Elham Heidari, MSc. Financial Management from Science and Research University, Tehran, Iran.
| Email: |  |
Copyright © 2020 The Author(s). Published by Scientific & Academic Publishing.
This work is licensed under the Creative Commons Attribution International License (CC BY).
http://creativecommons.org/licenses/by/4.0/

Nowadays companies in order stay in competitions and develop, attempt to attract funds from external financing relative to the socioeconomic conditions. One of the important factors in influencing these indicators is corporates’ social capital. The purpose of this study is to investigate the effect of managers' social capital on investment sensitivity related to cash, finance performance and stock return performance. This research is in the field of positive and applied theories and is descriptive in nature and uses correlation chart. The statistical population of the study is the listed companies in the stock exchange which was created using a systematic elimination method (636 company/year) for a period of 6 years from 2010 to 2015. The results of the research hypotheses show that there is a significant and direct relationship between investment sensitivity and corporate cash flow, corporate financial performance and corporate stock return performance. Also, it was confirmed that there is an inverse and significant relationship between investment sensitivity and corporate financing.
Keywords: Social capital, Investment sensitivity, External financing of firms
Cite this paper: Elham Heidari, The Effect of Managers' Social Capital on Investment Sensitivity and External Financing of Firms, International Journal of Finance and Accounting , Vol. 9 No. 4, 2020, pp. 77-85. doi: 10.5923/j.ijfa.20200904.01.
Article Outline
1. Introduction
- Highlight a section that you want to designate with a ce Analysts and other financial information users often formally or informally use models for evaluating and comparing the present value of cash flows from an investment that can be useful to control the accuracy of past valuations and the relationship between a business's activities and its receipts and payments [1]. One of the indicators of corporate financial constraints is stock price volatility. The higher the stock price volatility grows; sensitivity of corporate investment becomes more volatile [2]. Managers' long-term policies regarding social capital and maintaining an acceptable stability in the growth rate of financing depend on the returns from past investments [3]. Cash is one of the most important and vital resources of any business and plays a key role in many financial decisions and models of evaluation of investment plans and some traditional and new financial management analysis [4]. A review of the accounting literature also indicates that there is general agreement about the importance of cash flows and the value of a company's stock market will change due to investment sensitivities [5]. Experienced corporate executives seek policies that maximize productivity for the company. The greater the expertise of managers in relation to social networks and different investment topics and areas, the more diverse opportunities for growth and investment for the company will emerge [6]. Particular attention has been paid to the cash flows from investment in the theoretical framework of accounting and finance (which determines the goal, duty and the scope of accounting and financial reporting). This particular focus on cash flow has been to the extent that in most of the countries this issue has been considered as one of the goals of accounting and financial reporting. Because, theoretically speaking, cash flow can be beneficial in decision making regarding risk evaluation related to the amount and duration of loans, credit level prediction, company valuation, and provision of further information for stock market and etc. [7] Managers' social capital has an impact on investment sensitivity and in some cases may stimulate the growth of financing in a positive direction [8]. The term “investment sensitivity cash flow” refers to the percentage of changes in corporate capital expenditure against the percentage of changes in cash flow. Firms with severe financial limitations (companies with low and costly access to external funds) place greater emphasis on cash flow when making investment decisions. In other words, as the gap between the cost of internal and external financing increases, the sensitivity of investment to internal funds should increase [9]. Corporations with financial constraints are more sensitive to cash flow than firms without financial constraints. Therefore, they interpreted the high sensitivity of the cash flow of investment as a measure of the existence of financial constraints [10]. The sensitivity of the investment to cash flows is asymmetric. Cash assets allow companies to finance investments and other financial commitments and responsibilities to avoid the high costs of increasing inventory and external financing. Companies with an increase in cash flow are more capable of converting cash assets into investments because a positive cash flow shock means (non-credit) physical assets are being used more efficiently [1]. Thus, experienced corporate executives spend their cash on launching their own profitable projects. This can reduce investment sensitivity to financing, so when the cash flow of a company is positive, the change in cash assets is negative. On the other hand, companies' exposure to negative cash flow indicates a low productivity of existing physical assets or means that the company has projects with negative net present value. Therefore, the main issue of this study is to investigate the effect of managers' social capital on investment and external financing sensitivity of companies. There has been a great deal of academic research, both at home and abroad, on the social capital of managers and the impact of various factors on them. However, most of these studies have focused on the influence of different factors and variables on in-company policies and laws. So far, no research has been conducted to investigate the impact of managers' social capital on the sensitivity of foreign investment and corporate financing in Iran. Therefore, this research is completely new and with its innovative aspect seeks to enhance the theoretical foundations and enrich the literature of the present subject.
2. Literature Review and Research Hypotheses
- Little research has been done on the main research topic. But some of the research that is directly or indirectly related to the research topic is mentioned below:Sadeghi & Khalili Araghi [11], in another study, investigated the effect of managers 'shift work and performance prediction on the market value of shareholders’ equity. The results of their research showed that; the style of managers shift working has an adverse and inverse effect on the market value of the shareholders’ equity.Mehregan and Daliri [12] investigated the relationship between these variables in a study titled "Investigating the Relationship between Social Capital and Human Development in the Provinces of Iran (2006-2017)". They argue that based on existing literature, social capital has had positive effects on human development in the Iranian provinces and, on the other hand, human development will also create and reinforce the social capital layers in the provinces.Gandoman & Rostami [13], studied the relationship between systematic risk criteria, previous return and expected return of Iranian companies. The results of their research showed that there is a significant and direct relationship between the systemic risk criteria and the previous returns of the firms. Also, the results of their research showed that the there is a significant and direct relationship between the systematic risk criteria and the expected return of the firms.Moradi and Rostami [14], in a study titled "Investigating the Relationship between Corporate Governance Mechanisms and Corporate Performance after the Primary Supply: Evidence from Companies Listed in Tehran Stock Exchange" Using Financial Information of 70 Companies Listed in Tehran Stock Exchange during 2002-2008 examined the relationship between these variables. Their sample size includes 490 company-year.Research findings show that institutional ownership and managerial ownership have a positive relationship with corporate performance after initial supply. In addition, the presence of non-executive directors improves the performance of the company. However, no relationship was observed between the dual role of CEO and firm performance.Namazi and Shirzad [15], examined the impact of capital structure on the profitability of listed companies in Tehran Stock Exchange in the years 2007-2013. The results of this research indicate that there is no significant relationship between capital structure and corporate profitability.Khajehvandi, Soleymani; Pilevari [16], in another study, investigated the impact of the style of managers' shift activities and predict the performance on the company's market value of equity. The results of this research indicate that the style of managers' shift activities has a negative and inverse effect on the market value of the companies' equity.Ahern et al. [17], in a study titled “Social Capital and its Influence on Managers' Decision-making Criteria and Investigation of Relationships between these Variables Using Data Panel Statistical Method”, did research in this field and their results showed that the more the social capital of the company increases, the more the board of directors views investment positively which as a result increases the amount of investment and profitability of companies. Their results also indicated that the higher the profitability of the companies, the greater the brand and the social capital, will grow.Javakhdze et al. [18], in a study titled "Managers' social capital, investment sensitivity and external financing," examined the relationships between these variables. The results of their research in support of the first hypothesis showed that managers' social capital positively and directly influences investment sensitivity to corporate cash. The results of their research also related to the second hypothesis that managers' social capital had a negative and inverse impact on investment sensitivity to corporate finance. In addition, the results of their research on the third hypothesis showed that managers' social capital had a positive and direct impact on investment sensitivity to corporate financial performance. Finally, the results of their research in relation to the fourth hypothesis suggested that managers' social capital had a positive and direct impact on investment sensitivity to the performance of corporate stock returns.Dittmar & Duchin [19], in a study titled "Investigating the Relationship between Managers' Capital and How They Cope with Financial Problems Affecting Decisions Related to Cash Saving and Investment in Corporate Research and Development Expenses" examine the relationship between variables such as; Managers work experience, financial problems, and corporate cash reserve. Their research results show that companies with chairmen that have experienced financial problems in the past, maintain higher levels of cash than other companies and also invest less in R&D section.Experienced corporate executives seek policies that maximize productivity for the company. The greater the expertise of managers in relation to social networks and different investment topics and areas, the more diverse opportunities for growth and investment for the company will emerge [6]. Particular attention has been paid to the cash flows resulted from investment in the theoretical framework of accounting and finance (which determines the purpose, task and constraints of accounting and financial reporting). Particular attention has been paid to cash flows to the extent that in most countries this has been stated as one of the purposes of accounting and financial reporting, since theoretically cash flow has been beneficial in decision making such as risk assessment related to the amount and the time of loans, credit level prediction, company valuation, provision of further information for stock market [7]. Managers' social capital has an impact on investment sensitivities and in some cases may stimulate the growth of financing in a positive direction [8]. The term sensitivity of cash flow to investment refers to the percentage of changes in corporate capital expenditure against the percentage of changes in cash flow. Firms with severe financial constraints (companies with low and costly access to external funds) place greater emphasis on cash flow when making investment decisions. In other words, as the gap between the cost of internal and external financing increases, investment sensitivity to internal funds should increase [9]. Corporations with financial constraints are more sensitive to cash flow than firms without financial constraints. Therefore, they interpreted the high sensitivity to cash flow investment to of as criteria for the existence of financial constraints [10]. So far, the impact of managers' social capital on external financing and investment sensitivities in companies listed on the Tehran Stock Exchange has not been experimentally investigated. Therefore, considering the researches that have been already conducted and the existing limitations in identifying and measuring the social capital of corporate executives, it is necessary to conduct research in this field. Also, according to reviews and searches conducted on the website of Irandoc and Sika and other websites related to scientific research articles, so far, a study entitled "Investigating the Impact of Managers' Social Capital on the Investment Sensitivities and External Financing of Companies", has not been done in Iran and this research is innovative. Therefore, in order to achieve the objectives of the research and base on the theoretical foundations' literature review presented, four hypotheses have been formulated as follows:Hypothesis 1: Managers' social capital affects investment sensitivity to corporate cash.Hypothesis 2: Managers' social capital affects investment sensitivity to corporate financing.Hypothesis 3: Managers' social capital affects investment sensitivity to corporate financial performance.Hypothesis 4: Managers' social capital influences investment sensitivity to corporate stock return performance.
3. Research Methodology
- Because the results of the research can be used in the decision-making process, this research is considered practical. Also, this research is post-event in nature because in this type of research, the researcher collects and analyzes actual data from the environment that existed naturally or from past events that occurred without the direct intervention of the researcher. For data analysis, data panel and multiple regression model were used.The statistical population of this study includes all companies listed in Tehran Stock Exchange. According to the official website of Tehran Stock Exchange, all listed companies by the end of 2015 included 520 companies in 37 industry groups. Therefore, in this study, all listed companies in Tehran Stock Exchange during a six-year period, from 2010 to 2015, are the statistical population of the research. Also, in order to determine the study samples, companies from the above statistical population were selected that meet the following criteria:1. According to the required information from the year 2010, the companies that were listed in the Tehran Stock Exchange until the end of March 2012 and their names have not been removed from the list of these companies until March of 2015.2. Their shares have been actively traded on the exchange during the mentioned period.3. In order to increase the comparability of the companies under review, their fiscal period should end on March 20th and should not have a change in their fiscal period during the period under study.4. Do not be part of financial intermediation companies (investment, holding, leasing, banks and insurances) because of their different performance.5. Required information must be available.The conditions were applied in order, so that any company with the first condition is not counted for the subsequent condition. In the study, after applying the conditions, 106 companies from 19 industries remained.
3.1. Variables and Research Models
- Dependent variable: The sensitivity of the investment to the company's cash (INV i,t) will be calculated by the following formula [10]: INV i,t = CF*Negin which:INV i,t: It is equivalent to investing sensitivity to cash.CF i,t: Is the cash flow ratio that is calculated as follows:CF i,t=Cash flows from operating activities/ The book value of all assetsNeg: Is equal to the synthetic variable of the growth rate of the investment which equals if the firm's investment has a positive growth in the given year and otherwise equals zero.The sensitivity of the investment to the financing of the company (EXFIN i,t) will be calculated by the following formula [1]: EXFIN i,t =Finexp i,t * negINV i,t: Equal to investment sensitivity to financing.Finexp i,t : Equal to the ratio of the cost of financing that is calculated as follows:Finexp i,t : Financing costs/ The book value of all assets Neg: It is equal to the artificial variable of the growth rate of the investment which equals 1 if the firm's investment has a positive growth in the given year, otherwise it will be zero.The sensitivity of the investment to the financial performance of the company (AccPerf i,t) will be calculated by the following formula [18]: Accperf i,t =ROA i,t*Negin which:AccPerf i,t : Equals investment sensitivity to financial performance.ROA i,t: It is equal to the ratio of return on assets that is calculated as follows:ROA i,t = Net profit this yearNeg: Is equal to the synthetic variable of the growth rate of the investment which equals 1 if the firm's investment has a positive growth in the given year and otherwise equals zero.The investment sensitivity to the performance of a company's stock returns (Stockperf i,t) will be calculated by the following formula [2]:
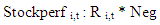 in which:Stockperf i,t : Equals investment sensitivity to stock return performance.R i,t : Equals the return on equity and how it is calculated:
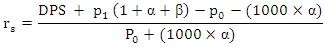
 : Stock returns
 : Stock prices at the beginning of the month
 : Cash Dividends accrued on each equity
 Percentage of capital increase from cash brought in
 : Stock prices at the end of each month
 Percentage of increase in capital from the reserveNeg: equal to the synthetic variable of the growth rate of the investment which equals 1 if the firm's investment has a positive growth in the given year and otherwise equals zero.Independent variable: social capital of the managers (SC i,t) is a synthetic variable that if the executives of the company in question have financial expertise and knowledge of social financial virtual networks is equal to 1, otherwise it would be zero [18].Control variable: the stock price volatility (PBV i,t) is equal to the growth rate of the stock price, which will be calculated as follows ( huang et al, 2016): AR i,t= P i,t-P i,t-1/ P i,t-1AR i,t = Stock price volatility compared to the previous year, the current year of the company i in year t.P i,t: Company stock price i in year t.P i,t-1: The stock price in the year preceding the year under review.We calculate and classify companies in each fiscal year based on the kz4it index (financial constraint index). Therefore, the companies whose size is calculated from the kz4it index average values, all companies in the sample are lower in the financial constraint category, otherwise they are in the financial constraint category.The Tobin’s q ratio is calculated as follows [2]:{Market value of equity + book value of assets} / book value of assets-Tobins, Q i,tsales ratio (Sales i,t) is equivalent to selling a company divided by the carrying amount of current assets [4].stock market value (Log (MVi,t) is equals the natural logarithm of the company's stock market value in the year before [5]. growth opportunities (BM i,t) is equals the market value to book value ratio used as a representation of investment opportunities [18].debt ratios (Debt i,t) is the sum of the short-term and long-term liabilities divided by the carrying amount of the total assets [7]. type of industry (FirmDust i,t) is zero and one is used to classify the industry in question. here the companies surveyed are productive, (IND = 1) and for other companies (IND = 0). This variable is used to control the difference of profit stability and accrual quality of industrial companies with the profit stability and accrual quality of other companies [8].Age of company (YearDust i,t) depends on the amount of productive and profitable activities. The higher the productive and profitable activities of the companies, the greater the life cycle of the company. The life cycle of the company is equal to the logarithm of the age of the company from the year it was founded to the end of the year under review [9].
3.2. Research Models
- Model 1 to 4 will be used for testing the first to fourth hypotheses, respectively. In this model, if the coefficients
 (coefficients of independent variables) are significant at 95% confidence level, the first to fourth hypotheses of the study will be confirmed, respectively.The research models, derived from the research of Javakhadze et al. [18], are estimated as follows:Model for the first research hypothesis:
 Model for the second research hypothesis:
 Model for the third research hypothesis:
 Model for the fourth research hypothesis:
 In these models i represents company (sectional unit) and t represents the year.
 is the accidental error of company i in year t.
4. Study Findings and Results
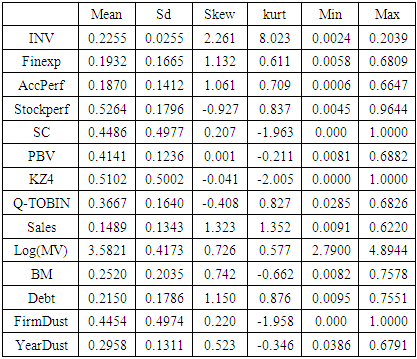
- Table 1 presents the descriptive statistics of the research variables:
|
4.1. Model Selection Test Results
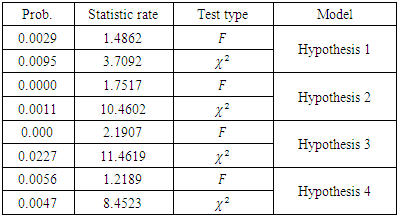
- The method of this study is regression analysis which uses the combined data obtained from the financial statements of sample member companies to test the hypotheses. According to Ashrafzadeh and Mehregan (2010) research, F-Limer test was used to determine the type of regression model and Haussmann test was used to determine the data panel type. The results of the F-Limer and Haussmann tests are presented in Table 2.
|
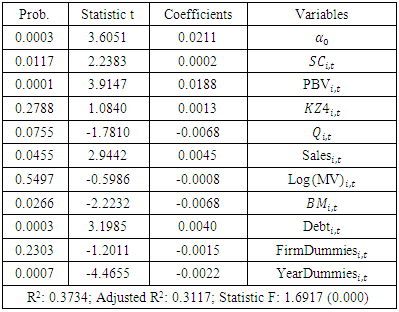
4.2. Test Result of the First Hypotheses
- Regarding the significance of the whole model considering that the probability value of F statistic is less than 0.05 (0.0000), confirms the 95% significance of the whole model. The coefficient of determination of the model also shows that 31.17% of the investment sensitivity to corporate cash is explained by the variables included in the model.According to the results presented in Table 3, since the probability of statistic t for variable coefficient of managers 'social capital variable is less than 0.05 (0.0117), therefore, there is a significant effect of managers' social capital on investment sensitivity to corporate cash at 95% confidence level. Therefore, the first hypothesis of the study is accepted and it can be said with 95% confidence that managers' social capital has a significant impact on investment sensitivity to corporate cash. The positive coefficient of this variable (0.0002) indicates the direct effect of managers 'social capital on investment sensitivity to corporate cash, so that by increasing one unit of managers' social capital, investment sensitivity to corporate cash also increases by 0.0002 units. Therefore, based on the analysis for the confirmation of the first hypothesis of the research, it can be concluded that managers' social capital has a direct and significant effect on investment sensitivity to corporate cash.
|
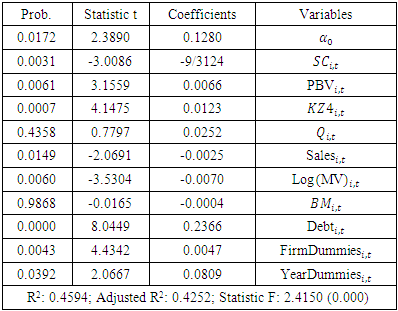
4.3. Test Results of the Second Hypothesis
- The purpose of the second hypothesis of the research is to investigate whether managers' social capital affects investment sensitivity to corporate financing. The validity of the whole model considering that the probability value of F statistic is less than 0.05 (0.0000) confirms with 95% confidence that the whole model is significant. The coefficient of determination of the model also indicates that 45.94% of investment sensitivity to financing is explained by the variables included in the model. According to the results presented in Table 4, since the probability of t statistic for variable coefficient of managers 'social capital, is less than 0.05 (0.0031), therefore the significant effect of managers' social capital on investment sensitivity to financing is confirmed with 95% confidence level. Thus, the second hypothesis of the study is accepted and it can be said with 95% confidence that managers' social capital has significant impact on investment sensitivity to financing. The negative coefficient of this variable (-9.3124) indicates the negative effect of managers 'social capital on investment sensitivity to financing, such that with a 1 unit increase in managers' social capital, investment sensitivity to financing is also reduced 9.3124 units. Therefore, based on the analysis pertaining to the second hypothesis, it can be concluded that managers' social capital has a significant and inverse effect on the investment sensitivity of corporate finance.
|
|
|
5. Conclusions and Recommendations
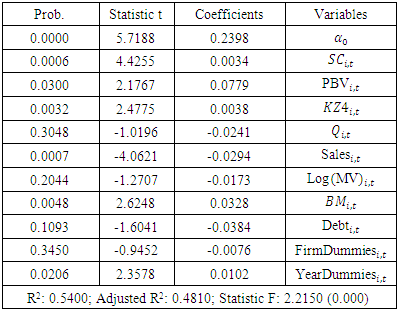
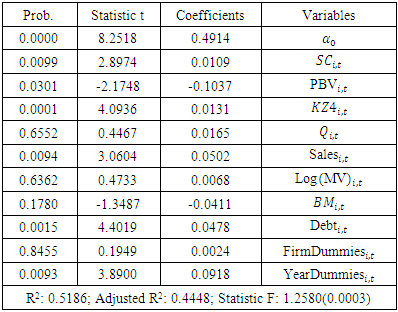
- The main issue of this study is to investigate the effect of managers' social capital on the sensitivity investment and external financing of companies. Managers 'social capital will reduce companies' need for financing. The higher the social capital of managers, the higher the positive investment growth rate will be, and the financing growth rate will experience negative fluctuations [2]. Based on the financing model, cash can be derived from financing and investment activities [3]. Therefore, profitable companies are more likely to pay dividends, pay off debt obligations and save cash. Less profitable companies will keep less cash and issue debt to finance projects. Therefore, companies will not be willing to issue shares because of the high costs associated with such releases [4]. Companies with lower cash flows attempt to issue debt and financing for investments but they have no incentive to issue stocks since it is very costly to finance projects with this method [6]. The performance of shareholder revenue represents the profit percentage that shareholders in the company have, have gained on their salary, so the profitability ratio of the company is directly related to the social capital of the Investment sensitivity[5] to corporate cash flows can be an effective factor in lowering the financial constraint index of corporate investment [7]. The importance of managers' social capital is debatable in that it in some cases increases the incentives to invest for new investors [8]. The sensitivity of the investment to the financial performance of the company reflects the extent to which the financing impacts the industry. Also, given the high importance of investment sensitivity to the performance of a company's stock returns, the firm's financial constraint index will decrease when experienced executives implement policies to increase investment in firms [9]. Stock market value fluctuations affect investment sensitivity to corporate financing and drives up the cash flow growth rates [10]. The results of the first hypothesis test showed that the probability of t statistic for variable coefficient of managers' social capital is less than 0.05 (0.0117). As a result, the significant effect of managers' social capital on investment sensitivity to corporate cash is confirmed with 95% confidence level.The result of the first hypothesis is that there is a significant relationship between independent and dependent variable with Sasidran et al. [20] Christopher, Vassil [21] research, but in relation to the type of relationship (direct or indirect) is more related to the results of Engelberg et al. [7] and contradictory to the research by Kusnadi and Wei [5] and Kuhnen [6]. The results of the first hypothesis test showed that the probability of t statistic for variable coefficients of managers' social capital is less than 0.05 (0.0031). As a result, the effect of managers' social capital on investment sensitivity to financing is confirmed with 95% confidence level. Therefore, the second hypothesis of the research is accepted. Also, according to the analysis of the second hypothesis, it can be concluded that the social capital of managers has an inverse and significant effect on the sensitivity of investment to corporate financing. The results of the second hypothesis of our study are in line with the findings of Francis et al. [22], Nobanee et al. [23], and Shakeri and Ebrahimi salari [24] are in contrast to the findings of Fracassi & Tate [9] and Fracassi [4]. The results of the third hypothesis test showed that the probability of t statistic for variable coefficient of managers 'social capital is less than 0.05 (0.0006), thus the significant effect of managers' social capital on investment sensitivity to financial performance is confirmed with 95% confidence level.The results of our third research hypothesis are consistent with the findings of Engelberg et al. [7], Sadeghi & Araghi [11], and Cai & Sevilir [1], however they are in contrast to the findings of Kusnadi and Wei [5]. and Kuhnen [6]. The results of the third hypothesis test showed that the probability of t statistic for the variable coefficient of managers 'social capital is less than 0.05 (0.0099), thus the significance of the effect of managers' social capital on investment sensitivity to stock return performance is confirmed with a 95% confidence level.The results of the fourth hypothesis of our study are in line with the findings of Kalatzis et al. [25], Shakeri and Ebrahimi salari [24] and are in contrast with the findings of Chen and Chen [2] and cai et al. [3]. Proposals based on research results1. Based on the results of this and similar researches, the Securities and Exchange Organization can provide more comprehensive information on investment sensitivity to cash, investment sensitivity to financing, investment sensitivity to financial performance, and investment sensitivity to stock return performance for shareholders.2. Recommendation of accounting standardization authorities to voluntarily disclose comprehensive information on the amount and level of managers' social capital and investment sensitivity to cash, investment sensitivity to financing, investment sensitivity to financial performance, and investment sensitivity to corporate stock return performance.3. Because increasing the level of managers 'social capital can have a significant impact on investors' decision-making, providing full and transparent information on management's social capital and investment sensitivity to cash, investment sensitivity to financing Financial, investment sensitivity to financial performance and investment sensitivity to stock return performance will be very helpful.4. It is advisable to have financial analysts active in the capital market, stock market investment advisers along with the usual analytics and the techniques that they perform, do some specific analytics based on the situation of investment sensitivity to cash, investment sensitivity to finance, investment sensitivity to financial performance, and investment sensitivity to stock return performance and the factors affecting it, and the social capital of corporate executives with respect to accounting standards.The most important suggestions for future research are as follows:The following issues can be addressed in order to make more use of the results of the research and to help clarify the impact of managers' social capital on their future investment and external financing sensitivities.1. Study the impact of industry type on the relationship between managers' social capital and investment sensitivity to cash, investment sensitivity to financing, investment sensitivity to financial performance, and investment sensitivity to corporate stock return performance.2. Using other controlled evaluation variables, such as financial constraints and industry index, in examining the impact of managers' social capital on investment sensitivity and external financing of companies.3. Investigate the impact of macroeconomic variables, such as inflation, oil prices and exchange rates, on identifying the impact of managers' social capital on investment and external financing sensitivity of companies.
ACKNOWLEDGEMENTS
- I would like to recognize my supervisor Dr. Mohsen Hamidian of the Depatrment of accounitin and Economic, Science and Research Branch, Islamic Azad University, Tehran, Iran. The door to Prof. Mohsen Hamidian's office was always open whenever I ran into a trouble spot or had questions about my research. He consistently allowed this paper to be my work but steered me in the right direction whenever he thought I needed it.