-
Paper Information
- Paper Submission
-
Journal Information
- About This Journal
- Editorial Board
- Current Issue
- Archive
- Author Guidelines
- Contact Us
International Journal of Finance and Accounting
p-ISSN: 2168-4812 e-ISSN: 2168-4820
2020; 9(3): 45-55
doi:10.5923/j.ijfa.20200903.01

Quality of Accounting Numbers and Shareholders Wealth Maximization: Empirical Evidence for Investment Decisions in Nigeria
 Abstract
 Reference
 Full-Text PDF
 Full-text HTML
Theophilus Aguguom A.1, Ademola Ajayi2
1Department of Accounting and Finance, Augustine University, Ilara Epe, Lagos State, Nigeria
2Department of Accounting, Babcock University, Ilishan-Remo, Ogun State, Nigeria
Correspondence to: Theophilus Aguguom A., Department of Accounting and Finance, Augustine University, Ilara Epe, Lagos State, Nigeria.
| Email: |  |
Copyright © 2020 The Author(s). Published by Scientific & Academic Publishing.
This work is licensed under the Creative Commons Attribution International License (CC BY).
http://creativecommons.org/licenses/by/4.0/

Global discontentment resulting from a widening gap in reported earnings and the underlying economic realities on the ground is increasingly disturbing. These inaccuracies create uncertainties and loss of confidence making many financial executives believe that financial reporting has degenerated into an ever-more burdensome compliance exercise rather than precise facts for investment decisions. In addressing the concern, this study investigated the effects of quality of accounting numbers on shareholders’ wealth maximization. This study adopted an ex post facto research design, using a population consisted of all the 173 listed companies on the Nigeria Stock Exchange (NSE) as at 31st December 2018 as contained in the NSE Factbook. A stratified and purposive random sampling technique was employed to select 10 companies for a period of 10 years (2010-2019), where companies with incomplete data from their published audited financial statements were not selected. Diagnostics tests of a correlation matrix, normality, and Breusch-Pagan/Cook-Weisberg test for Heteroscedasticity were conducted. Panel data regression was used for the data analysis. The result revealed that the quality of accounting numbers (QAN) had a statistically positive significant effect on economic value added (EVA), while QAN exerted a statistically positive effect on earnings per share. With introduced control, QAN exhibited stronger statistically positive significant effect on EVA, while QAN revealed a strong statistical effect on EPS. Based on the findings, the study recommended that the monitoring functions of the board be intensified to enhance more accurate and transparent accounting numbers in financial reporting, towards building up confidence in investors investment decisions.
Keywords: Accounting numbers, Corporate governance, Earnings smoothing, Financial reporting, Investment decisions
Cite this paper: Theophilus Aguguom A., Ademola Ajayi, Quality of Accounting Numbers and Shareholders Wealth Maximization: Empirical Evidence for Investment Decisions in Nigeria, International Journal of Finance and Accounting , Vol. 9 No. 3, 2020, pp. 45-55. doi: 10.5923/j.ijfa.20200903.01.
Article Outline
1. Introduction
- Shareholders wealth maximisation hypothesized that the immediate financial objective and crucial aim of public corporations is and should be to maximize returns to shareholders [1]. In an organized capital market setting, the general assumptions and corporate objective of companies had always been for the companies to strive to create and grow shareholders’ wealth, as no company would economically and stably exist if it failed to create sufficient wealth for the shareholders, unfortunately, managers of corporate organizations regrettably in undertaking of this corporate objective, pursue their own interests [1], [2]. Economic value added is a performance measurement attribute replicating the absolute amount of shareholders’ wealth creation and growth, through an efficient investment decision and while some studies criticized economic value added (EVA), other studies obtained mixed results and doubt the role of EVA on true wealth creation for shareholders if the level of quality of accounting numbers are not resolved [3], [4], [5]. Shareholders wealth maximisation model has been the subject of criticisms, considering other stakeholders interests point of view. while Stout ([31], [27], argued that there are others interest groups whose interest need to be protected, who are interest on profit maximization rather than absolutely shareholders wealth maximisation, that it is rather dogmatic, prescriptive, standard assumption in the economics and mere financial literature postulate. There are uncertainties surrounding investment predictions due to risk associated inconsistencies, and this necessitates the investors to seek appropriate and reliable information to reduce the risk biased reporting of moral hazard and adverse selection problem associated with unreliable reports leading to resource allocation inefficiency and poor portfolio diversification [6]. Quality of accounting numbers become desirable in restoring confidence and reliance on the reported earnings and to enhance shareholders’ wealth and overall economic performance of firms. Accounting information provides fundamental basis for the decision making of investors and other interested parties [7]. Thus, stakeholders especially the investors, desire relevant accounting information that is timely and reliable, so that it can assist them in making informed decisions. Quality of accounting numbers are very vital since it relates to the truthfulness and accuracy with which reported information about the company reflects its actual operating financial performance, and how the present information can help users make predictions of future performance of the company [8]. The studies of [9], [10], [11]. [12] equally posited that the use and potency of quality of accounting numbers in solving the problems associated with shareholders’ wealth is not in doubt, and that there are two general perspectives. The first is the quality of financial reporting determined on the basis of the usefulness of the financial information to its users and particularly to shareholders. Secondly, the quality of accounting numbers are focused on the notion of shareholders’ wealth protection. Therefore, financial reporting is the process of communicating economic measurement, shareholders’ wealth creation and growth, transparency obligation and accounting accurate information about the resources and performance of a reporting entity to those having reasonable rights to such information so as to facilitate informed judgments and decision making. It deals with the presentation of financial and other relevant statements to show the extent to which the objectives of the shareholders and shareholders’ wealth creation have been achieved [13].From prior studies of [14], [15], [16], [17], there is an ongoing debate on the quality of accounting numbers in literature, The manipulation of reported earnings of companies in the process of financial reporting mislead concerned investors who use the information in the reported financial statements as the true underlying economic performance of the companies [14]. Ideally, earnings are deemed to represent a quality of accounting numbers if they characterize the current companies’ underlying economic realities of performance or can be used by analysts to predict the future performance of the company [15]. In addition, financial reporting is widely considered as an important tool to reduce information asymmetries and also diminish the agency a problem in real financial information management and conflict of interest issues [17], [16]. This conflicting opinions confirm that ensuring the quality of accounting numbers are complex and a series of compromise in financial reportage revealed, resulting to loss of confidence in relying on reported financial statements for investment decision making. This indeed creates a great concern and a big the problem about the veracity and quality of reported financial statements globally. Studies from developed economy had come to an understanding that there are unresolved problems on the quality of financial reporting. For example, the studies of [18] from the United States of America; [19] from China; [20] from Greece are of the opinion that the quality of accounting numbers are problematic and naturally affects the shareholders’ wealth negatively. From the Nigerian studies, [21], [22] and [23] laid emphasis on the use of quality of accounting numbers and explained that the quality of accounting numbers deal with the presentation of firms’ financial statements and other relevant non-financial statements to owners and other stakeholders reflecting the extent to which the company has fared within the period under consideration. Nevertheless, [22] revealed that the quality of financial reporting in Nigeria lacks global acceptance, credibility, and quality, affecting the level of confidence by foreign and local investors in relying on them. In this regards, the International Financial Reporting Standards (IFRS), in its bit to control the tide on unethical reporting and poor disclosure of information in the financial statements, encourage voluntary and mandatory disclosures in compliance to applicable standards for the benefit of shareholders and other stakeholders as well [22]. Earnings management occurs when managers use judgment in financial reporting and in structuring transactions to alter financial reports to either mislead some unsuspected stakeholders about the underlying economic performance of the company or to influence contractual outcomes that depend on reported accounting numbers [23], [11]. The resultant effects of these gross accounting violations are disastrous and have created ripples in the corporate world. Relative to weak regulatory environment, weak corporate governance leading to expropriation of minority shareholders, low information disclosure level and regulatory non-compliance causes high information gap between managers and investors, and its resulting conflicting results of the effect of quality of accounting numbers on shareholders’ wealth requires further investigation. Prior studies had not considered the effect of accounting numbers on shareholders’ wealth maximization as evidenced in economic value-added and earnings per share. In addressing this gap, this study in its originality is significant and timely in filling identified gaps, contributes to extending the frontiers due to the relevance of quality of accounting numbers in financial reporting and investment decisions in the emerging economy of Nigeria. The rest of the study is structured in this manner: Section 2 considers extant literature and hypotheses development from the perspectives of conceptual, theoretical underpinning, and empirical reviews. In section 3, the study presented the methodology, measurement, and specifications of variables. Section 4, reflected the data analysis, results, and discussion of findings, while in section 5, the study presented conclusion and recommendations.
2. Extant Literature
2.1. Shareholders Wealth Maximisation Model (SWM)
- The concept of wealth maximisation call for an entity’s manager to continually pursue for highest possible return on equity fund invested in the business, while alleviating any associated risks loss. Shareholders wealth maximisation model (SWM) objective is nearly global accepted goal of public corporations as managers are expected to take decisions that will maximize shareholders wealth [23]. Following the Basel III agreement, to ensure increased equity, negating Tin capitalization hypothesis, it is expected that to make shareholders as rich as possible is the ultimate goal of managers [21], [18]. More so, it is remarkable to state that financial managers transverse a long journey by changing its focal point conventional to modern thinking, the modern thinking theory concentrates on wealth maximisation rather than profit maximisation, and in most cases efficiency in perfecting increased earning than professional competence [24].Quality of Accounting Numbers: Quality of accounting otherwise known as the quality of accounting numbers are one of the means to measure and to reflect an establishment’s financial and overall performance, including shareholders’ wealth. [24] opined that reliable and effective information from reported financial statements motivate interested and potential investors in placing confidence in making investment decisions. [25] defined financial reporting as the informativeness of financial reports about the company’s underlying economics which affects dividend policy in three categories: One, reporting quality can affect dividend by mitigating the free cash flow problem; two, it recognizes that managers have incentives to understate dividends and Three, managers can invest the cash flow in value-destroying projects for private benefits. Investors could be interested in reports that are not a product of manipulations and likely would put their resources and funds in such establishments. One of the primary goals of financial reporting is to provide high-quality financial reporting for decision making [26], [27]. Shareholders’ wealth in this study is regarded as the value returned to share owners as a result of their investment in listed companies and a product of managers’ ability to manage the company effectively. This could be evidenced in form of dividend payment, the level of earnings per share, returns on investment and economic added value [28], [29]. Earnings Smoothing: Income smoothing had been considered based on different definitions. The study of [30] defined earning smoothness as the technique used by company managers to induce a change in the reported amount of income by means of artificial or real earnings management so that it can reach a desired income level. There are likely motivations behind income smoothing, among them are: That managers are likely to increase performance by income smoothing; that companies that are interested in satisfying their financial desires by selling shares will engage in income smoothing; hence, the income fluctuation leading to manipulation in share is likely to discourage investors, and for tax purposes as a company might pay less income tax based on lowered reported financial numbers. Earnings smoothness signified the unpredictability of earnings compared to the predictability of cash flows [31], [32]. The study of [33] postulated that the availability of inconsistent positions with regards to smoothing, on one side, could be presented as a desirable feature of stability; while on the other side, could as well be interpreted as an opportunity and deceptive attitude. Elucidating more on this, the study of [34] postulated that there are two types of income smoothing in support of [31], a natural smoothing as a result of genuine result from income-generating process devoid of manipulations by the managers, and the other is either intentional smoothing or real smoothing.Economic Value Added: The concept of economic value added (EVA) is one of the economic value-based measures that estimate shareholders’ wealth and it is widely used by managers in making decisions; and provide indications of increasing productivity new fund investment, as well as a guide in assessing the underlying economic performance and/or indication of underperforming assets of the company [1]. Meanwhile, [35] defined EVA as a perfect a performance measurement tool that reflects the absolute amount of shareholders’ wealth creation through an effective investment decision. EVA is different from other traditional performance measures since it completely account for a company’s overall capital costs, a positive EVA is an indication that shareholder value is created while negative suggests otherwise [36]. However, EVA as a measure and its calculation are criticized due to its numerous adjustments to profit and capital employed figures [37], [38] stated that economic value added (EVA) estimates the difference between the return of an establishment’s capital and cost of the capital invested. According to [10], the EVA based performance measurement system is the basis on which the company should take appropriate decisions related to the choice of strategy, capital allocation, merger & acquisitions, divesting business and goal setting. While deciding resource allocation it becomes necessary to appreciate the EVA impact of such a decision [38].International Financial Reporting Standards (IFRS): Prior studies had shown conflicting findings on the impact of IFRS adoption on various nations accounting quality: [18], [20]. Specifically, From Sweden, [39] examined whether the quality of financial reporting has increased after the mandatory adoption of IFRS. The study employed the analysis of accounting earning quality property measures: earnings smoothing, timeliness, and association with share price. The study surprisingly in contrast to [20]’s findings found that all the measures decrease for the accounting qualities on the IFRS adoption in Sweden. From the perspective of this study, adoption of IFRS globally has lots of benefits both reduction in costs of the preparation and consolidation of financial statements of the parent and other business associates across borders. Also, there is a capital asset increase in international markets, as it makes it easier to apply one set of standards with the analytical and comparability of financial statements from many cross-border locations of operations. It is expected that adoption of IFRS would help in the harmonization of various nations’ divergent tax law policies, exchange rate disparity and usage of a common transactional rate in international trade among multinational corporations globally.
2.2. Theoretical Underpinning
- This study is anchored on economic efficiency theory as pioneered by states that companies should achieve their output at the lowest possible cost per unit produced. According to this theory, optimal production can be achieved by economies of scale. Therefore, in the short run, maximum operational efficiency is attained at the level of output at which all accessible economies of scale are taking advantage of such efficiency. In the long run, lifting the capacity of an existing system can increase the optimal level of production efficiency [40], [41]. There are two perspectives of economic efficiency theory: allocative (price efficiency) takes place when the business employs all of its resources efficiently, producing the most output from the least input [42]. Resource allocation and efficient utilization give rise to economic efficiency. The theory is related to this study because the aim of every shareholder is wealth maximization and increasing the creation of wealth. Therefore, the efficiency and effectiveness of the managers go a long way to achieve the shareholders’ wealth increase objective.
2.3. Empirical Review
- [43] Examined the effect of economic value added as a predictive tool on firm performance of selected automobile companies in India. The study found that out of eight variables selected, economic value added had 69.9% out of the eight variables, the study concluded that EVA had a positive relationship with sales and profit after tax of the selected companies. In the same manner, [44] examined shareholders’ wealth and private sectors banks using economic value added for 5 years of some selected banks for a period of 2004-2005 and 2009-2010 (4 years). The study revealed that none of the variables used had a significant impact on the stock of Kotak Mahindra bank except economic value added as one of the variables. [45] Investigated the relationship between dividend and shareholders’ wealth using Economic added value (EVA) as a proxy for shareholders’ wealth. The study found that economic added value (EVA) had a negative relationship with the dividend, [45] concluded that when dividend is paid, it reduces firms retained earnings. The studies of [46] and [47] examined the usefulness of economic value added as a measure of shareholders’ wealth. [46] Investigated the usefulness of the EVA approach to company financial performance in a dynamic environment. The study revealed that economic value-added and earnings per share are appropriate properties to measure a company’s worth as it is said to be innovative in terms of prevailing macroeconomic environment unlike the traditional accounting criteria. On their part, [47] examined the relative and incremental information content of economic value added (EVA) of 873 listed companies in India. The study found that economic value added showed a more positive relationship compared to the other accounting-based measures in explaining the market value-added. More so, [48] studied earnings persistence and firm performance, implications of analysts’ accurate forecast ability from the emerging market of Nigeria. The study considered the potency of value earnings persistence and its effect on firm performance and the implication of the analysts’ accurate forecast ability from the emerging market of Nigeria. The study explored ex post facto research design using a sample of 15 companies randomly selected from a population of 51 companies listed on the Nigerian Stock Exchange. A descriptive and panel data regression were used in the analysis of the specified variables, using panel robust standard errors to control the heteroscedasticity. The study found that earnings persistence had a negative insignificant effect on firm performance, leverage revealed a positive relationship whereas firm size exhibited a negative association between Tobin’s Q. Similarly, investigated the relationship between market value-added and economic value-added. The study found that economic value added is a better measure of firm performance and a better method of the managerial compensation program to enlighten an establishment’s future. Also that the procedure improves investors’ confidence and hopes for future profitability.
3. Methodology
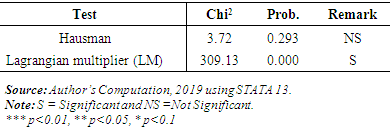
- This study adopted an ex post facto research design, exploring a population consisted of all the 173 listed companies on the Nigeria Stock Exchange (NSE) as at 31 December 2018 as contained in the NSE Fact book. A stratified random sampling technique was employed to select 10 companies for the period of 10 years (2010-2019), while data were sourced from the published audited financial statements of the selected companies. Companies with incomplete data were not selected as panel data regression were explored. To validate the validity and reliability of data, diagnostics tests of a correlation matrix, normality, and Breusch-Pagan/Cook-Weisberg test for Heteroscedasticity were conducted.Statement of Hypothesesi. Quality of accounting numbers have no significant effect on economic value added of the listed companies in Nigeria;ii. There is no significant effect of quality of accounting numbers on earnings per share of the listed companies in Nigeria;iii. Quality of accounting numbers with controlling variable of Firm size has no significant effect on economic value added of the listed companies in Nigeria;iv. There is no significant effect of quality of accounting numbers with controlling variable of firm size on earnings per share of listed companies in Nigeria.Operationalization of Variables and Model Specification
 | (3.1) |
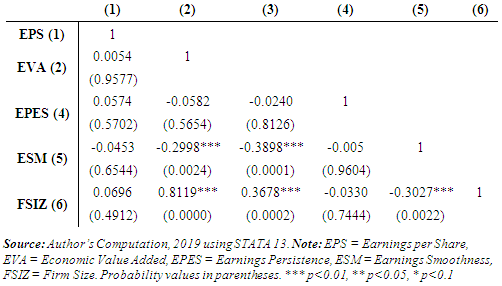
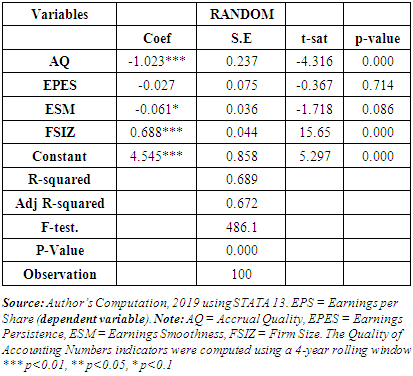
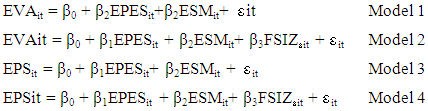 Where: β0 = regression intercept which is constant; β1, β2, β3 = the coefficient of the explanatory variable;ε is the error term of the model; i = cross-sectional variable; t = time series variable;EPS = Earnings per share; EVA = Economic value added; EPES = Earnings persistence;ESM = Earnings Smoothing; FSIZ = Firm SizeA Priori Expectation: The study expected quality of accounting numbers (QAN) positively impacts the overall shareholders' wealth maximization in terms of earnings per share (EPS), and Economic Value Added (EVA) and selected the controlling variables of firm size. Hence, the a priori expectation is represented thus β1 – β4 > 0 = Positive. The specified models will be tested at 95% confidence level.Measurement of VariablesEarnings per Share (EPS): In this study, earnings per share relates to the earnings generated by the business and available to ordinary shareholders to the number of ordinary shares ranking for dividend during the period. The study adopts [50] model and follow common practice to compute the variables as follows:
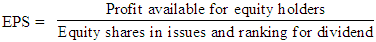 | (3.2) |
 | (3.3) |
 | (3.4) |
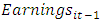 = net income before extraordinary items of firm
  in year
 = constant (intercept) coefficient;
  = the non-constant (slope) coefficientPersistence earnings are seen as higher-quality earnings since they are sustainable [51], [50].Earnings Smoothness: The study measures earnings smoothness as the percentage of the firm-level standard deviation of earnings and the standard deviation of the operating cash flow as used in [50] study. The study adopts [50] and measures earnings smoothness using the following:
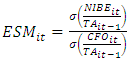 | (3.5) |
 = net income before extraordinary items of firm
  in year
 = cash flow from operations of firm
  in year
 = total asset of firm
  in year
  Controlling Variables: Firm size: The firm size in this study, is consistent with [50] and [51] studies, which measured firm size as the log of total assets of firm i for time period t. Following the study of [51], this study compute firm size using the log of total assets in thousands of Naira (Log of total assets).
 | (3.6) |
|
|
4. Analysis, Results and Discussion of Findings
4.1. Effects of Quality of Accounting Numbers on Economic Value Added
|
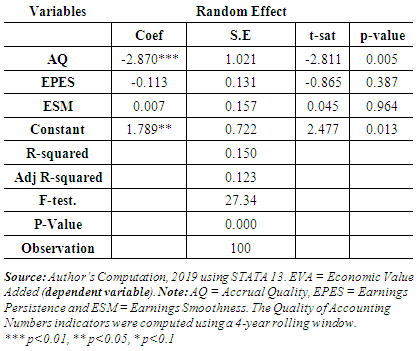
 In model 1, Table 3 (EVA = 1.789 – 2.870AQ – 0.113EPES + 0.007ESM), the estimated coefficients indicate that accruals quality (AQ) and earnings persistence are negatively signed; β1 = - 2.870; β2 = -0.113) < 0. These are not in consonance with expectations. However, earnings smoothness (ESM) is positively signed in line with a priori expectation β3 = 0.007 > 0.From the result of the random effect model in Table 3, the Wald – statistic value of 27.34 (P-value = 0.000) suggests that the quality of accounting numbers indicators are all statistically significant in explaining variations in economic value added (EVA). Besides, as indicated by the R-squared value of 0.150, the explanatory variables jointly explain about 15.0% of variances in EVA. This further confirms that the model is well fit. Furthermore, the result in Table 3, indicated that each of AQ and EPES, will result to a decrease of 2.870 and 0.113 in EVA respective, a unit change in ESM will result to an increase of 0.007 in EVA.Discussion of Findings: Interpreting the coefficients quality of accounting numbers indicators, the coefficient accrual quality (AQ) is negative and statistically significant at 1% level (coef. = -2.870; P-value = 0.005) suggesting that accrual quality (AQ) is a determining factor of Economic value added (EVA). Alternatively, it means that the economic value added (EVA) of the selected companies increase by 2.870 units given a unit decrease in accrual quality (AQ) of the selected companies. However, the relationship between earnings persistence (EPES) and economic value added (EVA) is also negative but statistically insignificant within the 1% and 10% levels of significance (coef. = -0.113; P-value = 0.387). This simply means EPES is not significantly related to EVA, though negative. Similarly, earnings smoothness (ESM) is seen to have positive and insignificant relationship with economic value added (EVA) (coef. = 0.007; P-value = 0.964). These simply suggest that mean that earnings persistence (EPES) and earnings Smoothness (ESM) are not determining factors of economic value added (EVA) during the period of this study. The study findings of the quality of accounting numbers (accruals quality) having a negative significant relationship with economic value added is consistent with the study of [45] who found that the quality of accounting numbers had a negative significant relationship with economic value added. However, on the contrary, [43] found a positive significant relationship between economic value-added and profit after tax in India. Also, [44] equally found a positive significant relationship between economic value-added and stock returns. The study of [47], who investigated the association of economic value-added and accounting earnings, found a positive significant association between economic value-added and accounting earnings.
4.2. Effects of Economic Value Added on Quality of Accounting Number with Control Variable of Firm Size
|
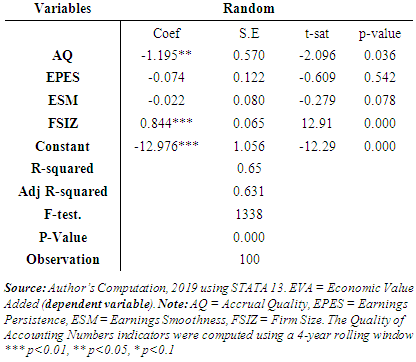
 Interpretation: Again, as in the results of the fixed effect model presented in Table 4 the F-Stat.= 1338.0; (P-value = 0.000) indicates that the quality of accounting numbers indicators with control variables are jointly statistically significant in explaining variances in economic value added (EVA). In addition, about 65.0% of changes in the EVA are jointly accounted for by the explanatory variables as evident in the R-squared value of 0.650. Furthermore, the coefficient of accrual quality (AQ) is negative (coef. = -1.195; P-value = 0.036) and statistically significant at 5% level. This means that a negative and significant relationship exists between accrual quality (AQ) and economic value added (EVA) at 5% level, indicating that a unit increase in Accrual Quality (AQ) causes value added (EVA) to decline by 1.195 units. Additionally, a unit change in each of AQ, EPES, and ESM will bring about a decrease of 1.195, 0.074, and 0.022 in EVA respective, while an increase FSIZ will bring about an increase of 0.844 and in EPS respective.The relationship that exists between earnings persistence (EPES) and economic value added (EVA) is not totally similar to that of AQ and EVA; this is evident in the coef. = -0.074 (P-value = 0.542). This result shows that earnings persistence (EPES) is not a determining factor of economic value added (EVA) during the period of this study. On the contrary, earnings smoothness (ESM) exhibits a negative and insignificant relationship with economic value added (EVA) within the 1% and 10% conventional level of significance; as evident in Coef. = -0.022 and P-value = 0.780. This also suggests that that earnings smoothness (ESM) is not a determining factor of economic value added (EVA) during the period of this study. Focusing on the control variable, the Firm Size (FSIZ) is positively and significantly related to economic value added (EVA), given the coefficient of 0.844 and P-value = 0.000). This suggests that firm size (FSIZ) is a contributing factor of economic value added (EVA) of the selected listed firms. Then again, it suggests that the bigger the firm the higher the economic value added (EVA). Discussion of Finding: The control variables of firm size revealed a positive significant relationship, which is consistent with the study of [52] investigated the impact of firm size, leverage, profitability, and liquidity on quality of Accounting Numbers and also the performance level of the quoted companies in Nigeria for the period covered. The study found a positive relationship between the quality of accounting numbers and firm size and leverage, profitability and liquidity of the selected quoted companies in Nigeria. Most empirical studies reported that economic value added had a positive effect on determining the created shareholders’ wealth [56] and [3]. On the contrary, this study result revealed a negative significant relationship of economic value added (EVA) on shareholders’ wealth, which could suggest that value creation and maximization and market efficiency fail to provide an expected explanation of management efficient assets utilization, organizational development and shareholders’ wealth growth.
4.3. Effects of Quality of Accounting Numbers on Earnings per Share
|
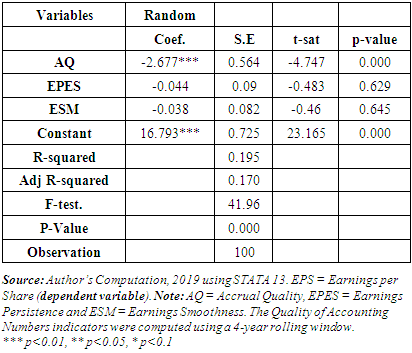
 In model 3, Table 5: The estimated coefficients indicate that accruals quality (AQ); earnings persistence (EPES) and earnings smoothness (ESM) are all negatively signed (β1 = -2.677; β2 = -0.044; β3= -0.038) < 0. These are not in consonance with a priori expectations. InterpretationFocusing on the selected random effect model in Table 5, the Wald – statistic value of 41.96 (P-value = 0.000) indicate that the quality of accounting numbers indicators are jointly statistically significant in explaining variations in earnings per share (EPS). Also, the coefficient of determination (Adj. R-squared) values is 0.17. This shows that the explanatory variables jointly explain about 17% of variations in EPS. These further confirm the fitness of the Random effect model and hereby interpreted. From Table 5, the result indicated that a unit change in each of AQ, EPES, and ESM will bring a decrease of 2.677, 0.044 and 0.0388 in EPS.Discussion of Findings: The inference from the result shows that the coefficient of Accrual quality (AQ) is negative (coef. = - 2.677; P-value = 0.000) and the negative coefficient is statistically significant at 1% level suggesting that accrual quality (AQ) has inverse relationship with earnings per share (EPS). This alternatively means that a unit increase in accrual quality (AQ) causes earnings per share (EPS) of the selected firms to reduce by 2.677 units. On the contrary, the coefficient of earnings persistence (EPES) is negatively but insignificantly related to earnings per share (EPS) (coef. = -0.044; P-value = 0.629) within the 1% and 10% level of significance. This implies that earnings persistence (EPES) does not have a significant relationship with Earnings per Share (EPS). Also, earnings smoothness (ESM) is insignificantly related to earnings per share (EPS) (coef. = -0.038; P-value = 0.645) of the listed firms. This suggests that earnings smoothness (ESM) is not a determinant of earnings per share (EPS) of the selected listed firms during the period of this study just like earnings persistence (EPES). The finding outcome of quality of Accounting Numbers having a negative significant relationship with earnings per share is consistent with the study of [53], who found a negative relationship with quality of accounting numbers with a firm’s under-investment in China. However, on the contrary, this study result is inconsistent with the study of [54] who found that quality of accounting numbers had a positive association between the quality of accounting numbers and investors’ decision in a study. Similarly, the study of [55], [21] found a positive significant relationship between quality of accounting numbers and investment in the listed and banking sector in Nigeria respectively.
4.4. Effects of Earnings Quality on Accounting Numbers with Control Variable of Firm Size
|
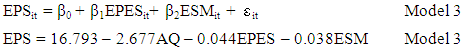
 In model 4, Table 6, the estimated coefficients indicate that accruals quality (AQ), earnings persistence (EPES) and earnings smoothness (ESM) are negatively signed (β1 = -1.023, β2 = -0.027, β3 = -0.061) < 0. These are not in consonance with expectations. However, firm size (FSIZ) is positively signed in line with the prior expectation of the study β4 = 0.688) > 0.InterpretationAccording to the results presented in Table 6 the random effect model which is the lead, the model has a Wald – statistic value of 486.1 (P-value = 0.000). This indicates that the quality of accounting numbers indicators and the control variables are jointly statistically significant in explaining variances in earnings per share (EPS). Besides, the R-squared value is 0.689 implying that the explanatory variables jointly account for about 68.9% of variances in EPS. These further confirm the fitness of the R and effect model. In addition, a unit change in each of AQ, EPES, and ESM will bring about a decrease of 1.023, 0.027, and 0.061 in EPS respective, while an increase FSIZ and will bring about an increase of 0.688 in EPS respective.Discussion of Findings: According to the result, the coefficient accrual quality (AQ) is negative (coef. = -1.023; P-value = 0.000) and statistically significant at a 1% level suggesting that Accrual Quality (AQ) is a driver of earnings per share (EPS) of the selected companies. Furthermore, it means that a unit increase in accrual quality (AQ) causes earnings per share (EPS) of the selected firms to decline by 1.023 units. Earnings persistence (EPES) is another indicator of the quality of accounting numbers, the coefficient of the indicator is also negative but statistically insignificant (coef. = -0.027; P-value = 0.714) suggesting that even when firm size (FSIZ) is included in our model, the coefficient of EPES is still insignificant. Furthermore, the coefficient of earnings smoothness (ESM) appears negative and statistically significant at 10% level, though weak (coef. = -0.061; P-value = 0.086). This means that ESM becomes significant after the inclusion of the selected control variables Firm Size (FSIZ). Alternatively, earnings smoothness (ESM) is seen as the determinant of earnings per share (EPS) of the selected listed firms when the firms’ characteristics are controlled for.Moving to the control variables, the coefficient of firm size (FSIZ) is a positive and significant coefficient at 1% level (Coef. = 0.688 and P-value = 0.000). This is an indication that increases in firm size (FSIZ) increases earnings per share (EPS). Alternatively, it means that a unit increase in firm size (FSIZ) leads to about 0.688 units increase in earnings per share (EPS).
 5. Conclusions, Recommendations and Contribution to Knowledge
- The study empirically investigated the effect of quality of accounting numbers on shareholders’ wealth maximization for investment decision in Nigeria. Economic value added (EVA) and earnings per share were employed as proxies of shareholders wealth maximization, while accrual quality, earnings persistence, and earning smoothing were chosen to measure the quality of accounting numbers. The results of the analysis revealed that the quality of accounting numbers had a positive statistically significant effect on shareholders' wealth maximization. Based on four models analysed, the quality of accounting numbers had a positive statistical effect on each of EVA and EPS. When a control variable of firm size was introduced, the quality of accounting numbers exerted a stronger positive statistical effect on each of EVA and EPS respectively.The study recommended that based on the finding that monitoring functions of the board should be intensified to enhance more accurate and transparent accounting numbers in financial reporting. There is dearth in the literature that had studied the quality of accounting numbers and shareholders wealth maximization, in addressing this gap, the originality of this study makes a contribution to knowledge in the Nigerian emerging literature by investigating the effect of quality of accounting numbers on shareholders wealth maximization for investment decisions.