-
Paper Information
- Paper Submission
-
Journal Information
- About This Journal
- Editorial Board
- Current Issue
- Archive
- Author Guidelines
- Contact Us
International Journal of Finance and Accounting
p-ISSN: 2168-4812 e-ISSN: 2168-4820
2019; 8(3): 80-87
doi:10.5923/j.ijfa.20190803.02

Does Exchange Rate Volatility cause Overreaction in the Capital Market? Evidence from Indonesia
 Abstract
 Reference
 Full-Text PDF
 Full-text HTML
Perdana Wahyu Santosa1, Pramesti Wulandari Santoso2
1Faculty of Economics and Business, University of YARSI, Jakarta, Indonesia
2Actuarial Consulting, PT Dayamandiri Dharmakonsilindo, Jakarta, Indonesia
Correspondence to: Perdana Wahyu Santosa, Faculty of Economics and Business, University of YARSI, Jakarta, Indonesia.
| Email: |  |
Copyright © 2019 The Author(s). Published by Scientific & Academic Publishing.
This work is licensed under the Creative Commons Attribution International License (CC BY).
http://creativecommons.org/licenses/by/4.0/

This article analyzes whether a market overreaction hypotheses imply short term abnormal return at the Indonesia Stock Exchange (IDX), during the high volatility of the IDR-USD exchange rate period. This study focuses on examining events relating to a dramatic substantial event about one year. Overreaction indicates a form of market efficiency, where the more frequent overreaction, the market tends to weaken or anomaly. During this period March 2018-March 2019, the value of IDR to the USD fluctuated by 7.78%, which caused the IDX Composite Index to meltdown (bearish) by 6,582 to 5,731 (-12.9%) and, reversed back an increase (bullish) until it hits 6,525. The research method used was quantitative research with purposive sampling. The sample used is LQ45 equity index stocks (blue chips). Overreaction analysis is grouped into two phases: (i) formation of a winner-loser portfolio; and (ii) testing portfolio overreaction. The findings obtained are that there are significant differences in all testing periods of 10 weeks, 20 weeks, 30 weeks, 40 weeks and 55 weeks. Conclusion: there is no overreaction at the beginning of the bearish and the end of the bullish period, however, it is found the consistency of investor behavior in momentum transactions when the market experiences both bearish and bullish condition. Throughout observation, the equity market shows a form of efficiency that is getting stronger and indicated that the momentum strategy more useful than a contrarian strategy to generated abnormal trading profit at IDX.
Keywords: Overreaction, Momentum, Exchange Rate, Abnormal, Winner-Losser, Contrarian
Cite this paper: Perdana Wahyu Santosa, Pramesti Wulandari Santoso, Does Exchange Rate Volatility cause Overreaction in the Capital Market? Evidence from Indonesia, International Journal of Finance and Accounting , Vol. 8 No. 3, 2019, pp. 80-87. doi: 10.5923/j.ijfa.20190803.02.
Article Outline
1. Introduction
- A recent survey of overreaction and reversal in the financial market study consistently demonstrates that the market environment is increasingly globally-interdependent. Additionally, overreaction investigations carried out when there is momentum or market timing is important because we can find market anomalies related to investors' responses to the entry of dramatic-substantial new information such as the high fluctuation of the exchange rate of the IDR-USD during March 2018-March 2019 caused by the Fed monetary policy which increased the interest rate. The high fluctuation of the IDR value causes the bearish/bullish of equity market composite index especially the blue chips LQ45 at the Indonesia Stock Exchange (IDX) due to capital flight by the foreign investor and global economic uncertainty. The fluctuation of the IDR-USD exchange rate in the March 2018-March 2019 period due to the Fed's benchmark interest rate increase, caused IDX Composite Index volatility to decrease sharply from 6,582 to 5,731 (-12.9%) - throughout March-October 2018. Bank of Indonesia responded to the fall of the IDX composite and LQ45 index by raising the BI rate to 125 bps and the market responded positively to the policy so that the IDR-USD exchange rate reversed and followed by the IDX Index. The IDX Composite Index has reversed and continues to increase (bullish) until it hits 6,525 (see Figure 1).
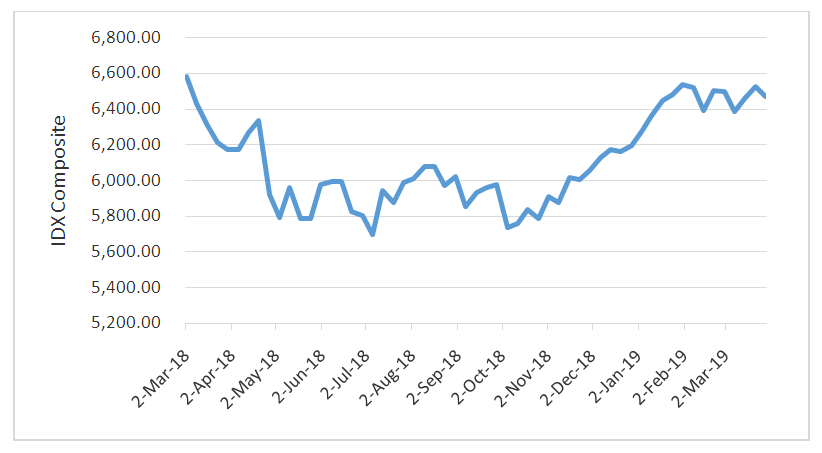 | Figure 1. The fluctuation of IDX Composite March 2018-March 2019 |
2. Literature Review
- Hypothesis Overreaction and Price ReversalThe phenomenon of overreaction repeatedly with consistent behavior in stock trading in the market. The impact of this overreaction causes the formation and movement of stock prices to be abnormal or mispricing and price reversals often occur due to price corrections (Santosa and Hosen, 2011). The excess reaction can be measured through the returns of actively traded shares on the stock exchange. Any securities (stocks) that are transacted excessively (overreaction) will create abnormal returns (abnormal returns) both positive and negative (Han et al. 2015). With the appearance of price correction causing price reversal, abnormal stock returns can be reversed from positive returns to negative within a certain period. Likewise, stocks with negative returns may change otherwise (Santosa & Hosen, 2011).Capital market anomalies are indicated by abnormal returns as an important sign of efficiency. The more abnormal returns accompanied by price reversal and overreaction, the weaker the shape of the market (Bodie et al. 2014; Santosa and Hosen, 2011). Anomaly is a condition that deviates and repeats consistently from the normal size of an efficient market. This is accompanied by the phenomenon of overreaction both when prices up or down (Santosa, 2011; Piccoli et al. 2017). According to several studies in the capital market, including the Indonesia Stock Exchange (IDX), related to financial behavior, several interesting phenomena were found. These phenomena can generally be categorized as abnormalities or deviations caused by several dramatic events or caused by the effects of the stock trading process (Madjid and Windasari, 2015).Santosa and Hosen (2011) explained that the price formation and price movement of shares are influenced by abnormalities that have occurred so far. Some abnormalities that often occur in the capital market are the January Effect, Holiday Effect, Week-End Effect, Size Effect, Monday Effect and Day of the Week Effect. Besides, the phenomenon that almost occurs continuously and consistently in the stock trading day is the phenomenon of overreaction caused by asymmetric information. The implication of the phenomenon of overreaction is the occurrence of deviations in the price of assets (shares) from their fair prices (fair value). Deviations that occur can be categorized into 2 (two) groups, namely overvalued and undervalued (Bodie et al, 2014; Santosa, 2011).Santosa (2011) argues that overvalued or undervalued stock prices from their fair values are considered to have undergone a deviant price formation process so that prices experience mispricing. In general, if most of the prices of shares with large market capitalization experience mispricing, the IDX capital market can be categorized as less efficient. De Bondt & Thaler (1985) stated that stocks that were previously highly sought after by investors after a certain period became less interested so that they experienced excess selling which caused the price to go down too deep and therefore undervalued. Conversely, stocks that were previously undervalued due to excessive negative valuations are targeted by investors. Thus the price has increased excessively (overvalued). Stock returns can be overturned due to the overreaction of trading actions. So that stocks with positive abnormal returns (winners) can turn negative (losers), and vice versa.Han et al. (2015) and Suciningtias (2010) explain that overreaction is a reaction that is contrary to normal conditions or at least a deviation. This hypothesis suggests that the securities that are categorized as the loser will have a high relative abnormal return. On the other hand, securities that are categorized as winners will get low abnormal returns (Howe, 2018).Howe (2018) found two overreaction phenomena: (i) Changes in the price of securities considered to be extreme will be followed by price changes in the opposite direction as well, (ii) if the greater the price movement, the greater the price correction occurs as a consequence. This phenomenon psychologically sees that more dramatic people react to bad news and will make corrections in the next period. Overreaction was found only in the loser group, not the winner group. If the market overreacts then price reversals should be predictable from past performance (Santosa, 2011; Choudary and Sethi, 2014).The phenomenon of price reversal is also influenced by market microstructure factors and intraday trading by investors. In addition, the explicit rules of each market also affect the formation of asset prices (Boussaidi, 2013; Santosa, 2011). Price reversal is influenced by the overreaction of the investors themselves in responding to information/news entering the market, especially if the information is considered bad news. If the information/news is valued more than its fair value (intrinsic value) then a price reversal will soon occur because the asset will look for its fair value (Santosa and Hosen, 2011). This process causes asset prices in the capital market to continue to fluctuate and even deviate from normal conditions consistently.Boussaidi's findings (2017) the anomaly of the loser and the winner or loser anomaly based on the phenomenon of overreaction in the capital market. They argued that stock portfolios that showed extreme positive (winner) or extreme negative return (loser) returns during a certain period would have reversed the level of stock returns in the next period. Loser stock portfolio will show a positive return that outperformed the previous winner's portfolio, and vice versa. In this phenomenon, smart investors can exploit it by buying loser stocks and instead deciding the short sales action on winner shares periodically. By taking action to buy and short sales, investors have the opportunity to get a large abnormal return (Choudary and Sethi, 2014; Mun, 2000).In accordance with psychological theory, which states that loser shares are representative issuers with negative information content some time ago, which investors favored because they were undervalued (Lerskullawat & Ungphakorn 2015). Vice versa, the winner shares that are considered investors are too high so that they are overvalued and are no longer compatible with the positive information they contain. So there was a process of reversing the yield from loser shares to winners and vice versa at certain periods consistently. In general, the market tends to react dramatically to bad news so that the large value of shares is too low (Howe, 2018; Santosa, 2011; Spyrou et al. 2007).Equity market movements are sometimes too high compared to price fluctuations on other days. If there is an extreme daily movement representing rational or efficient behavior in response to information content or relevant events in the market. This situation does not provide opportunities for abnormal profits in the following days. However, if the market moves inefficiently, any extreme price fluctuations provide an opportunity for abnormal returns if overreaction through a momentum strategy. Conversely, if the market response is underreaction, the abnormal return is obtained from the contrarian strategy (Picoli et al. 2017; Baule and Tallay, 2014).Research Hypothesisa. Hypothesis of ReversalThe reversal (reversal) for the shortest testing period is 10 weeks and the longest testing period for 55 weeks against the winner and loser portfolio. The Portfolio winner (abnormal positive return) will change to the loser (negative abnormal return) if overreaction occurs.b. Hypothesis of MomentumHypothesis testing of the momentum is carried out for the winner-loser portfolio for the period between the shortest and the longest, which is 20 weeks; 30 weeks and 40 weeks. Portfolio winners will not turn into losers, there will be underreaction in the capital market or momentum.
3. Data and Method
- The data that will be used in this study are secondary (historical) quantitative data recorded on the IDX for weekly trading transactions (weekly trading) in the form of the IDX Composite Index; LQ45 Index during the period March 2018-March 2019. While the required data is the closing price of each trading week end that occurred during the study period.The population studied is stocks listed in the LQ45 Index for the period March 2018-March 2019. The research sampling was conducted using the "positive sampling" method. The reasons for determining the LQ45 index stock sample are 1). It has a relatively large market capitalization; 2) the LQ45 index is known as leading stocks; 3) The LQ45 index is known as the index movers for IDX Composite and 4). LQ45 shares are known as liquid shares and 5). To be a representation of BEI's market performance so far. The sample used must meet the criteria with the following characteristics:a. The number of stock samples/issuers is 45 sample shares for the LQ45 index listed on the Indonesia Stock Exchange in the period March 2018-March 2019.b. Weekly IDX Composite Index (IDX CI) and weekly Individual Share Price Index (ISPI) during the study period, March 2018-March 2019. The data obtained from IDX.In order to meticulously the overreaction effect or reversal effect in the Indonesian Stock Market, Five formation periods will be considered to analyse the past performance of stock: (1) the formation period of the winner-loser portfolio during the first 10 weeks, (2) the 20-week testing period; (3) 30-week testing period; (4) the testing period is 40 weeks and (5) the testing period is 55 weeks.Phase I: Formation of the Winner-Loser Portfolio1. Ensure that all LQ45 index shares registered during the study period March 2018-March 2019. New shares listed during the study period can only be analyzed for the next analysis period. Conversely, if there are delisted LQ45 shares, they will be excluded from the analysis in the next period.2. Calculating the returns of each i-stock, listed on the LQ45 index with a weekly period. If at the time of the calculation there are sample shares that are not transacted, the last transaction share price will be used according to the formula:
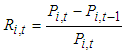 | (1) |
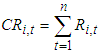 | (2) |
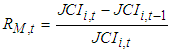 | (3) |
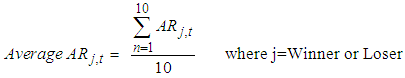
 , is the equal weighted return of all stock in the market.3. Calculate the abnormal return of each winner stock (ARW,t) and each loser stock (ARL,t) in each predetermined testing period.
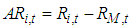 | (4) |
 | (5) |
 | (6) |
 | (7) |
4. Emiprical Results
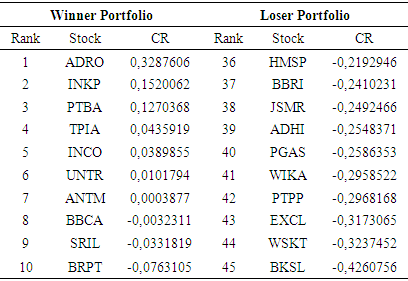
- Phase I: Winner and Loser Portofolio of LQ45 IndexTable 1 shows the cumulative return (CR) of LQ45 stocks is not good because most CR stocks are negative because the market experienced a short bearish during March 2018-March 2019 or around 55 weeks. This was caused by the fluctuation of the stock index, both the Jakarta Composite Index and LQ45, which was relatively large due to the exchange rate volatility. The IDR-USD exchange rate experienced a significant decline of up to 10% from March-October 201, which caused the JCI to drop from 6,582 (2 March 2018) to 5,731 (5 October 2018).Data analysis was continued with the formation of winner and loser portfolios with the cumulative return (CR) ranking method of LQ45 issuers during March 2018-March 2019. The ranking was carried out to get 10 winner issuers with the highest CR and 10 loser issuers with the lowest CR of the 45 analyzed shares. The analysis results look like in Table 1 below.
|
|
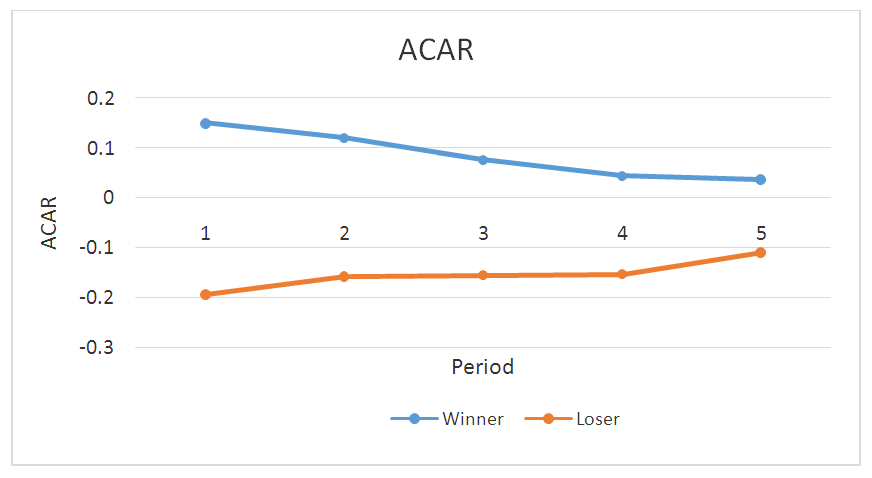 | Figure 2. Average Cumulative Abnormal Return of Winner and Loser Portfolio |
5. Discussions
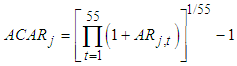
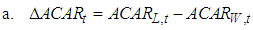
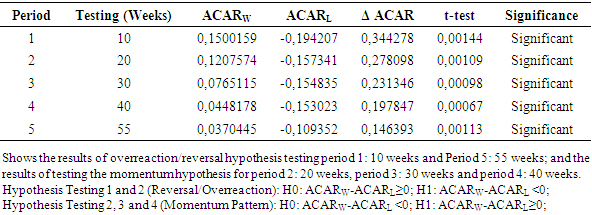
- Hypothesis 1: There is a Overreaction Pattern in Period 1The reversal pattern generally occurs in the shortest period (Period 1) and/or the longest period of testing (Period 5) where there is a reversal in the price of shares that were previously good performers (winners) reversing into poor performers (losers), or vice versa (Santosa, 2011). Based on the results of the 1: 10-week reversal test in Table 3, it appears that the difference in Average Cumulative Abnormal Return (ΔACAR) between the ACARW portfolio and ACARL shows the result of 0.344278, which means there is no reversal pattern (overreaction). Based on testing the significance shows that the p-value 0.00144 <0.05, which means significant. Thus it was found that in the first 10 weeks period there was no overreaction caused by the investor in the first 10 weeks in responding to bad information related to the depreciation of the IDR-USD exchange rate due to the Federal Reserve Bank's monetary policy which raised interest rates. This finding is different from the hypothesis and some other studies such as Julianti (2016); Ramzi (2013) and Wu (2011).Hypothesis 2: There is a Momentum Pattern in Period 2To test the pattern of momentum in the capital market in general it is found in the longer term because the momentum occurs when stocks that have good performance (winner) can maintain their performance until the next testing period as a winner portfolio. Likewise also for stocks that are not performing well (losers) will continue to perform poorly until the next testing period (Jagadesh and Titman, 1993; Santosa and Hosen, 2011; Boussaidi, 2017). The test results found that the ΔACAR difference between the ACARW and ACARL portfolios showed a value of 0.289, it showed the formation of a momentum pattern. Significance test results show that p-value 0.00109 <5%, means that the momentum pattern is significant. Thus there was a pattern of continued momentum from period 1 to period 2 in which investor behavior remained consistent following the declining momentum of the LQ45 stock index.Hypothesis 3: There is a Momentum Pattern in Period 3The momentum pattern was tested in period 3 (30 weeks) to see the consistency of investor behavior in trading during the bearish period caused by the Fed's policy of raising its benchmark interest rate. This 3rd period of share price decline is deeper than the previous two periods. The analysis showed that ΔACAR difference between ACARW and ACARL portfolios showed a value of 0.231346, it showed the formation of a momentum pattern. Significance test results showed a p-value of 0,00098 <5%, which means significant. However, ΔACAR is smaller than the two previous periods which shows the consistency of the momentum pattern is starting to decrease. The reduced pattern of momentum is caused by investor doubt about the intrinsic value of shares affected by the decline in the IDR exchange rate. These findings are in-line with the findings of Santosa (2011), Han et al. (2015) Julianti (2016).Hypothesis 4: There is a Momentum Pattern in Period 4From the analysis of Table 3, it is shown that ΔACAR which is the difference between the ACARW and ACARL portfolios shows the value of 0.197847, which positively shows the formation of momentum patterns. The significance test results show that the p-value is 0.00067 <5%, which means that the period 3 momentum pattern is significant. However, the value of ΔACAR is smaller than the previous three periods which shows the consistency of the momentum pattern decreases because the value of ΔACAR is getting smaller. If the value is negative, the momentum pattern changes to a reversal pattern. The reduced pattern of momentum is caused by investors' growing doubts about the intrinsic value of shares affected by the decline in the IDR exchange rate. But BI's quick and precise response slightly reduced investors' doubts. These findings are in-line with the findings of Piccoli et al. (2017), Han et al. (2015) and Julianti (2016).Hypothesis 5: There is a Momentum Pattern in Period 5Testing Period 5 (55 weeks) to prove whether there is overreaction behavior among investors at the end of the observation period. The ΔACAR period 5 value decreases but is still recorded positive 0.146393, this shows that the pattern of overreaction does not occur. Significance test results show that the p-value is 0.00067 <5%, which means that the period 3 momentum pattern is significant. In this period 5, what happens is that the momentum pattern continues the momentum pattern of the previous 4 periods. Figure 3 shows the ΔACAR between the winner and loser portfolio is getting smaller, which indicates a higher consistency of reversal/overreaction probability.
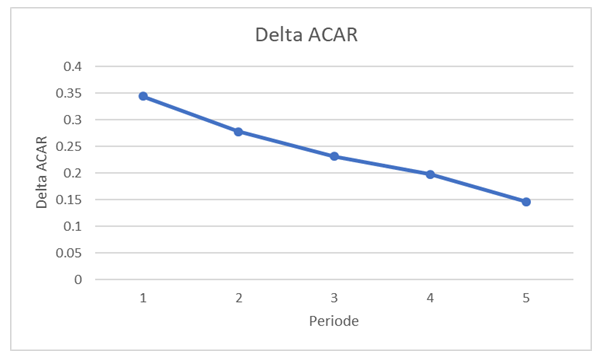 | Figure 3. Delta ACAR Winner-Loser Portfolio |
6. Conclusions
- When the market equity index goes down (bearish) then up (bullish) in the short term generally there is a reversal or overreaction, but in testing, about 55 weeks can not be found on the IDX. Testing the winner and loser portfolio did not find any reversal or overreaction at the beginning of the bearish and initial bullish. This shows that financial behavior on the IDX shows good consistency in-line with its momentum. Then momentum testing is carried out for the winner and loser portfolio showing in-line behavior or supporting the consistency of the winner and loser portfolio from the initial bearish to the initial bullish return. Three times the test found significant consistency momentum behavior in the bearish and bullish market condition. This was not consistent with the overreaction hypothesis. Although the ΔACAR decreased gradually as the testing period become longer, there was no evidence of overreaction. Interestingly, this significant period with dramatic information about the exchange rate depreciation. It can be concluded that the behavior of IDX investors has become increasingly responsive to the entry of dramatic and substantial news, but remains consistent in market momentum and does not experience reversal and overreaction related to the depreciation of the IDR-USD exchange rate. The consistency of the winner and loser portfolio is influenced by a variety of factors, in addition to the increasingly strong form of market efficiency, namely the response of the central bank, the Bank of Indonesia, which is very reactive in raising the BI rate to more than 100 basis points to reduce capital flight flows. Nevertheless, the stock market index reaction would also be caused by other factors. As a consequence, the investor will take this opportunity to make gains (or losses) from their investment due to significant volatility of stock prices. By testing stock price overreaction in the Indonesia capital market, some previous studies allowed that momentum strategy is applied to short-term trading/investments, whereas contrarian strategy may be preferable in the longer term. Finally, we concluded in the study period, or short term volatile period, investors or traders in the Indonesian equity market are advised to use a momentum strategy to produce an abnormal return rather than a contrarian strategy.
7. Limitations and Avenue for Future Research
- There are two limitations that occurred in this research. First, the convenience sampling method used in this study may preclude research findings from being specified of the part population (LQ45 index) at Indonesia Stock Exchange (IDX). So, future research should use these results with caution when investigating issues related to overreaction behavior and related to market efficiency form. More generalized studies of IDX overreaction and reversal must be done to confirm and expand these findings.Second, although two unproven hypotheses are found, namely H1 and H5 which indicate that the reversal or overreaction did not occur at the beginning and end of the bullish and bearish situation, these findings are different from some of the previous studies. For this reason, it needs to be re-examined by adding the test period and involving other equity indexes.
ACKNOWLEGEMENTS
- This research has been made possible by research funding from the School of Graduate Studies Program in Master of Management and LPPM University of YARSI, in the fiscal year 2018.