-
Paper Information
- Paper Submission
-
Journal Information
- About This Journal
- Editorial Board
- Current Issue
- Archive
- Author Guidelines
- Contact Us
International Journal of Finance and Accounting
p-ISSN: 2168-4812 e-ISSN: 2168-4820
2019; 8(2): 65-71
doi:10.5923/j.ijfa.20190802.03

Effects of Capital Market Components on Economic Growth in Nigeria: A Cointegrating Regression Approach
 Abstract
 Reference
 Full-Text PDF
 Full-text HTML
Chijioke N. Ofurum 1, Odunayo J. Ogunyemi 2, Joy C. Madumere 2, Marvis N. Okolo 1
1Department of Accountancy, University of Nigeria, Enugu, Nigeria
2Department of Accountancy, Imo State University, Owerri, Imo, Nigeria
Correspondence to: Chijioke N. Ofurum , Department of Accountancy, University of Nigeria, Enugu, Nigeria.
| Email: |  |
Copyright © 2019 The Author(s). Published by Scientific & Academic Publishing.
This work is licensed under the Creative Commons Attribution International License (CC BY).
http://creativecommons.org/licenses/by/4.0/

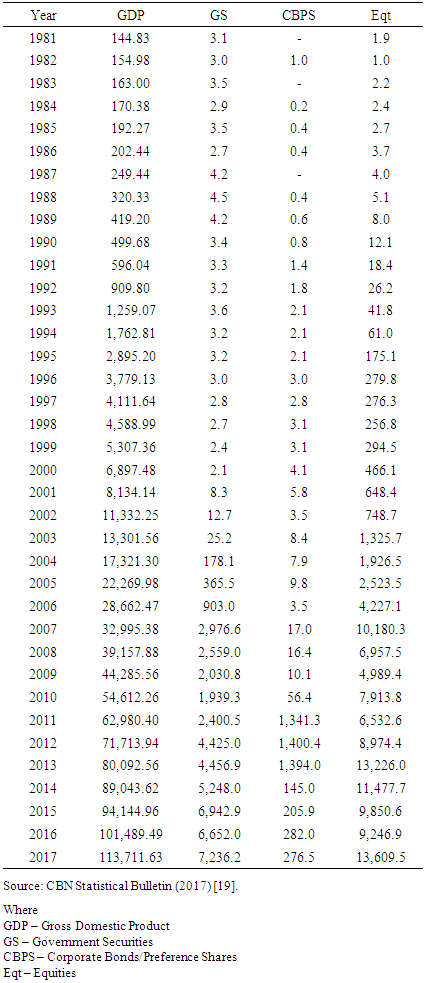
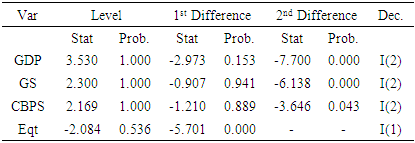
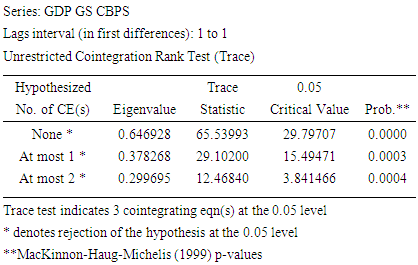
This study examined the existence of long-run association between capital market components and economic growth in Nigeria between 1981 and 2017. Data were sourced from Central Bank of Nigeria Statistical Bulletin. GDP was used as proxy for economic growth while government securities (GS), corporate bond/preference shares (CBPS), and equities (EQT) where proxies for capital market components. The study also established the direction of causal relation between the variables. A Cointegrating regression approach was adopted for analysis. Other econometric tests such as stationarity test, Johansen test of cointegration and Granger causality test were also conducted. In the cointegration model, we placed GDP as the endogenous variable while capital market components served as the exogenous variables. The stationarity test shows that GDP, GS and CBPS were stationary at second order while EQT was stationary at first order, hence its removal from the cointegration test. Johansen test indicates three cointegrating equations using unrestricted cointegration rank test (Trace). The findings from canonical cointegrating regression technique further confirm the existence of a long-run relationship between GDP, GS and CBPS. More so, on the direction of causal relation, we found no homogeneity among the variables. GDP has a unilateral causal relationship with GS and EQT which flows GDP; while CBPS and GDB has a bilateral causal relationship. The study recommends that government should increase the amount of securities they issue in the market as its increase will positively and significantly improve the overall economic growth of the country.
Keywords: Capital Market Components, Cointegration, Economic Growth, Granger Causality
Cite this paper: Chijioke N. Ofurum , Odunayo J. Ogunyemi , Joy C. Madumere , Marvis N. Okolo , Effects of Capital Market Components on Economic Growth in Nigeria: A Cointegrating Regression Approach, International Journal of Finance and Accounting , Vol. 8 No. 2, 2019, pp. 65-71. doi: 10.5923/j.ijfa.20190802.03.
Article Outline
1. Introduction
- A capital market is a financial market in which long-term debt (over a year) or equity-backed securities are bought and sold. It is a network of financial and non-financial institutions that interact to mobilize and allocate long-term funds in the economy. Capital markets channel the wealth of savers to borrowers who can potentially put it to long-term productive use, such as companies or governments making long-term investments. It is a market where instruments such as equity (also called common stock), preference shares, derivatives, and debt instruments are being traded.Capital market was established in Nigeria as Lagos Stock Exchange in 1960, and was later renamed the Nigerian Stock Exchange (NSE) in 1977. Nigeria Stock Exchange has 163 listed securities with total market capitalization of 16.2 trillion Naira according to Security and Exchange Commission (SEC) (2017) [1]. According to World Federation of Exchanges database (2016) [2], Nigeria’s market capitalization ranks 56th based on world rating and 4th largest stock exchange in Africa following South Africa, Morocco, and Egypt. South Africa has remained the leading African country in terms of market capitalization, economic growth (Gross Domestic Production) and other macroeconomic indicators. In 2016, its market capitalization stood at 951.3 billion dollars, followed by Morocco with 57.5 billion dollars, Egypt (33.3 billion dollars), and then Nigeria (29.7 billion dollars). South Africa was ranked the 13th country with the highest market capitalization in the world ahead of other developed nations such as Netherlands, Brazil, Spain, Russia, etc. United States had the largest market capitalization (27,352.2 billion dollars), followed by China and Japan with 7,320.7 billion dollars and 4,955.3 billion dollars, respectively.Nigeria’s market capitalization has been experiencing fluctuations since the last two decades with an upward (positive) trend. The trend consistently increased from N662.6 billion in the year 2001 to N5.1 trillion in 2006. From 2006 to 2007 its market capitalization increased to 13.2 trillion before plunging to N9.6 trillion and N7.0 trillion in 2008 and 2009 respectively. In 2013 the county’s market capitalization got to its all-time level of N19.1 trillion before experiencing downward fluctuations. From 2014 to 2016, total market capitalization has been fluctuating between N16.2 trillion to N17.0 trillion with the lowest figure (N16.2 trillion) observed in 2016 (Security and Exchange Commission, 2017) [1].Nigeria’s market capitalization is divided into four components: Government securities, Corporate Bonds/Preference Stocks, Equities, and Exchange-Traded Funds (ETF). Equities dominate the Nigerian market capitalization followed by government securities and corporate bonds/preference stocks. Exchange-traded funds (ETFs) were introduced in 2012 with a total market capitalization on N1 billion. According to SEC (2017) [1], the ETF accounts for N4.8 billion (0.02 per cent) of Nigeria’s total market capitalization of N16,185.7 billion; corporate bonds/preference stocks, N282.0 billion (1.7 per cent), government securities, N6,652.0 billion (40 per cent), while equities were N9,246.9 billion (57 per cent).Since the past three decades, the relevance of capital market as one of the nation’s determinants of economic growth has captured the interest of economic and financial research. While recent studies, such as Chirwa and Odhiambo, (2016) [3], Utile, Okwori, and Ikambese (2018) [4], have argued that foreign direct investment, demography, exchange rate, inflation rate, gross fixed and capital formation are major growth determinants of the economy, others such as Uwakaeme (2015) [5] and Nordin and Nordin (2016) [6] have argued that the size of market capitalization of a nation offers a significant explanation about its growth and should not be overlooked when forming an economic growth model.
1.1. Motivation for the Study
- Empirical findings have shown that market capitalization, amongst other variables, was seen to be significantly related to economic growth of the nation (Uwakaeme, 2015) [5]. However, two unexplored areas are: (i) the existence of a long-run relationship between economic growth and capital market components; and (ii) the direction of causal relationship between the two variables. The basic idea is that if, in the long run, two or more series move closely together, even though the series themselves are trended, the difference between them is constant.The following hypotheses, stated in the null form, are formulated to guide the study.H01: There is no significant long-run relationship between Government securities and gross domestic product (GDP) in Nigeria.H02: There is no significant long-run relationship between corporate bonds/preference stocks and Nigeria’s GDP.H03: There is no significant long-run relationship between equities and Nigeria’s GDP.H04: There is a causal relationship between GDP and capital market components in Nigeria.The remaining part of this paper is divided into four sections, after this Introduction as Section one. Section two reviews the relevant literature: conceptual, theoretical and empirical. Section three presents the research methodology. Data presentation, analysis and discussion of results are done in section four. Section five concludes the study with some recommendations.
2. Literature Review
2.1. Capital Market
- A capital market is the part of a financial system in which corporate bonds, preference stocks, equity, government securities and other long-term investments are traded. This conceptual perspective is shared by O'Sullivan and Sheffrin (2003) [7], Al-faki (2006) [8] and Ekezie (2002) [9]. Capital markets channel the wealth of savers to those who can put it to long-term productive use, such as companies or governments making long-term investments.A capital market can be either a primary market or a secondary market. In primary markets, new stock or bond issues are sold to investors, often via a mechanism known as underwriting. The main entities seeking to raise long-term funds in the primary capital markets are governments (local, state or federal) and business organizations. The secondary market is the financial market where investor can purchase stocks from a fellow investor and not directly from the corporations issuing the firm.It is important to also note that regular bank lending is not usually classed as a capital market transaction, even when loans are extended for a period longer than a year. O’Sullivan and Sheffrin (2003) [7] argued that first, regular bank loans are not securitized (i.e. they do not take the form of a resalable security like a share or bond that can be traded on the markets). Second, lending from banks is more heavily regulated than capital market lending. Third, bank depositors tend to be more risk-averse than capital market investors. These three differences all act to limit institutional lending as a source of finance. Two additional differences, this time favouring lending by banks, are that banks are more accessible for small and medium-sized companies, and that they have the ability to create money as they lend. In the 20th century, most company finance apart from share issues was raised by bank loans. But since about 1980 there has been an ongoing trend for disintermediation, where large and creditworthy companies have found they effectively have to pay out less interest if they borrow directly from capital markets rather than from banks. According to Lena (2009) [10], capital markets overtook bank lending as the leading source of long-term finance in 2009, which reflects the risk aversion and bank regulation in the wake of the 2008 financial crisis.
2.2. Economic Growth
- According to International Monetary Fund (2002) [11] Economic growth is the increase in the inflation-adjusted market value of the goods and services produced by an economy over time. It is conventionally measured as the percent rate of increase in real gross domestic product, or real GDP. Therefore, for the purpose of this study, GDP shall be used as the proxy for economic growth. The Organisation for Economic Co-operation and Development (OECD) (2017) [12] defines GDP as "an aggregate measure of production equal to the sum of the gross values added of all resident and institutional units engaged in production (plus any taxes, and minus any subsidies, on products not included in the value of their outputs). Ofurum, Amaefule, Okonya and Amaefule (2018) [13] defined Gross domestic product as a monetary measure of the market value of all final goods and services produced in a period. Coyle (2014) [14] states that "GDP measures the monetary value of final goods and services - that is, those that are bought by the final user - produced in a country in a given period of time. GDP is considered the "world's most powerful statistical indicator of national development and progress. The thrust of this study is to examine the existence of Cointegrating relationship between market capitalization components and GDP.
2.3. Empirical Review
- So many empirical studies have been carried out within and outside the country on capital markets and its effect on economic growth such as Atoyebi, Ishola, Kadiri, Adekunjo and Ogundeji, (2013) [15], Afolabi (2015) [16], Odo, Anoke, Onyeisi and Chukwu (2017) [17], Nieuwerburgh, Buelens and Cuyvers (2005) [18] etc.Atoyebi, Ishola, Kadiri, Adekunjo and Ogundeji, (2013) [15] used a secondary data from the period 1981 to 2010 to determine the impact of capital market on economic growth in Nigeria. The study made use of an econometric model with gross domestic product as the dependent variable and market share index, market capitalization, and number of deals transacted as the independent variables. Findings based on Johansson co-integration technique and vector auto regression suggest three co-integrating equation at 5% level of significant while the vector auto regression suggest the existence of long run relationship between stock market and reel GDP.Afolabi (2015) [16] examined the impact of the Nigerian capital market on the economy from 1992 to 2011. Market capitalization was used as the dependent variable while Gross Domestic Product, Inflation Rate, Foreign Direct Investment, Total New Issue, Total Trade Value and Total Number of Listed Companies were used as the independent variable. Evidence from the study shows that Market Capitalization does not have significant effect on Gross Domestic Product, Inflation Rate, Foreign Direct Investment, Total Number Listed and Total Trade Value. However, Market Capitalization was seen to have a significant positive effect on total number of new Issue. The study concludes that Nigerian capital market does not really have a significant impact on the economy.Nieuwerburgh, Buelens and Cuyvers (2005) [18] employed Johanson co-integration model to investigate the long-term relationship between financial market development and economic development in Belgium using stock market development indicators from the period 1873 to 1935. Their analysis shows that the financial market development substantially affected the economic growth of Belgium with strong emphasis on the stock market. They also noted that institutional and policy changes affecting the stock exchange were responsible for the time–varying nature of the relationship between stock market development and economic growth.Odo, Anoke, Onyeisi and Chukwu (2017) [17] jointly carried a study on ‘Capital Market Indicators and Economic Growth in Nigeria: An Autoregressive Distributed Lag (ARDL) Model’ with data from SEC and CBN over the period, 1986 to 2016. The result of the ARDL showed that, in the short run, market capitalization has a positive significant relationship with economic growth, while stock traded total value indicated a negative insignificant link with economic growth. The results further showed that, in the long-run, both market capitalization and stock traded total value had an insignificant negative link with economic growth.
3. Data and Methods
3.1. Data
- Data on capital market components, such as: Government Securities, Corporate Bonds/Preference Shares, Equities were obtained from Central Bank of Nigeria Statistical Bulletin between 1981 and 2017. Also, data on GDP was sourced as proxy for economic growth, were sourced for this study. Exchange Traded Fund was excluded because its number of observations is less than twenty (20) which did not meet the requirement for a long-run test.
3.2. Methodology
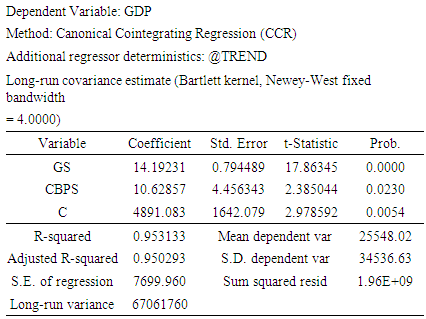
- This study adopted the cointegrating regression method of data analysis. Cointegration is a statistical test used in detecting the existence of long-run equilibrium relationship between two variables. Cointegration is said to exist between two or more non-stationary time series if they possess the same order of integration and a linear combination of these series is stationary. Specifically, Canonical Cointegrating Regression (CCR) was used for the cointegration test. The CCR is closely related to fully modified OLS (FMOLS), but instead employs stationary transformations of the
 data to obtain least squares estimates to remove the long run dependence between the cointegrating equation and stochastic regressors innovations (Eviews 10, 2017) [20]. Like FMOLS, CCR estimates follow a mixture normal distribution which is free of non-scalar nuisance parameters and permits asymptotic Chi-square testing (Eviews 10, 2017) [20].
|
3.2.1. Test of Stationarity
- According to Nau (2019) a stationary time series is one whose statistical properties such as mean, variance, autocorrelation, etc. are all constant over time. Most statistical forecasting methods are based on the assumption that the time series can be rendered approximately stationary (that is, "stationarized") through the use of mathematical transformations. This is because a stationarized series is relatively easy to predict: you simply predict that its statistical properties will be the same in the future as they have been in the past (Nau, 2019) [21]. Prior to the test of cointegration, we deemed it necessary to examine the appropriateness of the series properties for such test by ensuring that the series are integrated of the same order. The Augmented Dickey Fuller (ADF) unit root test was applied (Dickey and Fuller, 1979) [26]. The assumption is that the time series used for this research have unit root stochastic process, represented as follows:
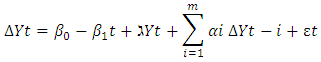 Where Y is the single time series for GDP, GS, CBPS and Eqt under investigation, β is the parameter coefficient, ﻉt is the pure white noise error term, αi and גּ are coefficients of the lag terms and m is the length of the lag terms which is automatically selected using Akaike information criteria. If ‘גּ’ is 0, then there is unit root, but if it is less than zero (negative), the null hypothesis is rejected and the alternative that the series is stationary is accepted.
3.2.2. Test of Autocorrelation
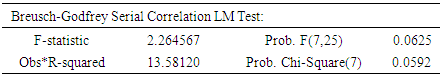
- One of the key requirements in regression model test is to verify the presence or others autocorrelation. The presence of autocorrelation shows that the residuals are serially correlated and the model should be adjusted before using it for hypothesis tests. According to Cengage (2019) [22] autocorrelation also called serial correlation occurs when the error term observations in a regression are correlated. This error term represents a random “shock” to the model, or something that is missing from the model. It actually means the difference between the model results and the result that would have been gotten in the real world scenario. Breusch-Godfrey Serial Correlation LM Test was adopted for the study. The null hypothesis of the test is that there is no serial correlation in the residuals up to the specified order.
3.2.3. Heteroscedasticity Test
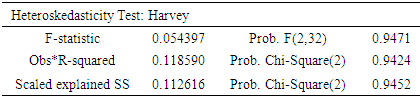
- Heteroscedasticity is simply the absence of Homoscedasticity, this implies that all its random variables do not have the same finite variance. In the use of ordinary least square regression analysis the existence of heteroscedasticity is a major concern because one of the requirements of the linear regression model is absence of heteroscedasticity. Heteroscedasticity does not cause ordinary least squares coefficient estimates to be biased, although it can cause ordinary least squares estimates of the variance (and, thus, standard errors) of the coefficients to be biased, possibly above or below the true or population variance. Thus, regression analysis using heteroscedastic data will still provide an unbiased estimate for the relationship between the predictor variable and the outcome, but standard errors and therefore inferences obtained from data analysis are suspect (Wikipedia, 2019) [23]. The Harvey (1976) [24] test for heteroskedasticity was adopted in this study. Harvey tests a null hypothesis of no heteroskedasticity against heteroskedasticity of the form of:
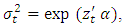 where, again zt, is a vector of independent variables.
3.2.4. Test of Causality
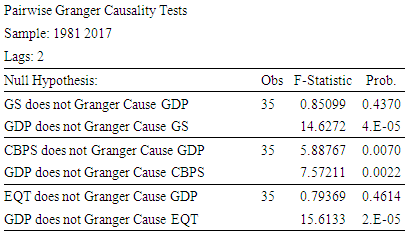
- Granger causality test is a statistical test that ascertains the ability of one time series to predict another in the future. Granger (1969) [25] argued that causality in economics could be tested for by measuring the ability to predict the future values of a time series using prior values of another time series. The essence of this test is to know which variable drives which (unilateral causality) or if both economic growth and capital market components have the abilities to drive each other (bilateral causality). E-views runs bivariate regressions of the form
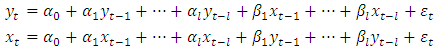 Where Y and X represent GDP and GS, CBPS & Eqt. The null hypothesis is that X does not Granger-cause Y in the first regression and that Y does not Granger-cause X in the second regression. If the two probabilities are significant, then there will be a reserve causality (two-way causation). The decision rule for causality is to reject the null hypothesis of no causality if the probability value is less than 0.05.
4. Results and Discussion
- This section presents results of the models specified above and relevant findings from the analysis. Table 2(a,b,c) below shows the summary of the result from unit root test.
|
|
|
|
|
|
5. Conclusions
- This study discussed the existence of long-run association between capital market components and economic growth. In this study, we tested the existence of long-run relationship between capital market components and government securities, corporate bonds and preference shares, equities and gross domestic product. The study also tested the direction of causality in the relationship. Our findings showed the existence of a significant long-run relationship between government securities, corporate bond/preference shares and gross domestic. However, there was no evidence of long-run association between equities and GDP. On the direction of causal relationship between the variables, government securities and equities exhibited a unilateral relationship with gross domestic product with the force flowing from GDP. Whereas GDP and CBPS had a bilateral relationship, though the direction of causality is stronger from GDD to CBPS.The findings of this study lend themselves to the following recommendations:Ÿ Government should increase the amount of securities they issue in the market as its increase will positively and significantly improve the overall economic growth of the country.Ÿ Capital market regulators should try and maintain the confidence of investors in the market so as to ensure a continued patronage by showing true commitment and sincerity of purpose in the capital market probe, which will in turn increase the country’s economic growth.