-
Paper Information
- Paper Submission
-
Journal Information
- About This Journal
- Editorial Board
- Current Issue
- Archive
- Author Guidelines
- Contact Us
International Journal of Finance and Accounting
p-ISSN: 2168-4812 e-ISSN: 2168-4820
2018; 7(4): 122-131
doi:10.5923/j.ijfa.20180704.04

Effects of Firm Level Attributes on Stock Returns in Nigeria
Akwe James Ayuba1, Garba Salisu Balago2, Dang Yohanna Dagwom3
1Securities and Exchange Commission, Abuja, Nigeria
2Central Bank of Nigeria, Abuja, Nigeria
3Plateau State Internal Revenue Service, Jos, Nigeria
Correspondence to: Akwe James Ayuba, Securities and Exchange Commission, Abuja, Nigeria.
| Email: |  |
Copyright © 2018 The Author(s). Published by Scientific & Academic Publishing.
This work is licensed under the Creative Commons Attribution International License (CC BY).
http://creativecommons.org/licenses/by/4.0/

This study set out to examine the effects of firm level attributes on stock returns of top twenty-five most capitalized quoted equity firms in Nigeria. Emerging markets have different structure and institutional characteristics from developed stock markets, and in view of the fact that investors are interested in getting more insights into the activities of blue chip companies, it is imperative to find out whether stock returns in Nigeria respond differently to effects of firm level attributes factors or not. Hence, the study investigated the effects of firm size, ratio of market to book value per share, and price to earnings ratio on stock returns of selected quoted firms in Nigeria from 2007 – 2016. The population comprises top twenty-five most capitalized quoted equity firms, out of which twenty-one companies represent the sample of the study. The study adopted ex-post facto research design. The study used secondary data obtained from the audited accounts of the sampled firms, Central Bank of Nigeria Statistical Bulletin and the Nigerian Stock Exchange database and website. Analysis of data was carried out using panel data regression. The panel regression results indicate significant positive effect between ratio of market to book value per share and stock returns in Nigeria, and insignificant negative effect between firm size and stock returns in Nigeria. A further regression result indicates insignificant positive effect between price to earnings ratio and stock returns of selected quoted companies in Nigeria. The study recommends among others, monitoring and surveillance by the Securities and Exchange Commission, careful use of market to book value per share ratio by investors, determination of correct and comparable earnings per share by investors and investment analysts.
Keywords: Firm size, Ratio of market to book value per share, Price to earnings ratio, and stock return
Cite this paper: Akwe James Ayuba, Garba Salisu Balago, Dang Yohanna Dagwom, Effects of Firm Level Attributes on Stock Returns in Nigeria, International Journal of Finance and Accounting , Vol. 7 No. 4, 2018, pp. 122-131. doi: 10.5923/j.ijfa.20180704.04.
Article Outline
1. Introduction
- Stock returns from investments in equity are subject to vary because changes in stock prices which are a product of several factors and the impacts could either be positive or negative. These factors could be internal/firm specific or external/macro. The internal factors are firm size, ratio of market/book value, debt/equity financing, firm age, dividend per share, ratio of price-to-earnings, sales-to-price, return on assets, and earning per share. Others include premium growth, loss ratio, interest coverage, dividend yield, firm’s riskiness, and profitability (Kazeem, 2015; Anderson, 2016; Ali, 2017). The external factors are interest rate, world oil prices, foreign reserve, inflation rate, money supply, gross domestic product and output production (Maku & Atanda, 2010; Tripathi & Seth, 2014; Gatuhi, Gekara & Muturi, 2015).The internal factors relate to company value, capital structure, performance of company, and the company prospect in the future and among others. Internal factors can be controlled, altered, and perfected by the company and therefore, it is probable to offer benefits for the stakeholders (Kazeem, 2015).This study therefore, provides measurement of stock returns variation that is caused by firm level attributes. However, Nigeria as a developing market has diverse structure and institutional features from developed stock markets, and in view of the fact that investors are interested in getting more insights into the activities of blue chip companies in the country, it is imperative to find out whether stock returns in Nigeria respond differently to effects of firm level attributes. This study, therefore examines the effects of firm level attributes on stock returns of some selected quoted firms in Nigeria.In Nigeria, the area of firm level attributes and its effect on stock returns has attracted interest by researchers. Many researchers have attempted to examine the effect of firm level attributes on stock returns of quoted firms (Amadi & Odubo, 2002; Osamwonyi, 2003; Uwabanmwen & Obayagbona, 2012; Umar & Musa, 2013; Olowoniyi & Ojenike, 2013; and Kazeem, 2015). The study focused on financial sector and some subsectors of the manufacturing sector (consumer goods in particular), in exclusion of blue chip companies in spite of their strategic importance to the Nigerian economy.Also, periods covered by previous studies in Nigeria creates a gap in scope in this area of study. For example, the previous works of Adedoyin (2011) covered the period from 2004 to 2009, Uwubanmwen and Obayagbona (2012) covered the period from 1996 and 2010, Bala and Idris (2015) covered the period between 2007 and 2013, and Kazeem (2015) covered the period from 2006 to 2013. The periods of study as used by the aforementioned researchers can be regarded as not too recent. This is because a lot of activities in terms of adoption of International Financial Reporting Standards (IFRSs), and introduction of new corporate governance codes have occurred that might render previous findings ineffectual. Therefore, this study adds to existing literature in this area by taking into account estimation period from 2007 to 2016.The significant contributions of this paper include the following: first, it expands literature and add to the existing body of knowledge on the effects of internal factors on stock returns of companies quoted on the Nigerian Stock Exchange (NSE). Second, it provides policy directions for the regulators and/or policy makers, particularly the Securities and Exchange Commission (SEC) and the Central Bank of Nigeria. Finally, it guides capital market operators in their investment advisory services to interested and prospective investors and further provides evidence against relying on only profitability as the main indicator for stock returns by proffering answers to the following research questions:Q1: To what extend does firm size affect stock returns in Nigeria?Q2: To what extend does the ratio of market to book value per share affect stock returns in Nigeria?Q3: To what extend does price to earnings ratio affect stock returns in Nigeria?To answer the above research questions, the following research hypotheses have been formulated and stated in null forms:H1: Firm size has no significant effects on stock returns of quoted equity firms in Nigeria.H2: Ratio of market to book value per share has no significant effects on stock returns of quoted equity firms in Nigeria.H3: Price to earnings ratio has no significant effects on stock returns of quoted equity firms in Nigeria.The other sections of the study are organized as follow: Section 2 presents the review of prior literature and provides the theoretical perspective of the Study; Section 3 provides the methodological approach for the Study; Section 4 focuses on the study’s analysis and discussions; and Section 5 summarizes and concludes the Study.
2. Literature Review
2.1. Firm Size and Stock Returns
- Uwubanmwen and Obayagbona (2012) investigate the influence of firm attributes and equity returns in the stock market of Nigeria. The study uses eight sample firms with 11 years observation. The proxies employ firm’s unique attributes to include: leverage, book/market value of equity, ratio of price/earnings and firm size. The study establishes that the size of firm and returns of common stocks have no statistical significant relationship or effect. The study uses total asset natural log which is the traditional measure of firm size. This is as against previous studies use of firm size or market capitalization as the best and appropriate representative for examining the effect of size of firm on returns of common stocks.Bala and Idris (2015) examine firms’ specific characteristics of firm size, debt-equity, and earnings per share and stock market returns in Nigeria. The study samples nine (9) out of the twenty-one (21) quoted food and beverages firms in Nigeria from 2007 to 2013 by means of multiple regression models. The findings show that firm size has a significant and negative effect in stock returns of quoted food and beverages firms in Nigeria. The effect of earnings per share and debt-to-equity is found to have statistical significance and positive. The study did not factor in dividend in the measurement of the dependent variable (stock market returns). Stock return is the combination of dividend yield and capital appreciation. Also, the results of nine (9) out of over 170 sampled quoted firms cannot be the representative of the entire market. More firms would have explained the effect better. The study should have also included other internal non-financial variables that have been examined and found to explain stock returns in other jurisdictions.Kazeem (2015) examines firm specific attributes and financial performance of quoted insurance firms in Nigeria. The company fundamentals the study investigates are firm age, firm size, premium growth, loss ratio, liquidity and leverage from 2006 – 2013. The study employs multiple regression models for data analysis. The results of the study show that firm size was negatively related with finance performance of insurance companies in Nigeria. This study used natural log of total assets as a substitute for firm size as against previous studies use of market value of equity as appropriate representative for examining the effect of size of firm on returns of common stocks. The study should have also included other internal non-financial variables that have been examined and found to explain stock returns in other jurisdictions.Tahir, Sabir, Alam and Ismail (2013) explore the influence of some firm attributes on returns of common stocks. They use data of listed non-financial firms in the Pakistani Stock Exchange for a 10 year period (2002 to 2012). Market capitalization, book- to-market value of equity, sales growth, and EPS are used as firm characteristics proxies. The 307 firms’ secondary data is investigated using multiple regression models. The conclusions of the study reveal that market capitalization has significantly and positively impacted on Pakistani stock returns. The study establishes an agreement for the effect of firm size on stock market returns of Pakistan. The study did not factor in dividend in the measurement of the dependent variable (stock market returns). Stock return is the combination of dividend yield and capital appreciation.Wakil (2015) examines the value reference of total book assets, market value, and market value of total book assets in asset pricing models in the U.S.A. The sample period is from 1988 – 2013 with financial data obtained from Standard & Poor’s Compustat Annual Industral and Research files, whilst stock return and market valuation data were obtained from CRSP database. The findings were that market value as measured by market capitalization has positive relationship with stock returns. However, the study should have added more variables that could explain stock returns. One independent variable may mislead investors, as they will rely on it for investment decisions not taken into consideration other variables that also influence stock returns. There is also need to replicate this variable alongside other variables in Nigeria with a view to ascertaining position.
2.2. Market-to-Book Value Ratio and Stock Returns
- Capaul, Rowley and Sharp (1993) reveal that growth stocks (high ratio of Market to Book value) have on average higher betas than value stocks (low ratio of Market-to-Book value). Consequently, using beta as an evaluation of risk may be inappropriate if this risk agreement is legitimate. Secondly, low ratio of Market/Book (value) is related to stocks that are underpriced. Therefore, high returns are possible if we correct mispricing of these stocks. However, the study did not carry out pre and post diagnostic tests to validate and confirm assumptions of classical linear regression model. The result of significance effect between the variables may be spurious. There is therefore, a need to add more independent variables and use panel regression analysis with a view to getting more robust results.Khan (2009) assesses the effects of market to book ratio and price to earnings ratio on stock returns of quoted firms in Pakistani textile sector. The study uses OLS regression and a sample of thirty (30) quoted firms in Karachi Stock Exchange was taken from 2001 to 2006. The findings showed that market to book value ratio and stock market returns in Pakistan were statistically not significant. The use of Ordinary Least Square Regression (OLS) does not seem to explain the individual or cross sectional effect of the sampled firms given their respective peculiarities. Panel data stand to tackle a more set of problems and address more sophisticated issues than either pure time series or pure cross sectional data alone would address. Thus the use of panel regression is capable of given more robust result that can be acceptable than OLS.Shafana, Rimziya and Jariya (2013) examine the relationship between firm size, and book-to-market equity and stock returns in Sri Lankan market. The study use OLS and sample of twelve (12) quoted firms from 2005 to 2010. The findings of the study indicates that book to market equity has negative and significant effect on stock returns in Colombo Stock Exchange. The use of Ordinary Least Square Regression (OLS) does not seem to explain the individual or cross sectional effect of the sampled firms given their respective peculiarities. Panel data stand to tackle a more set of problems and address more sophisticated issues than either pure time series or pure cross sectional data alone would address. Thus the use of panel regression is capable of given more robust result that can be acceptable than OLS.Zaremba and Konieczka (2014) analyze the relations between select company features and stock returns on the Polish market for a study period of 2000 to 2012. The study uses the Ordinary Lease Square (OLS) and obtains data from Bloomberg. The empirical results indicates a significant positive association between book to market ratio and stock market returns. The use of Ordinary Least Square Regression (OLS) does not seem to explain the individual or cross sectional effect of the sampled firms given their respective peculiarities. Panel data stand to tackle a more set of problems and address more sophisticated issues than either pure time series or pure cross sectional data alone would address. Thus the use of panel regression is capable of given more robust result that can be acceptable than OLS.Hasan, Alam and Rahaman (2015) analyze the effects of size and value on cross-section of expected returns in Dhaka Stock Exchange (DSE). The study deploys the Fama and French (1993) three-factor methodology in conjunction with Ordinary Lease Square (OLS) model. The study period is divided into three periods; the pre-boom (2004 – 2008), boom period (2009 – 2010) and post crash period (2011 – 2013). The result of the study reveals that book to market equity ratio and stock returns have positive effect in Bangladesh. The use of Ordinary Least Square Regression (OLS) does not seem to explain the individual or cross sectional effect of the sampled firms given their respective peculiarities. Panel data stand to tackle a more set of problems and address more sophisticated issues than either pure time series or pure cross sectional data alone would address. Thus the use of panel regression is capable of given more robust result that can be acceptable than OLS.Ltaifa and Khoufi (2016) investigate empirically the determinants of stock market returns of Banks in the MENA countries between 2004 and 2014. The study uses the three-factor model of Fama and French (1993) and the capital asset pricing model (CAPM) to analyze the relationship. The findings reveals that firm size, book to market value, and stock returns have positive relationship. That is, companies with high book to market value ratio earn superior returns. The study of Ltaifa and Khoufi (2016) suffers from some limitations. One, the study did not clearly state the technique for data analysis. Two, the study should have included more internal variables with a view to determining their behavior on stock returns. Investors would want to know this as it will help in their investment decisions.
2.3. Price-to-Earnings Ratio and Stock Returns
- Kelly, McClean, and McNamara (2011) explore the industrial sector of the stock exchange in Australia. Data were collected from 1310 industrial companies from 1998 – 2006. The purpose of the study is to determine the association between stock returns and price/earnings ratios, where it is noted that industrial firms in Australia experience low price/earnings effect. The results reveal that positive significant correlation between stock market returns and price/earnings ratio. These findings are in contrast with the efficient market hypothesis, in which Australia stock exchange is regarded to have. The study used only independent variables, there is need to add more variables. The study period needs to be updated and conducted in Nigeria to confirm earlier position of the researchers in this area.Lieam and Sautma (2012) investigate the predictability of stock return using price earnings ratio of forty-five (45) stocks listed in Indonesia Stock Exchange (ISE). The study uses descriptive statistics and Analysis of Variance (ANOVA) to establish whether low PE stock returns are different significantly with high PE stock returns. The findings show no significant link between price earnings ratio and stock returns. The study concludes that PE ratio is not a good tool in estimating stock returns. However, the study was limited to Indonesia and the use of more variables (internal and external) and the use of panel seems to be absence in the study. Also, the study was carried out in year 2012, therefore, the need to update it.Mburu (2014) analyzes the association between price-earnings ratio and stock returns of companies quoted at the Nairobi Securities Exchange for a study period from 2009 to 2013. Multivariate correlation and regression model is deployed to investigate the relationship between the variables. The findings indicates an insignificant correlation between P/E ratios and stock returns. However, being an emerging market, investors in Kenya would be interested on other factors whether micro or macro that affect stock returns. This will assist in making strategic investment decisions. The study was also conducted with data up to 2013, therefore, the need to update it and using the Nigerian capital market.Mwai (2014) investigates the link between price-earnings ratio and stock returns of companies quoted at the Nairobi Securities Exchange. The study adopts regression analysis, with a study period from 2009 to 2013. The results reveals a positive association between price to earnings ratio and stock returns in Nigeria. However, the association was found to be insignificant. However, being an emerging market, investors in Kenya would be interested on other factors whether micro or macro that affect stock returns. This will assist in making strategic investment decisions. The study was also conducted with data up to 2013, therefore, the need to update it and using the Nigerian capital market. The study also revealed a low coefficient of determination. This infers that investors may not find the ratio useful in selecting investment stocks on the basis of their price earnings. The need to therefore, increase more independent variables become imperative.Arslan and Zaman (2014) examine the impacts of price to earnings ratio and dividend yield on stock returns in Pakistan. The study uses advance econometrics techniques in determining the impacts between the variables using a period from 1998 to 2009. The impact of the variable of stock returns was determined using the fixed effect model. The findings indicate that stock returns and price to earnings ratio have significant positive impact. However, the study was limited to Pakistan and the use of more variables (internal and external) and the use of panel seems to be absence in the study. Also, the study was carried out in year 2009, therefore, the need to update it and in Nigeria.Kumar (2017) investigates the influence of earning per share and price to earnings ratio on market price of share in India. Multiple regression analysis is used to examine the impact between the variables using a study period of 2011 to 2016 with sample of eight (8) auto based companies. The findings shows that price to earnings ratio has significant effect on stock price prediction of select companies in India. However, the study did not carry out pre and post diagnostic tests to validate and confirm assumptions of classical linear regression model. The result of significance effect between the variables may be spurious. There is therefore, a need to add more independent variables and use panel regression analysis with a view to getting more robust results.
2.4. Arbitrage Pricing Theory
- Arbitrage Pricing Theory (APT) developed by Ross (1976) as a Capital Asset Pricing Model (CAPM), is premised on the basis that the stock returns are caused by a specific number of economic variables. The theory further suggests that there are different risks in the economy that cannot be eradicated by sole diversification. CAPM was introduced by Sharpe (1964), Lintner (1965) and Mossin (1966). The theory states that non-diversifiable market risk impacts expected security returns. According to Al-Shami and Ibrahim (2013), the general notion behind the APT is that compensation is provided for the investors due to the time value of money or systematic risk which is characterized by the risk-free rate (rf). Another compensation for taking up extra risk can be calculated through a risk measure (Beta) by comparing the asset returns with the market for a time period and with the market risk premium.According to Gatuhi, Gekara and Muturi (2015), APT assumes that various market and industry related factors contribute towards returns on stocks. Theses multi factor models have been developed with the assumption that stock returns are based upon several economic factors which include market return as well as other factors, and can be grouped into industry wide and macroeconomic forces. The industry related variables can vary with the nature of industry and economic conditions. The exact number of industry related variables is not identified so far. The frequently used macroeconomic and industry variables in existing literature are interest rate, exchange rate, money supply, consumer price index, risk free rate, industrial production, balance of trade, dividend announcements, and unexpected events in national and international markets. Amtiran, Indiastuti, Nidar and Masyita (2017) in their study conclude that model APT one factor is valid more than multi-factor APT. Other studies that found APT useful in relating changes in returns on investments to unanticipated changes in a range of key value drivers for these investments include Acikalin, Aktas and Unal (2008), Ali (2013), Ibrahim and Musah (2014), and Kirui, Wawire and Onono (2014).
3. Research Methods
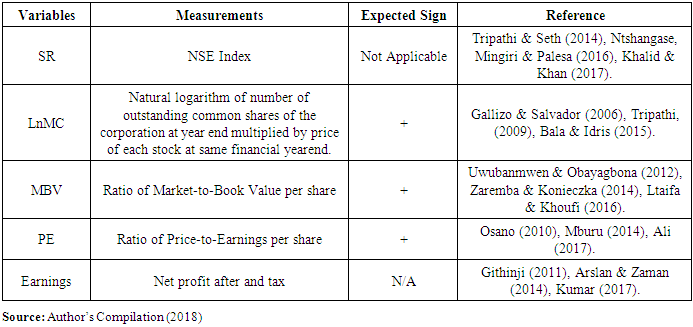
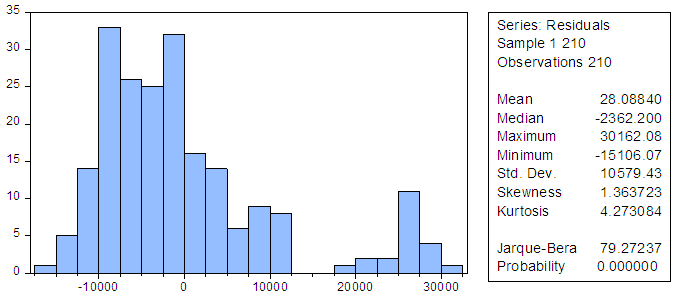
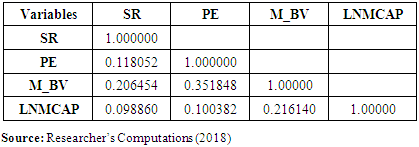
- In undertaking this study, ex-post facto research design was adopted. The justification is that the research involves panel data on multiple phenomena of 25 companies observed over multiple periods of ten (2007 - 2016) years, which events have already taken place. The population of the study is the top twenty-five (25) most capitalized equity firms that have been listed on the premium and main boards of the NSE. This constitutes about ninety (90) percent of the total market capitalization as at December 31, 2016.The justification for using Nigeria is that Nigerian capital market has been a rewarding destination for both foreign and domestic investors and it is thriving very quickly in recent years. For example, the according to Nigerian Stock Exchange (2017), domestic composition of transactions on the Nigerian Stock Exchange (NSE) between January and December 2016 increased by 27.32% while the institutional composition of the domestic market increased by 63.16% from N21.85b in January to N35.65b in December. Also, in 2013, the NSE was ranked by the International Finance Corporation (IFC) as the best performing emerging market in the world [Securities and Exchange Commission, (SEC), Nigeria]. All these evidences emphasize on the importance of the Nigerian capital market, and hence it is a very gainful opportunity for investors.While selecting sample of companies from the top twenty-five (25) most capitalized quoted equity firms, a company had been regarded eligible for inclusion in sample if it satisfied the following conditions:i. The earnings per share for any four successive years was not zero or negative during the period 2007 to 2016;ii. The company did not erode its shareholders’ fund for more than three successive years from 2007 to 2016;iii. Furthermore, only company whose price data was available for the years (2007 to 2016) was retained in the sample size;iv. The company must have been in existence from 2007 to 2016;v. The currency in which the financial statements were prepared was the local (Naira) currency; andvi. The company was listed on the NSE as at December 31, 2016.The study adopts the purposive sampling technique. The period of sample is ten (10) years; from 2007 – 2016. This sample period of 10 years in my opinion, is sufficient to draw reliable and verifiable conclusions and/or findings.The study is based on secondary data. The main data source is the Nigerian Stock Exchange (NSE) database and website, the 2016 edition of the Central Bank of Nigeria (CBN) Statistical Bulletin and the annual published accounts of the affected companies.In achieving the objective of the study, panel regression analysis was used. The Jarque-Bera statistic was used to describe the normality of the residuals. Correlation matrix was used to describe the degree of relationship linking the regressors (macroeconomic factors) with the dependent parameters/variable (stock returns). Post-residual diagnostic (multicollinearity and heteroscedasticity) tests to check for validity of model assumptions were carried out.
|
4. Results and Discussions
4.1. Preliminary Analysis
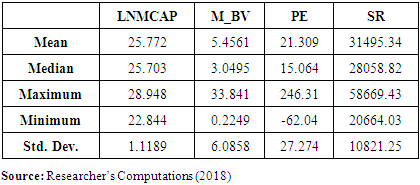
- In order to examine inter-relationships of the variables, this section begins by evaluating the summary statistics. This gives a good idea of the patterns in the data. The summary statistics and correlation matrix are presented below.
|
|
|
|
|
|
4.2. Discussions
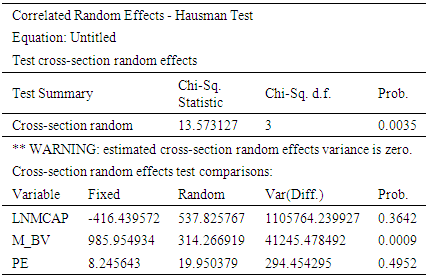
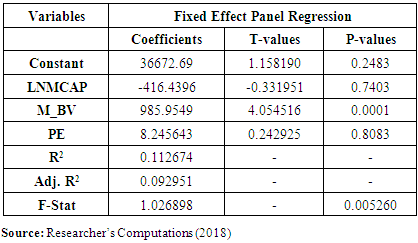
- The cumulative result shows that the R2 has a value of 12%. The coefficient of determination indicates that about 12% of variation in stock returns of selected quoted companies in Nigeria is explained by LnMCAP, M_BV, and PE. The remaining 88% is explained by error term and other variables not captured in the model. These variables could be other external or internal that also have the capacity to explain change in stock returns in Nigeria. The result of the regression indicates that the model is fit with F-statistic of 1.026898 and a probability value of 0.005260. The result implies that the overall effect of the independent variables on stock return in Nigeria is statistically significant at 5%. Empirical evidence from the above results indicate insignificant negative effect of firm size as proxied by natural logarithm of market capitalization on stock returns of twenty-one most capitalized quoted equity firms in Nigeria. The implication of this is that, stock returns of quoted firm in Nigeria decreases significantly, as market capitalization increase. The result is in agreement with theoretical prediction and empirical findings of Tahir, Sabir, Alam and Ismail (2013); and Wakil (2015). However, the finding of the study contradicts those of Uwubanmwen and Obayagbona (2012); Bala and Idris (2015); and Kazeem (2015). The finding does not support the study’s a priori expectation and agrees with the Arbitrage Pricing Model (APT) which assumes that there are various market and industry related factors that contribute towards returns on stocks.In addition, the study finds that the ratio of market to book value per share has significant positive influence on stock returns of twenty-one most capitalized quoted equity firms in Nigeria. This implies that since M_BV is a firm specific indicator, it may be misleading to solely rely on it for any strategic investment decisions. A low ratio of market to book value per share indicates a firm with value stock, which depicts that investors in Nigeria prefer companies whose stock prices trade lower relative to their fundamentals, thus investors consider them undervalued. The result is in agreement with theoretical prediction and empirical findings of Khan (2009); and Shafana, Rimziya and Jariya (2013). However, the finding of the study contradicts those of Zaremba and Konieczka (2014) and Hasan, Alam and Rahaman (2015). The finding does not support the study’s a priori expectation and but agrees with the Arbitrage Pricing Model (APT) which assumes that there are various market and industry related factors that contribute towards returns on stocks.Furthermore, the regression result indicates that the ratio of price to earnings has an insignificant positive effect on stock returns of twenty-one most capitalized quoted equity firms in Nigeria. This implies that increase in the price to earnings ratio, increases stock returns of quoted firms in Nigeria. A further implication of this result is that, the ratio projects earnings capacity of firms in Nigeria and investors may focus on those companies because they have above average growth potentials. This growth potentials have implication for firm value and shareholders wealth. The result is in agreement with theoretical prediction and empirical findings of Mburu (2014); and Ali (2017). However, the finding of the study contradicts those of Leim and Sautma (2012) and Kumar (2017). The finding supports the study’s a priori expectation and agrees with the Arbitrage Pricing Model (APT) which assumes that there are various market and industry related factors that contribute towards returns on stocks.
5. Conclusions
- In line with the findings that firm size has insignificant negative effect on stock returns of twenty-one most capitalized quoted equity firms in Nigeria, the study concludes that size is not a good determinant of stock returns in Nigeria. Furthermore, with significant positive influence of ratio of market to book value per share on stock returns of twenty-one most capitalized quoted equity firms in Nigeria, the study concludes that the ratio is a good determinant of stock returns and investors in Nigeria prefer companies whose stock prices trade lower relative to their fundamentals, thus consider them undervalued. Based on the finding that price to earnings ratio has insignificant positive impact on stock returns of twenty-one most capitalized quoted equity firms in Nigeria, the study concludes that price to earnings ratio is not a major determinant of stock returns in Nigeria. Thus, other variables could have more explanatory powers on stock returns in Nigeria. The study further states that investors may focus on those companies because they have above average growth potentials. In line with the findings of the study, the following recommendations are made:The Securities and Exchange Commission should closely monitor (including risk-based supervision) and carryout surveillance on firms with large market capitalization as well as all trading activities on the floor of the Nigerian Stock Exchange (NSE) to minimize incidences of stock price manipulations, such that they are reflective of the forces of demand and supply. Firms may also work toward building strong fundamentals that may affect stock price positively.The investors should carefully use market to book value per share ratio to determine the difference between the firm’s net assets and the market valuation as it a reflection of the premium (or discount) that the market offers to the firm on its net assets and, as such, reveals the efficiency with which the market looks at the firm as being run and managed. The investors and investment analysts need to exercise utmost care in determining the correct and comparable earnings per share of each company since companies with above average growth potential will traditionally command higher P/E ratios. These growth potentials may influence stock returns, hence be taken into consideration in making investment decisions. This is against the backdrop of positive contribution of price to earnings ratio on stock returns.
 Abstract
 Reference
 Full-Text PDF
 Full-text HTML