-
Paper Information
- Paper Submission
-
Journal Information
- About This Journal
- Editorial Board
- Current Issue
- Archive
- Author Guidelines
- Contact Us
International Journal of Finance and Accounting
p-ISSN: 2168-4812 e-ISSN: 2168-4820
2017; 6(6): 159-166
doi:10.5923/j.ijfa.20170606.01

Using Altman Z-score and Beneish M-score Models to Detect Financial Fraud and Corporate Failure: A Case Study of Enron Corporation
 Abstract
 Reference
 Full-Text PDF
 Full-text HTML
John MacCarthy
Accounting Department, University of Professional Studies, Accra, Ghana
Correspondence to: John MacCarthy, Accounting Department, University of Professional Studies, Accra, Ghana.
| Email: |  |
Copyright © 2017 Scientific & Academic Publishing. All Rights Reserved.
This work is licensed under the Creative Commons Attribution International License (CC BY).
http://creativecommons.org/licenses/by/4.0/

The objective of this research is to determine whether Altman Z-score and Beneish M-model could detect financial fraud and corporate failure of Enron Corporation. Five-year financial information was collected from the US SEC Edgar database covering the period 1996 to 2000. The Beneish model revealed that the financial statements for the five years studied were manipulated by management. On the basis of the analysis, the researcher argued that stakeholders would be better protected when the two models are used simultaneously than when only the Altman Z-score is used. The paper recommended that Altman Z-score and Beneish M-Model should be used together as an integral part of every audit.
Keywords: Altman Z-score, Beneish M-score, Corporate Failure, Financial Statements, Fraud
Cite this paper: John MacCarthy, Using Altman Z-score and Beneish M-score Models to Detect Financial Fraud and Corporate Failure: A Case Study of Enron Corporation, International Journal of Finance and Accounting , Vol. 6 No. 6, 2017, pp. 159-166. doi: 10.5923/j.ijfa.20170606.01.
Article Outline
1. Introduction
- Corporate fraud and misconduct remains a constant threat to public trust in the confidence building of the capital markets. Fraud is an intentional act, committed to secure an unfair or unlawful gain or advantage by the perpetrator (KPMG, 2006). Fraud is any act designed to deceive others, often resulting in the victim suffering from loss of their investments. Anytime the financial statement is manipulated, it creates a disagreement between a company’s financial performance and related non-financial measures of the company such as: employee head count, number of retail outlets, and warehouse space. This creates an inconsistency that represents a red flag for gatekeepers to suspect fraud in financial statement prepared (Brazel, Jones & Zimbelman, 2009).According to the report from Permanent Subcommittee on Investigation of the U.S. Senate findings, management of Enron Corp were guilty of the following actions that caused the collapse of the firm: fiduciary failure, high risk accounting, inappropriate conflict of interest, extensive undisclosed off-balance sheet activity, excessive compensation, and lack of independence of the external auditors.Deloitte (2008) revealed that there is connection between bankruptcy and fraud and there is a high chance that a company at the verge of bankruptcy would engage in fraudulent activities or manipulate the financial statements. This implies that, prior to the collapse of the company in 2001 there was pressure on the management team to manipulate earnings in order to show a better picture for the shareholders. This implies that, at the verge of bankruptcy, managers are motivated to manipulate their financial statements to show a better financial picture to their stakeholders. This creates a linkage between a distressed company and a fraudulent company; hence, there is the need to use these two models, Altman Z-score and Beneish M-score models simultaneously for this study.Altman Z-score model works well on financial statements that are not manipulated while Beneish M-score is used to determine whether the financial statement is manipulated. Hence, for this analysis to be successful there is the need to deploy Beneish M-score model prior to the deployment of Altman Z-score model. Therefore, it is imperative to use Beneish M-score before Altman Z-score model. To do this, the Beneish M-score model was first employed to detect whether the financial statements were manipulated. Then the Altman Z-score model was used to determine whether Enron Corp was distressed, and if the financial statements prior to the collapse were manipulated.Bankruptcy is often a logical extension of the on-going misappropriation and mismanagement of a firm’s funds. A recent empirical evidence collected by the Association of Certified Fraud Examiners [ACFE], (2008) revealed that there were about 1,843 global occupational fraud cases reported between January 8, 2008 and December 31, 2009 and that 25% of the fraud cases caused at least a loss of USD$ 1 million. It further revealed that, these frauds were not detected early until at least 18 months on the average after they happened. In the case of Enron Corp, fraudulent activities started in the late 1990s and continued until they eventually led to the biggest corporate bankruptcy in the history of the United States of America.Wells (2001) stated that, the following ratios: DSRI, GMI, AQI, SGI, DEPI, SGAI, LEVI, and TATAI are critical in detecting manipulation of financial statements. Enron Corp was able to deceive both investors and regulators for a very long time because these models were not quite popular at that time. However, the question that, the researchers and academics want answer to is, whether the models are capable of detecting manipulation and financial distress even when the auditors failed to carry out their fiduciary duty of care to the shareholders. Researchers opined that, it is possible to spot the manipulation and detection of financial statements by financial analysts and watchdog institutions paid to protect investors using appropriate models (Nugent, 2003; Tebogo, 2011).According to Bratton (2002), Enron flew high at a time when its stock price peaked at close to $90 in August 2000. At that time, Enron was among America’s seventh largest firm by market capitalization and it was rated as “The Most Innovative Company in America” for five consecutive years from 1997 to 2001. Enron, led by its founding Chief Executive Officer (CEO), Kenneth L. Lay, went from State to State to push local regulators to mandate the unbundling of vertically integrated utilities and was successful in 24 States. Enron fought and won battles against protected energy monopolies and also spent copiously on politics.
2. Literature Review
2.1. Enron’s Financial Earnings Manipulation
- There were three major violations spotted under Generally Accepted Accounting Principles (GAAP) that heralded the fall of Enron: (1) The off-balance sheet arrangements, (2) The role of mark-to-market, and (3) The manipulation of derivatives (Lemus, 2014). Enron’s revenue increased from $20 billion to $31 billion in 1998 then to $40 billion in 1999 and finally to $100 billion in 2000. This represented over 390% growth within 4 years. Arthur Anderson permitted Enron to book a present profit based on a projection of power prices of ten years into the future (Bratton, 2002).According to Bansal and Kandola (2003) Enron had kept $600 debt associated with its partnership with Chewco and the joint energy development investments from its financial statements. Enron admitted that the earnings in the financial statements had been overstated because the company failed to follow the rules on qualifying for Special Purpose Entity (SPE). According to Petrick and Scherer (2003) and re-cited by Mahama (2015) Enron relocated many of its assets off the balance sheet into SPE off the partnership books.According to Li (2010) one of the major causes of Enron’s fall was the US Securities Exchange Commission allowing Enron to use market to market accounting method. Enron reported $1.41 billion as pretax profit in 2002 using market-to-market accounting method. Enron manipulated its derivatives and reported an increase from $1.8 billion to $10.5 billion. The financial statements of 2000 showed more than $16 billion in gain from derivatives.The primary motives behind these violations of earnings were to remove additional debts to the balance sheets and to allow a better performance of the company. Enron took full advantages of accounting limitations in managing its earnings and balance sheet to portray a rosy picture of performance. These violations saw Enron share price peaking at $90 in August and then tumbling to forty cents a share after the collapse.
2.2. Independence of Enron’s External Auditors
- Evidence available after the debacle of Enron revealed that there were basic weaknesses with the auditor’s independence. Auditors providing non-audit services has been one of the most debatable issues in recent times. According to Hossain (2013) an abnormal high fee charged by auditors for non-audit services may compromise the auditor’s independence. Auditor independence is one of the most important issues in accounting today (Myring & Bloom, 2003). Auditor independence is a fundamental requirement of any quality audit. The auditor’s independence increases the effectiveness of the audit to be conducted and provides an assurance that the audit would be objectively executed.Any factors that threaten an auditor’s independence would eventually impair the objectivity of the auditor’s independence. The professional code of ethics outlined in the International Federation of Accountants required that auditors should identify potential threats and apply safeguards to eliminate or reduce threats to an acceptable level.There were many activities between Enron and Arthur Anderson that threatened the independence of the auditor to play the role of the first “gatekeeper” of Enron shareholders and other stakeholders. Enron top officers in charge of accounting matters were previously Anderson’s accountants. Enron usually hired Anderson employee on a regular basis. The financial statements of 2001 revealed that $25 million and $27 million were paid to Anderson as audit fees and consulting fees respectively.Enron and Arthur Anderson used unacceptable accounting practices which misinformed the shareholders and other stakeholders of their investments in Enron.
2.2.1. Theoretical Framework: Altman Z-score Model
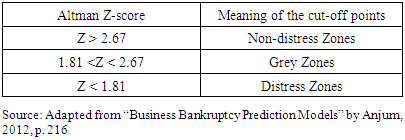
- This literature review provides insight into the theories and models for predicting corporate failure and manipulation of financial statements. Altman Z-score is a Multiple Discriminant Analysis (MDA) or a quantitative model used to distinguish between surviving and failing companies (Robinson & Maguire, 2001) based on information gathered from published financial statements. Altman Z-score model is the quantitative model used to predict financial corporate distress.Altman Z-score has the ability to discriminate between companies that are financially distressed and those that are not financially distressed. The model used financial figures from financial statements and grouped them into five different variables for analysis. These ratios or independent variables are used to predict the probability that, the firm would go into bankruptcy in at most two years.The model uses the under-mentioned formula to detect bankruptcy with reference to these weights assigned to X1, X2, X3, X4 and X5:
 | (1) |
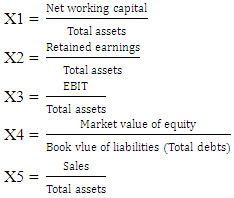 The independent variables for the model are X1, X2, X3, X4 and X5 which are used to determine the dependent variable, the Z-score in equation (1). The outcome Z-score value is obtained and compared with the cut-off shown in Table 1 that is non-distress, grey and distress dependents on the score obtained. Altman Z-score has high degree of accuracy in predicting corporate financial distress in the USA as well as in the emerging markets (Altman, Hatzell & Peck, 1995). The initial Z-score model was designed for the manufacturing sectors that have high capital intensity and therefore, was not suitable for the non-manufacturing sector.
|
2.2.2. Beneish M-score Model
- Professor Messod Beneish developed Beneish M-score model in 1999 as a complementary forensic tool to Altman Z-score model with the aim of protecting shareholders, creditors and bankers in their analyses. Beneish M-score is a financial forensic tool often used to detect areas of possible manipulation on the company’s financial statements by forensic accountants, auditors and regulators (particularly the SEC).Beneish model is used to discriminate between companies that have manipulated their financial statements. The score is determined from eight independent variables and an intercept to detect whether the company’s earnings have been manipulated by management. The eight variables were taken from the company’s financial statements and used to determine M-score of this study. An M-score obtained that is greater than -2.22 is an indication that the company’s financial statements may have been manipulated (Warshavsky, 2012). Hence, if the score obtained from the computation of the eight variables from Enron’s financial statements is greater than the cut-off point of negative 2, then it implies that, the financial statements were manipulated. A score suggests that, the financial statements prepared by management should be investigated further or have to be investigated further for financial fraud.M-score model is a probability model, and such cannot detect 100% manipulation. Beneish identified that it is possible to determine 76% manipulators accurately and 17.5% inaccurately as non-manipulator. The eight variables used to develop the Beneish M-score model are:DSRI: Day Sales in Receivable IndexGMI: Gross Margin IndexAQI: Assets Quality IndexDEPI: Depreciation IndexSGAI: Sales, General and Administrative Expenses IndexLVGI: Leverage IndexTATAI: Total Accruals to Total Assets IndexBeneish used the under-stated model to detect manipulation of the financial statements based on these weights in equation (2):
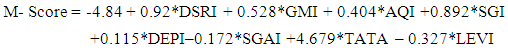 | (2) |
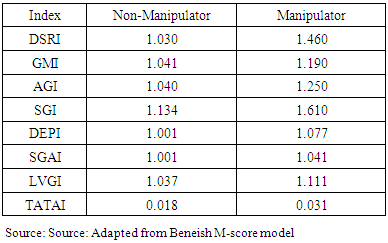
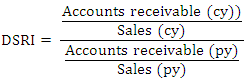 DSRI is used to measure the changes made in respect of receivables consistent with the changes made in respect of sales. A DSRI score of 1.031 or below indicates that, the financial statements in respect of the DSRI were not manipulated but a score of 1.465 and above indicates that, the financial statements in respect of the DSRI have been manipulated or an indication that, the company has changed its credit terms and now granting more credit than before. When this does not show a fair consistent trend then it suggests that either more sales are made on credit terms rather than through cash sales or the company is having difficulty in the collection of cash from trade debtors. A rising DSRI might be the perfect legal activity of a company extending more credit to customers and companies that overstated revenue. Therefore, a sharp rise in the DSRI score provides signals to the forensic investigators that, the financial statements are manipulated or terms of credit have changed.
 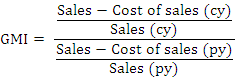 GMI is used to measure the ratio of a prior year’s GMI to that of the current year review. The GMI score of 1.041 or lower indicates that gross profit of the current period is not manipulated but a score of 1.193 indicates that gross profit of the company is manipulated (Harrington, 2005). Warshavsky opined that, earning quality is a very important aspect for evaluating a company’s financial health. This, therefore, create temptation to manipulate earnings when things are not going on well.
 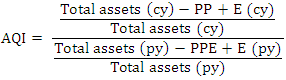 AQI is used to measure the proportion of total assets of the current year to the previous year. According to Pustylnick (2009), when an AQI ratio greater than 1.0 is an indication that some expenses or intangible assets have been capitalized and others have been deferred for the future. An increase in AQI indicates that additional expenses are being capitalized to avoid writing-off to the statement of comprehensive income in order to preserve profit (Harrington, 2005).
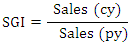 SGI is used to measure sales in the current year over the sales of a previous year. SGI is used to measure the sales figure in the current year. A score of 1.134 or below is an indication of non-manipulation and a score above 1.607 indicates that, the sales figures have been manipulated. Harrington (2005) observed that, companies with high growth rate find themselves highly motivated to commit fraud when the trends reverse. In such situations, there is a potential increase beyond a certain percentage that may cause suspicion (Pustylnick, 2009).
 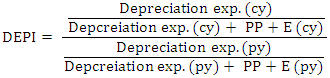 DEPI is used to measure the ratio of the depreciation expense against the company’s value of PPE in the current year against that of the previous year. A DEPI ratio of 1.001 or lower is an indication that, DEPI has not been manipulated. According to Beneish (1999), a score above 1.077 is an indication that, the assets value has been revalued or the useful life of the assets has been extended or adjusted upward.
 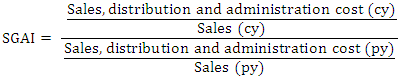 SGAI is used to measure the ratio of sales, general and administrative expenses for the current year over the previous year. A score of 1.001 or below is an indication that SGAI has not been manipulated. According to Beneish (1999) a disproportionate increase in sales indicates a negative signal about the company future prospects. According to Lev and Thiagarajan (1993) a disproportional increase in SGAI is an indication of a negative signal about the company’s future prospects. A positive relation gives an indication that there is probability of manipulation.
 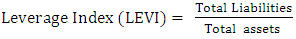 LVGI is used to measure the company’s ratio in terms of total debt to total assets for the current year divided over the previous year’s ratio. A LEVI greater than 1 implies that there is an increase in leverage position in the company and that the company has taken more debt to operate or to run the business for the period under review.
  TATAI is used to measure the ratio of change in working capital accounts other than cash and less depreciation. The growth of TATAI usually indicates that goodwill and amortization numbers in the financial statements have being tampered with. A mean score of 0.018 is an indication that there is non-financial manipulation while a mean score of 0.031 and above is an indication that the financial data have been tampered with.The Beneish model identifies between 38% and 76% of the manipulated reporting companies correctly and misclassified between 3.5% and 17.5% of the manipulated companies as non-fraudulent companies (Beneish, 1999).
 3. Empirical Analysis
3.1. Sample and Data Research Methods
- This paper adopted quantitative research methodology. This research method was used to collect secondary data needed to test the research hypotheses in order that the research questions can be answered or to “uncover” the true financial position of Enron prior to the failure using mathematical-based methods (Naoum, 1998). Secondary data was collected from the US SEC Edgar database from the period 1997 to 2001 in order to answer the research questions and hypothesis of the study. The analytical tools used for this study were Altman Z-score and Beneish M-model. Excel and SPSS were the software used to assist the analysis of the study. The data were analysed based on the assumption that they were normally distributed and linearly distributed.
3.2. Hypotheses
- The study seeks to test the following hypotheses:H01: The financial statements published by Enron Corporation showed signs of corporate distress prior to the failure.HA1: The financial statements published by Enron Corporation did not show signs of corporate distress prior to the failure.H02: The financial statements published by Enron Corporation were manipulated prior to the failure.HA2: The financial statements published by Enron Corporation were not manipulated prior to the failure.
3.3. Findings
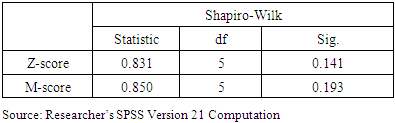
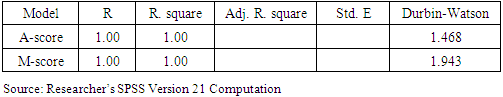
- The hypotheses of the study are tested and the outcome presented in this section. It is important to organize data into suitable variables or ratios before the application of the two models for the analyses. The hypothesis for this study is tested using parametric statistical tool of Multiple Discriminant Analysis (MDA). Both Altman Z-score and Beneish M-score are MDA and are made up of several independent variables and dependent variables which intercept (i.e., residue). The basic assumption is that data are normally distributed, linearly distributed and auto-correlated in order to test the research hypotheses in the use of MDA. Table 2 showed that data is normally distributed.
|
|
|
|
|
3.4. Discussion of Results
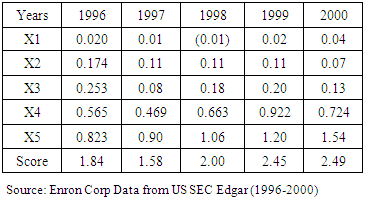
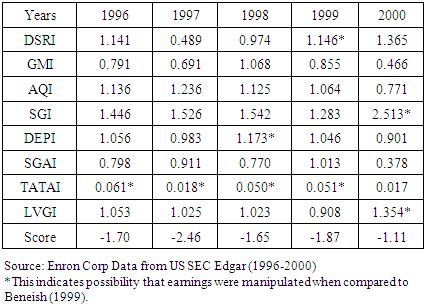
- Table 5 shows the computation of Enron Corp Z-score from the secondary data collected from 1996 to 2000. Altman Z-score calculation revealed that, the company was financially distressed as far back as 1996 and remained in distressed zone in 1997 before moving out of the distress zone to the grey zone from 1998 to 2000. The scores of 2.00, 2.45 and 2.49 for 1998, 1999 and 2000 respectively showed that, the company was in grey zone. The results provided the evidence that, Altman Z-score was not a sufficient model to have caught the failure of Enron Corp especially if the financial statements were manipulated. Altman Z-model requires companies must remain distressed for three years, and then go into bankruptcy after two years. However, in this particular case, Enron moved out of distress zone in the third year to grey zone making it difficult to predict the bankruptcy, especially if its financial statements were manipulated.The average score for the five-year period was 2.07 which is an indication that the company was not distressed but in the distressed zone. Therefore, using year-on-year variables to determine distress revealed that Enron was distressed for only two years but by the third year which was critical in the determination of distress, the company moved out of distressed zone to grey zone. Secondly, using the average of the first three years also confirmed that, the company was not distressed but in the grey-zone. Therefore, the null hypothesis (H01) is not rejected.Table 6 showed that, the M-score for the year 1997 was negative 2.46, a figure below the benchmark M-Score for non-manipulated earnings. The four-year score in Table 6 was above the mean score of a non-manipulated figure of negative 2.22 with the exception of 1997. However, a detailed overview of the eight variables in 1997 also revealed that TATAI was manipulated. This implies that all the five-year financial statements were manipulated.This indicates that earnings of 1997 were not manipulated, but immediately after 1997 till 2000, the M-score was below negative 2.22, an indication that the earning figures were all manipulated from 1998 to 2000 to conceal the picture that the company was distressed.A closer look at Table 6 revealed that only one variable is manipulated in 1996 and 1997 but the manipulation became more intense after 1998, where two variables were manipulated and then finally three variables in 2000. Consistently, Beneish M-model showed that, most of the independent variables were manipulated prior to the collapse. The manipulation started gradually from 1996 with only one variable TATAI, then it rose to two in 1998 (TATAI and DEPI). The manipulation of the independent variable remained two out of the eight variables manipulated in 2000, representing over 25% of the financial statement prepared by the management of Enron Corp.Therefore, the null hypothesis (H02) is rejected to imply that because the financial statements of Enron Corp were manipulated to hide the true financial position of the company, Altman Z-score model failed to predict the true picture that Enron was distressed.
4. Conclusions and Recommendations
- This paper concludes that the financial statements were manipulated to hide the debt of the company, inflate profits with the intention to support the stock price, so that the company’s value would be overstated. Enron took advantage of accounting limitation in managing its earnings and balance sheet to portray a glowing picture for its performance (Heavly & Papelu, 2003). The independence of Arthur Anderson and his firm was threatened by other professional services they were rendering which made lose sight of their mandate. A manipulated financial statement could not be detected by Altman Z-score model to predict the bankruptcy accurately alone without the Beneish M-score model due to the fact that the earnings were manipulated or earnings were managed.There is a high probability that the company that is faced with financial distress would manipulate their earnings by changing depreciation rates, delay in recognition of expenses, recording sales early or creating other accounting tricks that favour the company in order to show a better picture than what actually pertains in the company. These manipulations may sometimes not be illegal, but rather used to disguise the actual picture of the company. Enron Corp’s financial statements including notes of disclosures did not show the true financial picture of Enron Corp (i.e., a company that was having financial and economic difficulty).The outcome obtained from Altman Z-score on Enron Corp revealed that three out of the five years (i.e. 1998, 1999 and 2000) were in the grey zone while 1996 and 1997 were distressed. The company jumped out of distress in the third zone which confirmed the likelihood that the financial statements after 1997 had been manipulated to improve the firm’s performance.The auditor, Arthur Anderson, whose responsibility it was to see if the financial statements were manipulated, was accused of applying negligent standards on their audit because of conflict of interest over significant consulting fees from Enron (Heavly & Papelu, 2003). Conflict of interest and lack of adequate oversight responsibilities on the part of auditors and the Board of Enron contributed to the firm’s collapse causing so much loss to the investors. There should have been suspicions after 1997, and forensic tools such as Beneish M-score model could have been used to spot manipulations by the senior management.Enron Corp’s failure, thus, could have been detected and prevented earlier using Beneish model, and also if the auditor was diligent rather than being busy providing consultancy work at the expense of doing quality audit to the stakeholders. The analysis performed by the Beneish model revealed that Enron Corp manipulated the financial statements to gain advantage.Mulford and Comiskey (1996) defined earnings management as the active manipulation of accounting results for the purpose of creating an altered impression of the business performance. The Beneish model if applied well by the auditor can provide potential ‘red flags’ for further investigations to be carried out. This revelation could trigger better audit work in order to show a true position of Enron.If there should be any lesson learnt from Enron’s case then it is obvious we cannot rely upon the professional gatekeepers—auditors, analysts and others whom the market has long trusted to filter, verify and assess complicated financial information. According to Coffee (2002), Enron’s failure demonstrates that the gatekeeper failed and the critical issue is how that failure could be ratified.