-
Paper Information
- Paper Submission
-
Journal Information
- About This Journal
- Editorial Board
- Current Issue
- Archive
- Author Guidelines
- Contact Us
International Journal of Finance and Accounting
p-ISSN: 2168-4812 e-ISSN: 2168-4820
2017; 6(4): 111-115
doi:10.5923/j.ijfa.20170604.03

Forecasting Mortality Rate of a Ghanaian University Staff Superannuation Scheme
 Abstract
 Reference
 Full-Text PDF
 Full-text HTML
Abigail Yeboah Boateng1, Akoto Yaw Omari-Sasu1, Derrick Asamoah Owusu1, Maxwell Akwasi Boateng2
1Department of Mathematics, Kwame Nkrumah University of Science and Technology, Kumasi, Ghana
2Faculty of Engineering, Ghana Technology University College, Ghana
Correspondence to: Abigail Yeboah Boateng, Department of Mathematics, Kwame Nkrumah University of Science and Technology, Kumasi, Ghana.
| Email: |  |
Copyright © 2017 Scientific & Academic Publishing. All Rights Reserved.
This work is licensed under the Creative Commons Attribution International License (CC BY).
http://creativecommons.org/licenses/by/4.0/

Longevity is an issue that has gained worldwide importance. For some time now, life expectancy is increasing rapidly and pension fund managers are on the lookout. This research sought to estimate mortality rate, measure longevity and forecast mortality rates of a Ghanaian University Staff Superannuation Scheme. This paper focused on Cairns-Blake-Dowd (2006) model and Holt’s linear trend method. Mortality rates were estimated by the application of the constant force of mortality. The quarterly mortality rates from 2005 to 2016 were estimated to be within 0.18% and 2.5%. Longevity was measured and was found to go with higher ages. Longevity for ages 80 and 90 in 2010 were 0.008015 and 0.008131 respectively. Mortality rates were forecasted at various alpha and beta values at a prediction interval of 95 percentage point. The forecasted mortality rates were shown to decrease with time within the range of 1.05% and 1.54%.
Keywords: Cairns-Blake-Dowd model, Forecasting, Holt’s linear trend method, Longevity, Mortality Rate
Cite this paper: Abigail Yeboah Boateng, Akoto Yaw Omari-Sasu, Derrick Asamoah Owusu, Maxwell Akwasi Boateng, Forecasting Mortality Rate of a Ghanaian University Staff Superannuation Scheme, International Journal of Finance and Accounting , Vol. 6 No. 4, 2017, pp. 111-115. doi: 10.5923/j.ijfa.20170604.03.
Article Outline
1. Introduction
- During the last hundred years, expectancy of life is on the rise from twenty-five (25) to thirty (30) year in most developed countries and this is good from human point of view. Money-connected institutions like pension houses, government pensions and life insurance companies have to face the risk of people living longer than expected. Longevity inherent on retirement and lifetime benefits plan made pension houses and insurers of life pay more than usual as was due to the rise in life expectancy according to Mircea et al (2014). Hence, regulations had to be put in place to keep a balance and take charge of the inherent risks in such plans. The special feature of such insurance products was their long term maturity. Longevity risk implied maturities could reach 50 to 80 years and involve various risks that were to be calculated carefully. From a financial and economic point of view, many improved systems such as retirement bill and the setup of long-term insurance care were introduced as a result of the ageing population. To control longevity, it was important to analyze the sequence of longevity on economic dependence.
1.1. Aims
- A pension fund pay monthly pension benefit to each pensioner starting from the date of retirement and continues until death. The employer and the employee who will be the future beneficiary can finance the pension plan for the employee’s entire working period, however, any shortcomings of the pension funds in the future is normally the employer’s obligation. It is therefore important for the employer with high confidence and precision be able to predict the complete amount that will be needed to cater for future pension duties. Hence the main aim of this research is:Ÿ To estimate mortality ratesŸ To measure longevityŸ To forecast future mortality rates.
1.2. Overview
- The importance and issue of longevity and the risk associated with it has gained international and worldwide recognition. The aggregate of longevity risk is its determined and unchangeable nature; Milevsky et al. 2006. In this research, we will use ‘the two factor stochastic’ mortality model of Cairns-Blake-Dowd (2006) model as the instrument to estimate mortality rates, measure longevity risk and use Holt’s linear method to forecast future mortality rates.
1.3. Related Works
- The Lee-Carter model was commonly used by a lot of people at various places for the careful study of longevity. An article in 2012 by Jindrová & Slavícek, dealt with the growth and the forth telling of life expected at pension by applying Lee-Carter model. Most mortality models were constructed in similar ways. Most especially, when fitted to historical data with one or more varying parameters which is time dependent. By estimating the future of these parameters, we could achieve a forecast for future death probabilities and other demographic quantities such as life expectancies. They are necessary in expressing longevity in pensions as well as been benchmarks for longevity-linked capital markets. (Jan G., 2015)According to Pictacco 2002, uncertainty in mortality and disability trends, from which the longevity in living benefits arise, was discussed. The influences of longevity on life annuities, sickness benefits for the aged and long-term care covers financially are analyzed. Lastly, special care was given to mortality guarantees and flexibility in the made up of life annuities.Creighton et al 2005, demographic transition proceeded regionally and globally the development of a reliable longevity insurance market which was essential. Such need in insurance was most pressing in Asia, however longevity was poorly managed almost everywhere. The theory and practice that related to longevity and insurance about demographic and policy landscape was reviewed by this research. The reasons for the failure of longevity and insurance markets brought about the introduction of new ideas in both markets and public policy that might aid get a vibrant market with greater variety of longevity insurance products were analyzed.According to Shripad2008, for the past hundred years, human life expectancy had increased substantially around the world and longevity in the modern world was largely determined by the age at which adults die. There was longstanding trend to higher average ages at death for both sexes in most countries. The Lee-Carter method could be used for mortality forecasts and provide stochastic projections of average longevity. This does matter to individuals making decisions about consumption, savings, bequests and so on but rather matters to economic aggregates such as population wealth, health, savings and fiscal flows in private and public pensions. Realistic models of annuity valuation were likely to be nonlinear and so annuity values were likely dependent on the individual component of longevity risk. Kogure et al 2009, a Bayesian approach was used to compare models for forecasting mortality rates under the framework of the Lee-Carter methodology. The original normal log-bilinear formulation of the methodology and the recently proposed Poisson log-bilinear formulation were put into consideration. The deterministic trend model, the stochastic trend model and the stationary trend model were compared. Markov-chain Monte Carlo methods were used to sample the predictive distributions to calculate the marginal likelihoods. The Japanese male mortality rate from 1970 to 2003 was used in the application of this model. At the end of the work, the stochastic trend model was most appropriate for forecasting mortality rates both for the normal and the Poisson formulation and then used to evaluate longevity for the population at age 65. Lin and Tzeng 2010 proposed an additive continuous-time stochastic model as a revise of the Ballotta and Haberman (B&H) 2006 model. The structure of the B&H model suggested that the future hazard rate was proportional to the stochastic component. However, an increase in the base hazard rate may not cause a major increase suggested by the exponential component of B&H (2006). The uncertainty of the future hazard rate might not increase with an increase in age. The additive structure which was the sum of a deterministic estimator and a stochastic component was an issue that could be solved. In our model the uncertainty of the future hazard rate would not be affected by an increase in age or in the base hazard rate. The revised model was then used in reserve calculation of longevity risk for pure endowment and other common annuity products. Riemer-Hommel and Trauth 2011, the quest for longevity risk borne pension, annuity and long-term care products had increased very fast and hence led to increase in concerns about how longevity should be managed effectively. This work looked at some possible approaches like finite reinsurance and capital market solutions to improve longevity management. Roy 2012, in his work discussed what longevity was, the importance of it, methods used by the West in longevity management and lessons that could be learnt by Asian countries from the experiences of the West. A major risk that has affected individuals, pension plans, insurers, and governments in both the developed and emerging world are the uncertainty and increased longevity. In this work a further discussion was done in the field of longevity modeling and the merits as well as the setbacks of these models. Barrieu et al 2012 did an investigation into the current developments in longevity risk modeling and seek the major risk management problems for both financial and insurance industries. This paper also discussed the main meanings for the development of longevity, giving a global view of the practical problems for longevity-linked insurance and pension products that had evolved at the same time with increase in life expectancy since 1960. This paper also framed present and future developments that were expected to take action industry-wide, modeled to efficiently assess and manage inherited risks. At the same time the introduction of longevity increased the need for capital markets to manage and transfer risk through Insurance-Linked-Securities (ILS). Similarly Li and O’Hare 2015 proposed that mortality projection in the future was of basic importance to insurance companies, pension providers and government welfare systems as mortality forecasts accuracy were needed to determine the right amount of insurance premiums, pension benefits and contribution rates. Therefore, there was an increasing need to better understand mortality in order to increase the future mortality forecasts accuracy. Various approaches had been made to project future mortality rates of different types of models (Booth and Tickle, 2008). The primary interest of this paper was to study the question of whether local or global information was more appropriate to be used and if should be preferred in mortality forecasting process. The paper used male mortality data of Great Britain from 1950 to 2009 for ages 50-89. At the end of the study, it was realized that, in the forecasting process, local information seemed to have greater predictive power and so it should be given more weight in future mortality projection.
2. Method and Notation
2.1. Method
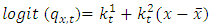
- 2.1.1. The Cairns-Blake-Dowd (2006) model is a mortality stochastic model. The CBD model is good for higher age mortality modeling. Cairns et al. (2006) ‘two factor stochastic mortality model is formulated as
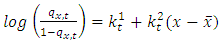 | (1) |
 | (2) |
 Probability that a person age x will die at time t.
 Average of the age range under consideration
  Are the period mortality indexes(Mean and Variance of mortality rates for a period)2.1.2. Holt linear trend is used for forecasting data with either or both seasonality and trend. The method is made up of a forecast equation and two smoothing equations for the level and the trend as described below:
 | (3) |
 | (4) |
 | (5) |
 an estimate of trend also known as slope of series at time t is
  The smoothing parameter
  for level where
  and
and  is the smoothing parameter for trend where
  The time to be forecasted is represented as h. The h-step forecast is equal to the last estimate of level added to h multiplied by the last trend value estimated.
 2.2. Algorithms
- 2.2.1. Notation: The death rate for period x at time t is denoted m (t, x). Therefore
 | (6) |
 The death rate and the mortality rate are near in value to one another. Some relations made for the formalization of the relationship;Ÿ The force of mortality remains unchanged over each time and age. Mathematically expressed as for any given t and x for all
  Then
Then Ÿ The size of the population is assumed to remain unchanged over age and timeBased on the above assumptions, the following implications are made.
 | (7) |
 | (8) |
2.3. Data
- In this paper, a secondary quarterly data of pensioners from 2005 to 2016 for ages 70 to 95 from a Ghanaian University Staff Superannuation Scheme (GUSSS) will be used. The historical data collected was on the number of pensioners per period, pensioners who were still alive and exposed to death and finally pensioners who have died within the period.
3. Results and Discussion
3.1. Results
- Below are the mortality graph from 2005 to 2016, the longevity graphs for 2010 and 2016 and lastly the forecast graph of future mortality rates from 2017 to 2021.
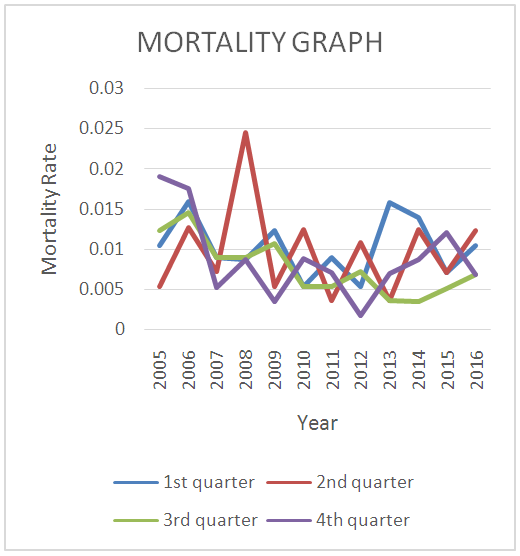 | Figure 1. Mortality Rate from 2005 to 2016 |
3.2. Discussions
- From figure 1, mortality rates increased with increase in death rate. The highest mortality rate observed was 0.024517 which is around 2.5% in the second quarter of 2008 with the number of deaths been 14 out of the 29 total number of deaths for that year. The 14 deaths in that year is also the highest for the period in which the data was collected. The least mortality rate was 0.001768 which is about 0.18% was observed in the last quarter of the year 2012 with 1 person dying out of the 14 people who died in that year. This is the least death for the period the information was collected. All the other mortality rates were within the range of0.18% and 2.5%.From figures 2 and 3, we observed that longevity increased with higher ages and increase in the number of pensioners exposed to death. In 2010 for example, the longevity for age 80 was 0.008015 and that of age 90 was 0.008131 whiles the longevity for 2016 were 0.009174 and 0.009250 for the same ages 80 and 90 respectively.
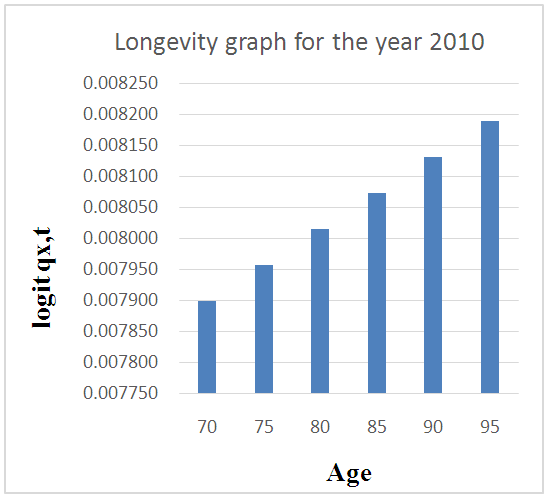 | Figure 2. Longevity graph for the year 2010 |
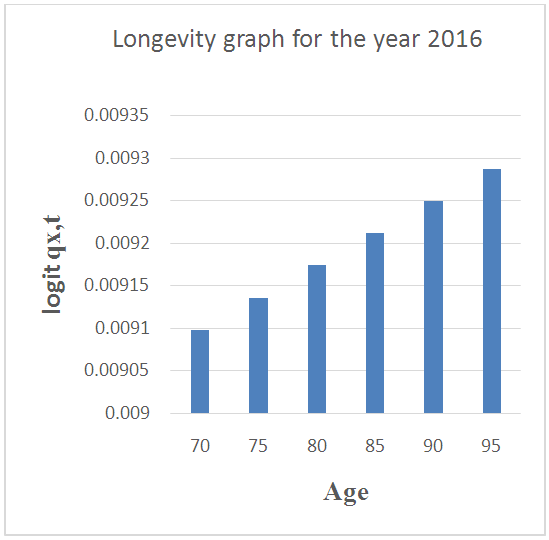 | Figure 3. Longevity graph for the year 2016 |
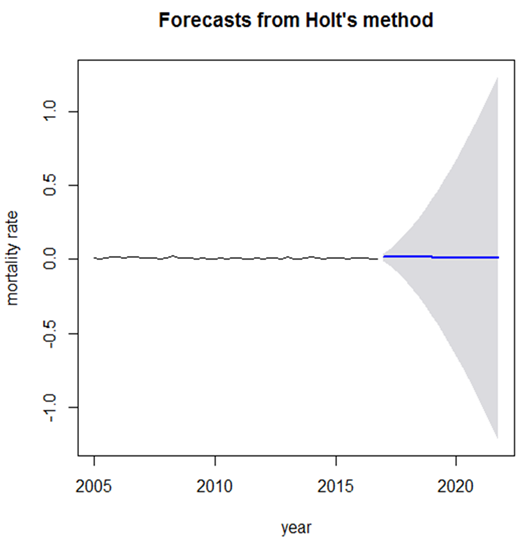 | Figure 4. Forecast of Mortality Rate |
4. Conclusions
- This paper sought to estimate mortality rate, measure longevity and forecast mortality rates. Mortality rates were estimated for each quarter from the data collected from a Ghanaian University Staff Superannuation Scheme.Conclusion drawn from the research was that, mortality rate was dependent on the number of deaths per period.A major conclusion that was observed was longevity goes with higher ages and increase in the number of pensioners in a year which subsequently increase the number of pensioners exposed to death. Hence, as people are ageing, the chance of them been alive for a little while is high. The forecast of the mortality rates were done for twenty periods (quarters) which is for 5 years from 2017 to 2021. At the end of the forecast for the various alpha’s and their corresponding beta’s, it was concluded that alpha=0.05 and beta=0.95 gave the best forecast points with mortality rates within 0.01047086 and 0.01539698 which is approximately 1.05 and 1.54% respectively. Hence mortality rates will be very low in the coming years.