-
Paper Information
- Paper Submission
-
Journal Information
- About This Journal
- Editorial Board
- Current Issue
- Archive
- Author Guidelines
- Contact Us
International Journal of Finance and Accounting
p-ISSN: 2168-4812 e-ISSN: 2168-4820
2017; 6(3): 87-94
doi:10.5923/j.ijfa.20170603.03

The Effect of Economic Growth on Cost Stickiness in Tehran Stock Exchange
 Abstract
 Reference
 Full-Text PDF
 Full-text HTML
Seyed Mohammad Alavinasab, Mohammad Reza Mehrabanpour, Abolfazl Ahmadi
Faculty of Management & Accounting, College of Farabi, University of Tehran, Iran
Correspondence to: Seyed Mohammad Alavinasab, Faculty of Management & Accounting, College of Farabi, University of Tehran, Iran.
| Email: |  |
Copyright © 2017 Scientific & Academic Publishing. All Rights Reserved.
This work is licensed under the Creative Commons Attribution International License (CC BY).
http://creativecommons.org/licenses/by/4.0/

This study attempts to investigate the effect of economic growth on cost stickiness of companies in Tehran Stock Exchange during 2008-2013. In this context, the study examines whether costs behave asymmetrically to demand change and investigates the impact of economic prosperity as well as economic recession on cost stickiness. Statistical population includes all companies listed in Tehran Stock Exchange market for the study period and 100 firms have been selected as the sample group. In order to examine the hypothesis, regression analysis of the panel data has been carried out. The results show that all costs studied, namely selling, general and administrative cost (SG&A), cost of goods sold (COG) and operating costs (OC) behave asymmetrically to demand change where all three costs were sticky during 2008-2013. Also, results reveal that the behavior of all three costs were sticky during the prosperity period (2008-2010). In addition, results indicate that all three costs behave anti-sticky during the recession period (2010-2013). Thus, the regression analysis results confirm the three study hypothesis. Further, the results indicate that costs are more stickness in prosperity period as compared to recession period.
Keywords: Cost stickiness, Cost behavior, Economic growth
Cite this paper: Seyed Mohammad Alavinasab, Mohammad Reza Mehrabanpour, Abolfazl Ahmadi, The Effect of Economic Growth on Cost Stickiness in Tehran Stock Exchange, International Journal of Finance and Accounting , Vol. 6 No. 3, 2017, pp. 87-94. doi: 10.5923/j.ijfa.20170603.03.
Article Outline
1. Introduction
- The traditional model of cost behavior assumes that variable costs change proportionally and symmetrically with changes in the activity volume. The recent empirical research on asymmetric cost behavior give a new way of thinking about costs. Anderson et al. (2003) discovered that selling, general and administrative costs do not increase or decrease with the same volume of changes in sales revenue. They interpret this phenomenon as cost stickiness phenomenon. Cost stickiness phenomenon is defined as the degree of increase in costs with the volume of sales increase is larger than the degree of decrease in costs with the same volume or sales decrease. The phenomenon of cost stickiness occurs because managers tend to adjust deliberately their resources committed to activities (Anderson et al., 2003). Adjustment costs are costs to reduce or restore committed resources. Chen et al. (2012) discuss cost stickiness can also arise with managerial empire building incentive as a consequence of conflict of interest between managers and shareholders. In order to chase their personal benefits, managers have little incentives to optimize the operating efficiency of companies. Managers may retain unutilized costs which are beneficial for their compensation and reputation. Thus, managers could make decisions to retain costs away from the optimal levels, which would give rise to cost stickiness phenomenon. Or of cost stickiness. For example, Anderson et al. (2003), Subramaniam & Weidenmier (2003), Balakrishnan et al. (2004) and Calleja et al. (2006) indicated that cost stickiness is determined by firm specific characteristics that capture organizational constraints on resource adjustment such as asset intensity and employee intensity. Anderson et al. (2003) argued that cost stickiness is affected by the timing of the activity decrease. Authors identified a successive decrease in revenues is a determinant of cost stickiness. Anderson et al. (2003) also discussed economic growth of a firm is a determinant of cost stickiness. Their findings show that managers are less willing to reduce committed resources in periods of macroeconomic growth than in other periods, resulting in more cost stickiness. The argument for this is that managers consider a revenue decline in a period of macroeconomic growth to be more transitory than a revenue decline in a period of macroeconomic contraction. Accordingly, this paper attempts to examine the effects of economic growth on cost stickiness of companies in Tehran Stock Exchange.The remainder of this paper is organized into four sections. Section II outlines the prior research. Section III describes our empirical design for analysis. Section IV reports emperical results and conclusions are presented in the last section.
2. Literature Review
- Anderson et al. (2003) introduced the concept of a sticky cost behavior. They examined cost behavior by using selling, general, and administrative (SG&A) costs and sales revenue of 7,629 firms over 20 years period (during 1979–1998). The authors found that SG&A costs are sticky; SG&A costs increased 0.55% per 1% increase in sales revenue but decreased only 0.35% per 1% decrease in sales revenue. In the wake of Anderson et al.’s (2003) seminal work, a number of studies document factors determining the degree of asymmetry in cost stickiness. Subramaniam and Weidenmier (2003) explore cost stickiness is related with different ranges of activity changes. The use of Anderson et al.’s model has resulted with finding that SG&A costs were stickier than COGS. Also, authors found that "sticky parameters" are not negative or significant for revenues change less than 10%, but beyond 10% change almost all parameters were negative and significant. Medeiros and Souza Costa (2004) analysed costs stickiness for 198 Brazilian publicly listed companies in period 1986-2003. By replicating Anderson et al. methodology authors found that SA&G costs for sampled Brazilian companies were sticky. Surprising finding was the fact that cost stickiness increased when data was aggregated for two, three and four years, which means that cost stickiness gets worse in longer periods. Hypothesis on lagged adjustment of SG&A costs was rejected, while partial reversion hypothesis of stickiness was accepted. Balakrishnan et. al. (2004) in their research focus on capacity utilization and analyses the sample of 49 physical therapy clinics during the period 1994-1997. The authors proved that respond to decrease of activity should be higher than response to increase of activity if company is having excess capacity. Based on this finding, they concluded that Anderson et al.'s study on cost stickiness should be interpreted with caution since cost stickiness may be feature only for the firms with strained current capacities. Yang, Lee, and Park (2005) inspected cost behavior of Korean general hospital, and found total costs, labor cost and administrative costs are sticky. The results provided strong support that the more hospitals have assets intensity or employees intensity, the more costs are sticky.Calleja et al. (2006) used data for a sample of US, UK, French and German companies. The results found costs are stickier for French and German companies than for US and UK companies due to differences in the corporate governance regimes across these four countries. Banker and Chen (2006) examining cross-country differences in the sticky behavior of operating expense; using a sample 12,666 firms from 19 countries that are members of the Organization for Economic Co-operation and Development (OECD) during the period 1996-2005. They document that the degree of stickiness in operating expense varies significantly across firms in different countries. The study provides strong empirical support that labor market characteristics are important determinants of a cross-country variations in the degree of cost stickiness. Anderson and Lanen (2007) found weak evidence of sticky costs. They revised the estimated models of previous research and considered the foundational model of economic production. Their paper suggested that the problem is in “ambiguity about what defines managerial discretion (cost management) and how managerial discretion about redeploying verves releasing resources interacts with recording costs in the accounting system…”.Kama and Weiss (2010) put focus on managers' intention to meet earnings target. Research was done on the sample of listed US companies for period 1979-2006 and the obtained results suggested that the incentives to meet earnings targets (to avoid losses and/or avoid earnings decreases) lead to deliberate resource adjustments that diminish cost stickiness.Koo et al. (2011) showed that behaviors of total costs, total manufacturing costs, SG&A costs, and labor costs are different for firms with different earnings management incentives under different reported earnings levels.Canoon (2011) studied the determinant factors of the cost stickiness in American aviation companies. The results showed that if the final cost of increasing capacity when demand increases, are more than reducing capacity when demand is greater than the marginal benefit, stickiness costs were increased and since the price product reduction when reducing demand, are more than the increase in cost when demand increases, the price of costs stickiness reduces in reducing demand.Cannon (2014) investigated the factors affecting costs stickiness in cost behavior in the aviation industry in the United States of America and concluded that at the time of increase in demand management to increase capacity and at a time when demand is reduced excess capacity to hold directors which lead to the cost stickiness. Awad E. A. Ibrahim (2015) indicated that the costs including SG&A, COGS and OC, respond asymmetrically to demand change, where both the SG&A and COGS were sticky, but OCs were anti-sticky. The nature and magnitude of the asymmetric cost behavior also differed in contrasting economic conditions; in the prosperity period before the 2008 financial crisis, SG&As were sticky, but anti-sticky in the recession period after the 2008 financial crisis. In addition, for a 1 per cent demand increase, SG&As increased more in the prosperity period than in the recession period. In addition, for a 1 per cent decrease in demand, SG&As decreased by a larger extent in the recession period after the financial crisis than in the prosperity period before the financial crisis.Namazi and Davanipour (2010) studied the real behavior of cost stickiness in the Tehran stock exchange. They found that the intensity of cost stickiness decreased as income decreased and that this intensity was higher in companies having more total assets against sales.Poorzamani and Bakhtiary (2012) investigated the impact of the inflation rate, and short-term and long-term interest rates on operating cost stickiness (OCS) in the Tehran stock exchange. They found that there is a meaningful negative relation between inflation rate and operating cost stickiness, a meaningful positive relation between short term interest rates and OCS, but no meaningful relation between long-term interest rates and OCS.Kurdestani and Mortazavi (2013) in a study evaluated the effects of decisions made by managers on the costs stickiness in Tehran Stock Exchange. The results showed that the expected increase in future sales by management, cause to reduced cost stickiness of prime sales and how the optimism is greater; reduction of prime cost stickiness is greater. But management optimism was increased, sales, general and administrative cost stickiness and stickiness of these costs in management high optimism, are more than a little optimism that is strong evidence for confirmation of the hypothesis of wise decisions about selling, general and administrative cost.
3. Methodology
- This study in terms of objective is an applied research and based on data collection method is a descriptive correlational study. It is a descriptive research because it is trying to describe a situation or considering phenomenon and to understand the present situation and the correlation between the variables.
3.1. Hypotheses
- This paper aims to examine the effect of economic growth on cost stickiness of companies in Tehran Stock Exchange during 2008 - 2013. In this context, study investigate whether costs behave asymmetrically to demand change and examine the impact of eccomic prosperity on cost stickiness during 2008-2010 as well as influence of econoic recession during 2011-2013. For this purpose, the following hypotheses have been peresented: 1) The cost respond asymmetrically to an equivalent sales change. The increase in costs for a 1% sales increase is different from the decrease in costs for a 1% sales decrease. 2) During the economic prosperity period, the increase in costs is larger than their decrease for a 1% change in demand, that is they are sticky and 3) During the economic recession periods, the decrease in costs is larger than their increase for a 1% change in demand, that is they are anti-sticky.
3.2. Data and Sample Selection
- Required data was collected from financial statements, explanatory noted, reports from Tehran Stock Exchange and by visiting the website of Informatics Bourse Company, site of Research Management, Development and Islamic Studies, and site of Tehran Stock Exchange. To analyze data of the research, descriptive and inferential statistics were adopted. For estimation of research models Panel Data method was used and E. views computer software, version 8 have been used for results derivation.Statistical population includes all companies listed in Tehran stock exchange market during the years 2008 to 2013. In order to select the sample following criteria have been considered: 1) Companies with the same financial period and leading up to the end of the year 2) Being active during the time domain between 2008-20133) Completeness and availability of their data bank from 2008 to 20134) Having the complete information for financial statements such as balance sheet of profit and loss and cash flow.5) Not being among the intermediary institutions, investments, financial and insurance institutionsAccording to the above conditions, 100 companies were selected.
3.3. Model Specification
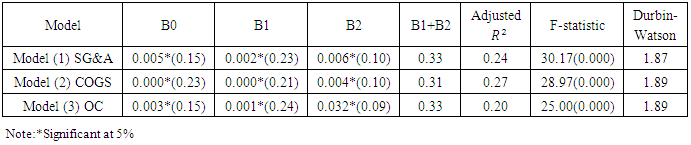
- The paper utilizes econometric techniques to test research hypotheses based on Anderson et al.’s (2003) model as follows:Model (1): SG&A Log(SG&Ai,t/SG&Ai,t-1) = B0+B1 × Log(Salesi,t/Salesi.t-1) + B2 × DecDummy × Log(Salesi,t/Salesi.t-1) + εi,tModel (2): COGS Log(COGSi,t/COGSi,t-1) = B0 + B1 ×Log(Salesi,t/Salesi.t-1) + B2 × DecDummy × Log(Salesi,t/Salesi.t-1) + εi,tModel (3): OC Log(OCi,t/OCi,t-1) = B0+B1×Log(Salesi,t/Salesi.t-1) + B2 × DecDummy × Log(Salesi,t/Salesi.t-1) + εi,tWhere SG&Ai,t = selling, general and administrative costs for the firmi at the time t. COGSi,t = cost of goods sold for the firmi at the time t. OCi,t = operating costs for the firmi at the time t. Salesi,t = net sales for the firmi at the time t. Log(SG&Ai,t/SG&Ai,t-1) = natural logarithm (selling, general and administrative costs in current year divided by the selling, general and administrative costs in prior year). Log(COGSi,t/COGSi,t-1) = natural logarithm (cost of goods sold in current year divided by the cost of goods sold in prior year).Log(OCi,t/OCi,t-1) = natural logarithm (operating costs in current year divided by the operating costs in prior year).Log(Salesi,t/Salesi.t-1) = natural logarithm (net sales in current year divided by net sales in prior year).DecDummy = dummy variable that takes the value of 1, and if the current net sales are less than the prior year net sales, it takes the value 0 otherwise.
4. Emperical Results
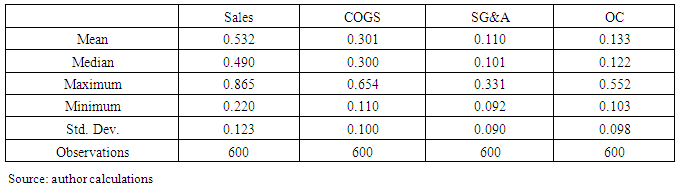
4.1. Descriptive Results
- Descriptive statistics of the variables are shown in Table 1. All variables for the homogenization divided by the asset of beginning of period. Following amounts only provide a general overview of the research data.
|
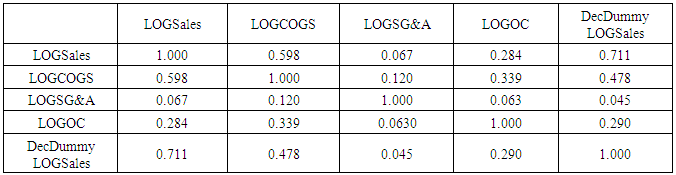
4.2. The Correlation Coefficient Test
- As shown in table 2 there is no severe collinearity between research variables.
|
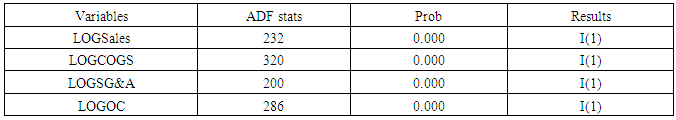
4.3. Unit Root Test
- Dickey Fuller unit root test results in table 3 show that prob of variables are less than 5% percent and research variables are stationary at first difference.
|
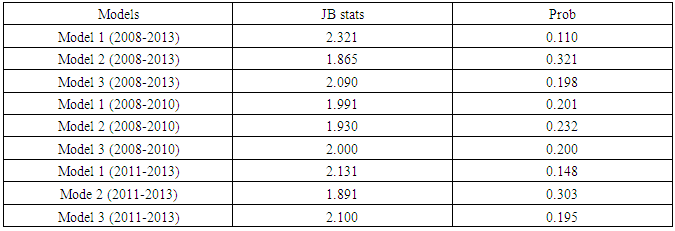
4.4. Normality Test
- The normality test adopted the Jarque-Bera (JB) Test of Normality. As shown in table 4 the residuals are also normally distributed as Jarque-Bera test of normality fails to reject the null of normally distributed residuals.
|
5. Hypotheses Results
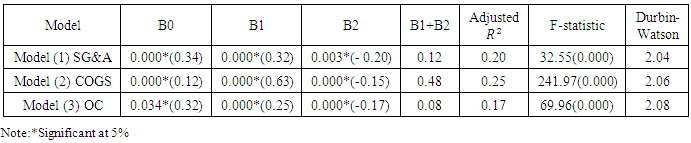
5.1. First Hypothesis
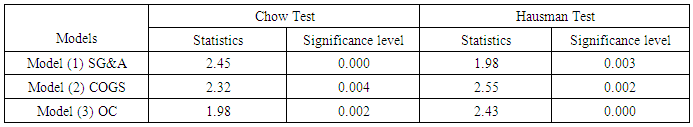
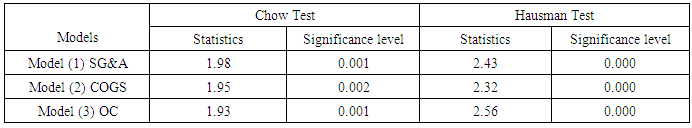
- To confirm the suitability of panel data method, we have used Chow and Hausman tests. Table 5 shows the result of Hausman test. Results shows that significance level of F statestics is less than 5 percent. Hence, H0 hypothesis rejected and based on Chow and Hausman tests, Fixed Effects Model must be used for model estimation.
|
|
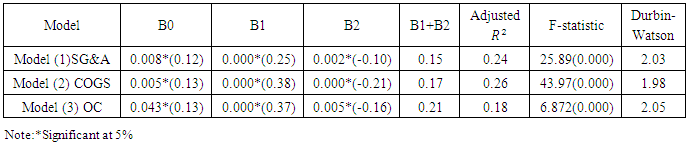
5.2. Second Hypothesis
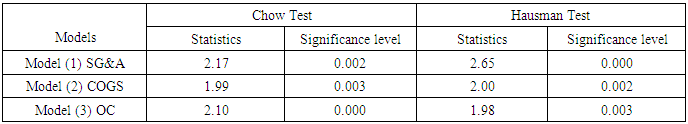
- We have used Chow and Hausman tests to confirm the suitability of panel data method. The results of these tests are presented in Table 7 Results show that significance level of F statestics is less than 5 percent. Hence, H0 hypothesis rejected and based on Chow and Hausman tests, Fixed Effects Model must be used for model estimation.
|
|
5.3. Third Hypothesis
- To confirm the suitability of panel data method we have used Chow and Hausman tests. The results of these tests are presented in Table 9. Results show that significance level of F statestics is less than 5 percent. Hence, H0 hypothesis rejected and based on Chow and Hausman tests, Fixed Efcfects Model must be used for model estimation.
|
|
6. Conclusions
- This study aims to examine the effects of economic growth on cost stickiness of companies in Tehran Stock Exchange. During 2008-2013, findings indicate that all costs studied, SG&A, COG and OC behave asymmetrically to demand change where all three costs were sticky. Thus, the regression results of three models confirm the first research hypothesis. The results of the research hypotheses tests are in line with many recent studies on cost-stickness. For example, Anderson et al., 2003, and Calleja et al., 2006, in recent years, have shown that the increase in costs during an increase in activity level is greater than the reduction in costs when the volume of activity is reduced. Also, Weiss (2010) showed that if sales revenue increased by 15%, costs would increase by 10%, but if the same sales revenue dropped by 15%, the costs would fall by less than 10%. In such a situation, the behavior of costs will be sticky. These results are consistent with our research findings. Our research shows that with the increase in sales, company costs have increased, but with such a decrease, such a decrease is not observed; in other words, cost behavior is not symmetric and has a stickiness. The results of our research are also consistent with the results of Namazi and Davanipour (2010), Namazie et al. (2012), Kordestani and Mortezavi (2012); they showed that administrative, general, and sales costs are sticking. In this study, we examined the impact of economic conditions, that is, we examined whether the prosperity and economic recession could affect managers' decisions. Findings for the prosperity period (2008-2010) also reveal that the behavior of all three costs, SG&A, COGS and OC were sticky. Therefor, the regression results of three models affirm the second study hypothesis. In addition, findings for the recession period (2011-2013) show that all three costs, SG&A, COGS and OC behave anti- sticky. Thus, the result of three models is consistent with the third study hypothesis in economic recession. As a result, the regression analysis results confirm the three study hypothesis. Further, findings indicate that costs are more stickness in prosperity period as compared to recession period. This may be caused from it during the economic prosperity managers believe that the decline in demand is temporary, but increasing demand growth is sustainable; thus costs may experience more stickiness. The results of our study contradict the results of Kurdistan and Mortazavi (2012), which showed that economic growth has no effect on cost stickiness. But it is consistent with the results of Ebrahim's research (2015), which examines the impact of economic growth on cost stickiness in Egypt. According to the results of the hypothesis testing, it is suggested to investors and shareholders that getting familiar with the concept of cost stickiness and pay attention to them in decision making. Because, according to the results, companies that have high cost stickiness, when their sales are reduced, their costs change less than time of increasing sales, which, from the point of view of investors and shareholders, will be considered as weaknesses in management, while one of the most important reasons for cost stickiness is to bear current costs in order to prevent further losses or to make more profit in the future. Managers are also advised when planning and budgeting company activities to anticipate future costs, considering cost stickiness and its severity to provide more comprehensive budgeting and more accurate predictions. Also, auditors and audit firms considering the cost stickiness and the process of changing costs with changes in sales and sales revenue to discover any errors or fraud in the presentation of financial statements. The most important limitations of this research are as follows: first, due to some selective criteria (such as the fiscal year ending in March, the unchanged fiscal year, etc.) in the selection of companies, as well as the incompleteness of the data of some companies, the number of companies surveyed decreased to 100; therefore, the generalization of the results of this research to other companies must be cautious. Second, among the other constraints of this research, the specific feature of semi-experimental research is the lack of control over some of the factors affecting the results of the research, including the effects of variables such as economic factors, the status of the global economy, etc. that are beyond the reach of the researcher and may be effective on results of the research.