-
Paper Information
- Paper Submission
-
Journal Information
- About This Journal
- Editorial Board
- Current Issue
- Archive
- Author Guidelines
- Contact Us
International Journal of Finance and Accounting
p-ISSN: 2168-4812 e-ISSN: 2168-4820
2016; 5(5): 221-227
doi:10.5923/j.ijfa.20160505.01

Modeling Volatility Transmission in Intra-National Markets of Frontier Economies Using Multivariate GARCH Framework: Evidence from the Nigerian Stock and Bond Markets
 Abstract
 Reference
 Full-Text PDF
 Full-text HTML
S. Bichi , H. G. Dikko, A. P. Nagwai
Department of Mathematics, Ahmadu Bello University, Zaria, Nigeria
Correspondence to: S. Bichi , Department of Mathematics, Ahmadu Bello University, Zaria, Nigeria.
| Email: |  |
Copyright © 2016 Scientific & Academic Publishing. All Rights Reserved.
This work is licensed under the Creative Commons Attribution International License (CC BY).
http://creativecommons.org/licenses/by/4.0/

The study adapted the two most popularly use Multivariate GARCH models – the Baba-Engle-Kraft-Kroner (BEKK)- Generalize Autoregressive Conditional Heteroscedasticity (GARCH) model and the Dynamic Conditional Correlation (DCC)- GARCH model in modeling the volatility spillover between the Nigerian Stock and Bond Market. The study modeled the volatility transmission between the two markets using the BEKK form and the DCC form separately. We discovered that the own past shocks affect the current volatility of the Nigeria stock market and a bidirectional volatility spillover between Nigerian stock and bond markets. We further compared the fitting performance of these two Multivariate GARCH forms and the results reveals that the DCC is the most appropriate model for modeling intra-national volatility transmission in frontier economies, however, according to this analysis this is only valid for the Nigerian stock and bond markets.
Keywords: Volatility spillover, Multivariate framework, Stock Market, Bond Market, Transmission
Cite this paper: S. Bichi , H. G. Dikko, A. P. Nagwai , Modeling Volatility Transmission in Intra-National Markets of Frontier Economies Using Multivariate GARCH Framework: Evidence from the Nigerian Stock and Bond Markets, International Journal of Finance and Accounting , Vol. 5 No. 5, 2016, pp. 221-227. doi: 10.5923/j.ijfa.20160505.01.
Article Outline
1. Introduction
- Frontier and emerging markets both falls into the same wide-ranging sector of the global flea market, however, the two markets are different both in terms of liquidity and in terms of stability among others. Though some emerging markets have matured to the point where they are moving at least in tandem with some develop markets, but have recently failed to provide the level of diversification that they once did. Additionally, the frontier markets have slowly but surely started to step in and fill this gap for long-term investors seeking a return on their capital that is largely uncorrelated with the rest of the global economy. Despite the growing attention to frontier markets among the investment community, very little research is carried out on their intra-market volatility transmission. Several empirical studies examining the international and intra-national volatility transmission are focused usually within one asset class and stock markets with few literature focused on volatility across the bond markets. Multivariate GARCH (MGARCH) models have proven to be successful in capturing volatility spillovers and co-movements across markets. They are applied in examining whether the volatility of a particular market leads to the volatility of other markets and whether a shock on a market increases the volatility on another market. In this study, we model the volatility transmission between the Nigerian stock market and the Nigerian bond market using the two most widely used Multivariate GARCH framework- the Baba-Engle-Kraft-Kroner (BEKK)- Generalize Autoregressive Conditional Heteroscedasticity (GARCH) model and the Dynamic Conditional Correlation (DCC)- GARCH model. The two MGARCH framework were applied to modeling the market separately, and their fitting performance was further compared using the selection criteria, Akaike’s Information Criterion (AIC) and Schwarz’s Bayesian Information Criterion (SBC). Many literature have applied the MGARCH framework in modeling volatility co-movement and spillover across several markets. However, to the best of our knowledge, this paper is the first to attempt to model empirically the transmissions of volatility between the Nigerian stock and Bond market. The paper is organized as follows: Chapter 2 provides the review of previous literature, Chapter 3 describes the GARCH modeling framework that are employed, and Chapter 4 gives summary of the statistics and interpretation of result. While chapter 5, provides summary and conclusions.
2. Literature Review
- Multivariate GARCH models were originally developed between late 1980s and early 1990s. It, VECH model was a straightforward generalization of the univariate GARCH model (Bollerslev et al., 1988). However, the VECH model consist a large number of parameters which estimation is computationally demanding. In order to address this challenge, Engle et al., (1990) introduced the first Factor GARCH model. The Factor model assumes that observations are generated by underlying factors that are conditionally heteroskedastic and possess a GARCH-type structure. However, the model was discovered to perform poorly on low and negative correlations and in Alexander (2000), factors accounting for volatility are limited. The Baba-Engle- Kraft-Kroner (BEKK) as defined in Engle and Kroner (1995) is a general quadratic form for the covariance equation that is also viewed as the restricted version of the VECH model. It successfully address the problem of positive definiteness of the VECH model though challenged with high number of parameters. In 1990, Bollerslev proposed the Constant Correlation (CC) model, the model that allows volatility time-varying but restricts the conditional correlations (conditional correlations time-invariant). In 1999, Tsui and Yu revealed that the assumption for constant correlation is not very generous and can be rejected for some assets. Subsequently, the Dynamic Conditional Correlation (DCC) was introduced by Engle (2002). It allows the conditional correlation to be time-varying while maintaining the plausibility of the CC model. Capiello, Engle and Sheppard (2003) were one of the first to make contributions or work on DCC model, they looked at the average dynamic correlation of individual variables as representatives of regional dynamic conditional correlations. Ling and Dhesi (2010) stated that the specification of the univariate GARCH is generous to any GARCH process with normal distribution that satisfies the non-negative constraints and the stationary condition. It is motivated by one of the phenomenon in multivariate modeling, modeling of unequal durations of different datasets. While comparing DCC with the BEKK model, it is establish that, the prominent strength of the DCC model is that it does not suffer dimension hindrance and could be applied to any dimension. This is because the estimation can be decomposed into two steps. However, the DCC model imposes more restrictions on the type of dynamic effects than the BEKK model. Specifically, the conditional variance of returns only depends on the past squared returns, some of which can cause the “volatility spillovers” to be excluded Micheal (2010). Most scholars choose the BEKK model to capture the volatility spillover effects and the DCC model to measure the dynamic conditional correlations.Some empirical applications of the MGRACH framework- DCC model (Kuper and Lestano (2007)) revels correlation between financial markets and certain degree of interdependence among countries, while examining financial markets in Thailand and Indonesia. Hoon and Yoon (2013), examined the price returns and volatility linkages between the foreign exchange and stock markets in Korea, using the co-integration test and bi-variate GJR-GARCH (1,1) model based on the BEKK approach.Pelinescu (2014) applied MGARCH-BEKK on the exchange rate for Romanian, Polish, Czech Republic; and found that covariance correlation is higher in the case of the European market (Romanian, Polish and Czech Republic). Ferreira et al., (2014) also used MGARCH-BEKK to model volatility transmission between Brazilian and American stock market. They found evidence of contagion in the indices of Brazil’s stock market, increase in the correlation between the indices of the U.S. and Brazilian markets.Bekiros (2014) applied CCC, DCC MGARCH, and BEKK to model currency and stock markets for firms in Taiwan and found ambiguous situation of volatility size effects of the returns to stock prices for large and small firms. Olson et al., (2014) used BEKK, CCC, DCC, VIRF to model volatility transmission between Goldman Sach’s Energy Index and the S&P, he discovered Low S&P 500 returns cause substantial increases in the volatility of the energy index; a weak response from S&P 500 volatility to energy price shocks. Other interesting empirical studies contributions on examining volatility spillovers effects could be found in, Bae et al., (2003), Lee (2006), Skintzi and Refenes (2006), Fedorova and Saleem (2010), Emenike (2013), and Turkyilmaz and Balibey (2013) e.t.c.
3. Methodology
3.1. Data
- The data used in this study are weekly observations on the Nigerian Stock Exchange (NSE) share price index, and weekly observations of the 10-year Federal Government (FGN) bond yield from August 6, 2010 to December 3, 2015, representing the returns from Nigerian stock and bond markets respectively. The data for the NSE share price index and 10-year FGN bond returns are available on http://www.tradingeconomics.com
3.2. Computation of Return Series from Price
- Each compounded weekly return of each series of each index is generated as follows;
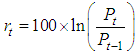 | (1) |
 are price index on week t and t-1 respectively, and ln is the natural logarithm.
3.3. Baba–Engle–Kraft–Kroner (BEKK)
- A model of the conditional covariance matrix that can be view as a restricted version of the VEC model is the Baba-Engle-Kraft-Kroner (BEKK) defined in Engle and Kroner (1995). It has the attractive property that the conditional covariance matrices are positive definite by construction. The first step in the multivariate GARCH methodology is to specify the mean equation. Thus, the mean equation for return series is specified as follows:
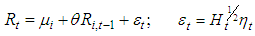 | (2) |
 is a vector of returns of the Nigerian stock and Bond markets respectively, θ refers to a 2 x 2 matrix of coefficients,
  is the vector of error terms of conditional mean equation for stock and bond markets returns respectively.
  is a sequence of independently and identically distributed (i.i.d) random errors;
  is conditional variance-covariance for both market returns.The second step is specifying the conditional variance-covariance equation. Thus, the BEKK representation of Multivariate GARCH (1,1) model is given by:
 | (3) |
 is the conditional variance matrix, C is an upper triangular
  matrix, B is a
  square matrices of parameters which depicts the extent to which current levels of conditional variance are related to past conditional variances. A, a
  square matrix that measures the extent to which conditional variances are correlated with past square errors. The elements of parameter matrices, A, B and C are express as follows:
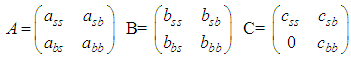 | (4) |
 is evidence of impacts of own past innovations on the current volatility in either the stock or bond market and the significance of
  is evidence of influence of past volatilities on current volatility in the stock or bond market. While the significance of the off-diagonal parameters
 shows evidence of cross-volatility shocks between the stock and bond market, and
  is evidence of cross volatility spillover between the two markets considered.
 3.4. Dynamic Conditional Correlation MGARCH (DCC-MGARCH)
- The DCC model, proposed by Engle and Sheppard (2001) and Engle (2002), is a new class of multivariate model, which is particularly well suited to examine correlation dynamics among assets. The DCC approach has the flexibility of univariate GARCH but without the complexity of a general multivariate GARCH. As the parameters to be estimated in the correlation process are independent of the number of series to be correlated.Following Bollerslev (1990), Engle and Sheppard (2001) and Engle (2002), we start our empirical specification with the assumption that stock market return and bond markets (US and Nigeria) returns are multivariate normally distributed with zero mean and conditional variance-covariance matrix
 . Our multivariate DCC-GARCH model can be presented as follows:
 | (5) |
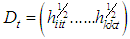
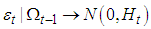 where, rt is the (k×1) vector of the returns, εt is a (k×1) vector of zero mean return innovations conditional on the information, Ωt-1 available at time t-1 and the conditional variance-covariance matrix (Ht) in the DCC model can be expressed as:
 | (6) |
 | (7) |
 | (8) |
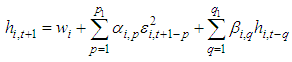
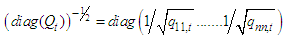
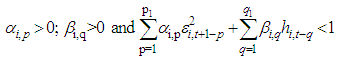 should be imposed. These univariate variance estimates are then used to standardize the zero mean return innovations for each asset.In the second stage, stock return residuals are transformed by their estimated standard deviations from the first stage. That is
 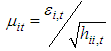 where μit is then used to estimate the parameters of the conditional correlation. The evolution of the correlation in the DCC model is given by:
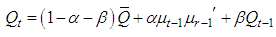 | (9) |
 | (10) |
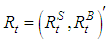
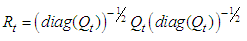
 Finally, the conditional correlation coefficient ρij between two assets i and j is then expressed by the following equation:
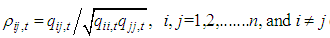 | (11) |
 | (12) |
 the parameters in Rt, then the log likelihood function is given below:
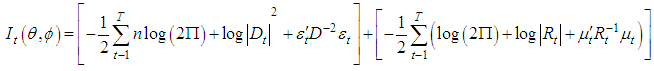 | (13) |
4. Results and Discussion
4.1. Descriptive Statistics of Weekly Return Series
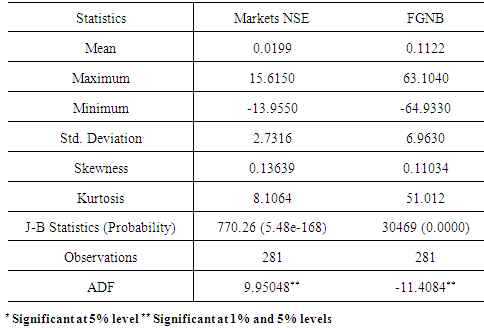
- Table 1 contains summary statistics for the returns series in each of the markets. The sample mean in all of the returns are positive and statistically significant because they differ from zero and the standard deviation in all the cases are greater than the mean, indicating the variables are within the returns (NSE: 2.7316 and FGNB: 6.963). All return series display non-zero skewnes, the degree of peakedness as indicated by the values of the kurtosis showed that all the returns are more peaked than the normal distribution curve and the Jarque-Bera test results are not significant at 0.01 and 0.05 significance levels, suggesting that the return series for all the markets are not normally distributed. Finally, the calculated values of the ADF test statistics indicate that the level series does not contain a unit root at the 1% and 5% significance levels, implying that the return series are stationary.
|
|
4.2. Discussion of Main Result
4.2.1. MGARCH (1,1)-BEKK Results
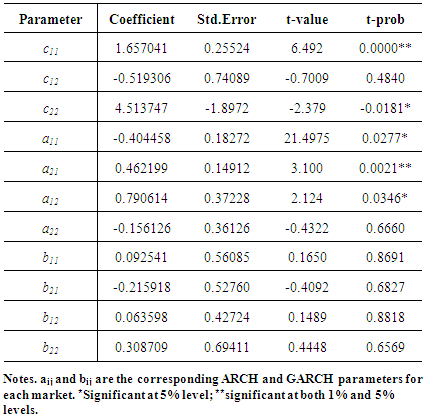
- The results of the Multivariate GARCH (1,1)-BEKK is shown in Table 3 below. Notice from Table 3 that the estimates of all the diagonal parameters, only is significant at 5% significant level, indicating that the own past shocks affect the current volatility of the Nigeria stock market. However,
 and
and  are all not statistically significant at both 5% and 1% significant levels, suggesting that own past volatility does not affect the current volatility of the stock and bond markets in Nigeria.
|
 and
and  are significant at 5% significance level, showing evidence of bi-directional shock transmissions between the Nigerian stock and bond markets. These results are similar to the findings in Xiao and Dhesi (2010), Gomes and Chaibi (2014), and Lin et al., (1994). Particularly in Lin et al., (1994), they discovered own market volatility spillover effect in all Eastern European bond markets and lead-lag relationship between US and Latin America bond markets.
4.2.2. MGARCH DCC (1,1) Results
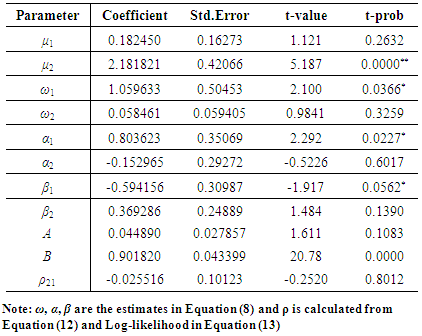
- Finally, Table 4 reports the results of estimating the complete MGARCH DCC model for Nigerian stock and Bond markets. The bivariate DCC model applied in the analysis allows for a time varying correlation structure. The coefficient μ corresponds to the mean equation parameter, while α and β represents the conditional variance of NSE versus FGN Bond. As reflected in the Table 4, all parameters are positive except for α1 and β2. Only 3 parameters are found to be significant at either 5% or 1% or both levels of significance. The significance of mean equation parameter μ shows the dependence of returns on their lag returns. Furthermore, the volatility persistence in these markets is measured by (α + β), and looking at Table 4, the sums of the variance equation parameters αii and βii are not close to 1, indicating rather weak persistence in conditional variances. The estimated conditional correlation is negative (-0.025516) and very weak, reflecting a weak negative relationship between the Nigerian Stock and Bond Markets. This suggests that the stock and bond volatility tend to move in opposite directions, similar to the finding in Fleming et al. (1998), where the correlations of the short and long term yield volatilities and stock market volatility have reversed in sign during the sample period, they tend to move in opposite directions. These could be as a result of the liquidity in bond markets, which can hinder co-integration with stock returns. Furthermore, the sum of “a” and “b” is equal to 0.94671. Therefore
 proves the process described by the model is said to be mean reverting. The implication behind this is that after a shock occurs, the correlations will in time return to the long-run unconditional level.
|
4.3. Model Adequacy Checking and Model Selection
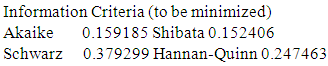
- We compared the two models applied according to their goodness-of-fit statistics, namely Akaike’s Information Criterion (AIC) and Schwarz’s Bayesian Information Criterion (SBC) (shown in appendix A and B), and the DCC model was indeed the best performer, showing the smallest values for both criteria.
5. Conclusions
- This study had examined the weekly return volatility spillover between stock and bond markets of frontier economies and between bond markets of frontier and developed economies. We discovered a bi-directional volatility shock transmission between the stock and bond markets. The performance evaluation carried out revealed that the DCC is most suitable for the stock and bond markets of frontier economies (Nigeria).This study contributes to intra-market relationships in the frontier economy, as the selected markets in the country for this study has to the best of our knowledge, not been used before. Revealing the unique results gained and bridging the gap in literature. In all, the findings are very crucial and informative to investors and intending investors who might want to invest in the Nigeria’s financial markets and for policy formulation by the federal government on Nigeria.
Appendixes
- Appendix A: Information Criteria for BEKK for Nigerian Stock and Bond Markets
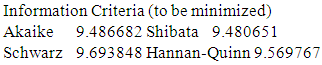 Appendix B: Information Criteria for DCC for Nigerian Stock and Bond Markets