-
Paper Information
- Paper Submission
-
Journal Information
- About This Journal
- Editorial Board
- Current Issue
- Archive
- Author Guidelines
- Contact Us
International Journal of Finance and Accounting
p-ISSN: 2168-4812 e-ISSN: 2168-4820
2016; 5(4): 165-170
doi:10.5923/j.ijfa.20160504.01

Hedging Longevity Risk using Longevity Swaps: A Case Study of the Social Security and National Insurance Trust (SSNIT), Ghana
 Abstract
 Reference
 Full-Text PDF
 Full-text HTML
A. Y. Omari-Sasu1, D. Asamoah Owusu1, M. A. Boateng2, I. Tettey1
1Mathematics Department, Kwame Nkrumah University of Science and Technology, Kumasi, Ghana
2Engineering Department, Ghana Technology University College, Kumasi, Ghana
Correspondence to: M. A. Boateng, Engineering Department, Ghana Technology University College, Kumasi, Ghana.
| Email: |  |
Copyright © 2016 Scientific & Academic Publishing. All Rights Reserved.
This work is licensed under the Creative Commons Attribution International License (CC BY).
http://creativecommons.org/licenses/by/4.0/

Effective management of longevity risk is essential for every institution which is exposed to longevity risk. Defined benefit schemes in Ghana are especially exposed to longevity risk due to increasing life expectancy in Ghana. In this study we explore a hypothetical hedging strategy based on longevity swaps for the SSNIT pension scheme. We use the Cairns-Blake-Dowd model to forecast future mortality rates of pensioners from age 71 to 90. With the forecasted mortality rates, longevity swap contract was designed whereby realized mortality rates would be swapped with the forecasted expected mortality rates. The payout structure under the swap ensured that the SSNIT’s liability was completely hedged against longevity risk.
Keywords: Longevity swaps, Risk, Mortality, Life expectancy
Cite this paper: A. Y. Omari-Sasu, D. Asamoah Owusu, M. A. Boateng, I. Tettey, Hedging Longevity Risk using Longevity Swaps: A Case Study of the Social Security and National Insurance Trust (SSNIT), Ghana, International Journal of Finance and Accounting , Vol. 5 No. 4, 2016, pp. 165-170. doi: 10.5923/j.ijfa.20160504.01.
Article Outline
1. Introduction
- This study seeks to investigate how mortality derivatives could be used to hedge against longevity risks for pension providers in Ghana. Longevity risk refers to the risk that the actual survival rates and life expectancy will exceed expectations or pricing assumptions, resulting in greater-than-anticipated retirement cash flow needs. Pension providers are faced with the risk that pensioners will live longer than expected and since they have to pay monthly pension to the pensioners until their death; longevity risk may affect the annuity provider’s solvency. The need to manage longevity risk has become very important as employers and employees become aware of their exposure to longevity risk and their need to mitigate it. For individuals, longevity risk is the risk of outliving one’s income, resulting in a lower standard of living, reduced care, or a return to employment at old age. For those institutions providing covered individuals with guaranteed retirement income, longevity risk is the risk of undervaluing survival rates, resulting in increased liabilities to sufficiently cover promised payments. According to the center for insurance policy and research of the National Association of Insurance Commissioners (NAIC, US), key drivers of the growing need to address longevity risk include an aging population, increasing life expectancy, a shift in who bears the responsibility of sufficient retirement income, uncertainty of government benefits and economic volatility.Lots of research have been carried out by a range of stakeholders (e.g., government actuarial or pension departments, academic institutions, through experience, studies) across the world that is focused on the observed trend in mortality witnessed over the last century. The results of this researches points to the same undeniable conclusion. People are living longer today than they ever have in the past. Significant medical progress, improved hygiene and living standards, generally healthier lifestyles and the absence of both wars and major pandemic crises are some of the key factors responsible for the rising life expectancy. Crawford et al (2008)This phenomenon has essential consequences for defined benefit plans, particularly those where payments to current retirees are in part funded by contributions from current employees. Government sponsored plans are one clear example.Governments of countries that are likely to experience “the demographic time bomb” will have to carefully consider future costs and weigh potential program modifications, Crawford et al (2008).While the above observations discuss the population as a whole, Crawford et al (2008) also showed that historical mortality improvements have differed depending on time an individual was born. This has been called the “cohort effect”, which describes anomalies in observed mortality improvement for those born in a specific period of time.Mortality Risk for Insurers: A life insurance policy promises to pay a specified amount of money upon death of a policy holder. In exchange for this payment, the policy holder pays a premium. The premiums could be a one-time upfront payment or could be paid in regular intervals (monthly, quarterly, etc.).Premiums are priced based on certain assumptions about future interest rates, mortality rates, expenses, investment returns etc. these assumptions are known as the basis for the pricing. Actual experience may not follow the assumptions made therefore there’s a risk of the insurer making losses.According to the World Bank life expectancy data, over the years, life expectancy have been increasing. Pension providers are obliged to pay a fixed amount to a pensioner on a monthly basis for as long as the pensioner remains alive due to advances made in medical technology, people changing their lifestyles and other factors, life expectancy have increased continually since the 1960s.Long et al (2015).Life expectancy in Ghana increased by 16 years from 1960 to 2013 and by 3.3 years 10 years (2003 to 2013). In this study, our focus is on the increased life expectancy. Longevity risk cannot be precisely forecasted therefore it is necessary for pension funds to hedge their portfolio against this risk using one or more of various techniques.Few researchers investigated the issue of natural hedging. Most of the prior research explores the impact of mortality changes on life insurance and annuities separately, or investigates a simple combination of life and pure endowment life contracts (Frees et al. (1996); Wang et al. (2010), Cairns et al (2004). Studies on their pact of mortality changes on life insurance focus on “bad” shocks while those on annuities focus on “good” shocks.Various attempts including Blake et al (2006), Cox and Lin (2007), Brouhns et al (2002) and Bauer et al (2006) have been made to manage longevity risk.
2. Methodology
- Secondary data was obtained from the Social Security and National Insurance Trust (SSNIT). SSNIT is the biggest pension provider in Ghana with investment across various sectors of the economy. The data obtained was well representative of Ghanaian Pensioners.
2.1. Stochastic Modelling for Mortality
- In a longevity swap transaction, contracting parties would have to agree on the future mortality rates which determines the payment of the fixed leg of the transaction. The method used to estimate future mortality rates must also be agreed on. In this section, we present definitions and notations regarding mortality models. According to De Waegenaere et al (2010), The one-year death probability, is defined as
 This represents the probability that an individual belonging to the year group g, aged x in year t will not survive to age x+1 and the probability that the individual survives another year to age x + 1 is given by
 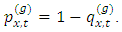 The total number of deaths occurring in each year for each cohort was obtained from the data and the proportion of deaths in the cohort was obtained using the relation.
 where
where  probability that a life aged x in year t dies before attaining age x+1
 the number of people aged x and dies in year t,
 the number of people aged x in year t.
2.2. Forecasting Mortality Rates
- In order to do a longevity swap, future mortality rates should be estimated. In this study, we use the Cairns-Blake-Dowd (2006) (CBD) model to forecast future mortality rates.
2.2.1. Logit Transformation
- A logit is the defined as the logarithm of the odds. If P is the probability of an event, then
 is the probability of not observing the event and the odds of the event are
  The logit transform is most frequently used in logistic regression and for fitting linear models to categorical data.
2.2.2. The Cairns-Blake-Dowd Model
- The Cairns-Blake-Dowd model is a stochastic mortality model designed for modelling mortality at higher ages. It is therefore very useful in modelling longevity risk for pensions and annuity providers.The CBD model was built on the observation that log mortality rates are approximately linear at ages above 40. The model uses two period-effect parameters to capture the trend improvement in mortality and the differential higher age dynamics.
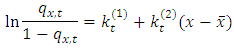
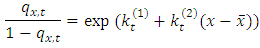 The equation finally becomes;
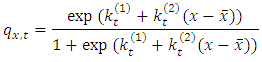 The first CBD mortality index,
  represents the level of the mortality curve (the curve of
  in year t) after a logit transformation. A reduction in
  that is, a parallel downward shift of the logit-transformed mortality curve, represents an overall mortality improvement. The second CBD mortality index,
  represents the slope of the logit-transformed mortality curve. An increase in
  that is, an increase in the steepness of the logit-transformed mortality curve, means that mortality (in logit scale) at younger ages (below the mean age
  improves more rapidly than at older ages (above the mean age). The two parameters
  and
and  would be obtained using a stochastic simulation.
2.2.3. Proposed Longevity Swap
- Considering the fact that longevity risk is real, and the adverse effect it could have on the financial liability of the pension fund, we propose a longevity swap transaction for pension funds. For each cohort of pensioners from 1999, we have forecasted the future mortality (or survival rates). We denote the probability that a pensioner aged x dies before reaching year t by
 and the probability of survival to age x + 1 by
  Therefore the expected number of survivors to age x+n from the cohort retiring in year i will be denoted by
  where
where  is the number of pensioners who retired in year i and will be denoted by
  Also, we denote the actual number of survivors from retirement year i to age x + n by
  A longevity swap transaction for the pension fund will be structured such that the pension fund pays the investor (Insurance company or investment back) taking the other end of the swap deal a notional amount multiplied by
  whiles the investor pays the pension fund the same notional amount multiplied by
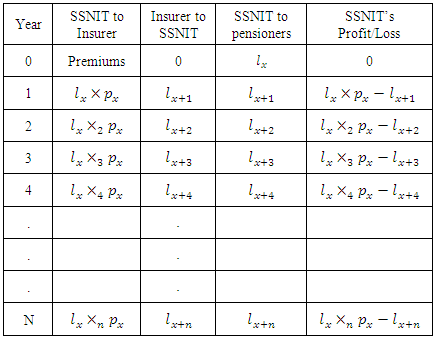
  By this transaction, the pension fund is assured that all surviving pensioners are paid their pension since the longevity risk has been taken by a thirds party.Table 1 shows a cash flow for the proposed longevity swap. The profit or loss is the difference between the amount paid to the insurer and the amount the insurer pays to SSNIT.
|
3. Results
3.1. Descriptive Statistics of the Data
- The general trend was an increase in the number of males retiring at age 60 between 1991 and 2013 with the steepest increase occurring between 2001 and 2010. The pattern was similar for females retiring from active service at age 60 between 1991 and 2013. The period recording the highest number of retirements was also between 2001 and 2010 where the trend peaks and declined the next year 2011 before a sharp increase again in 2012. The trend could be attributed to factors such as employment rates from the late 70s and the number of people who leave active service due to other decrements including early retirements.
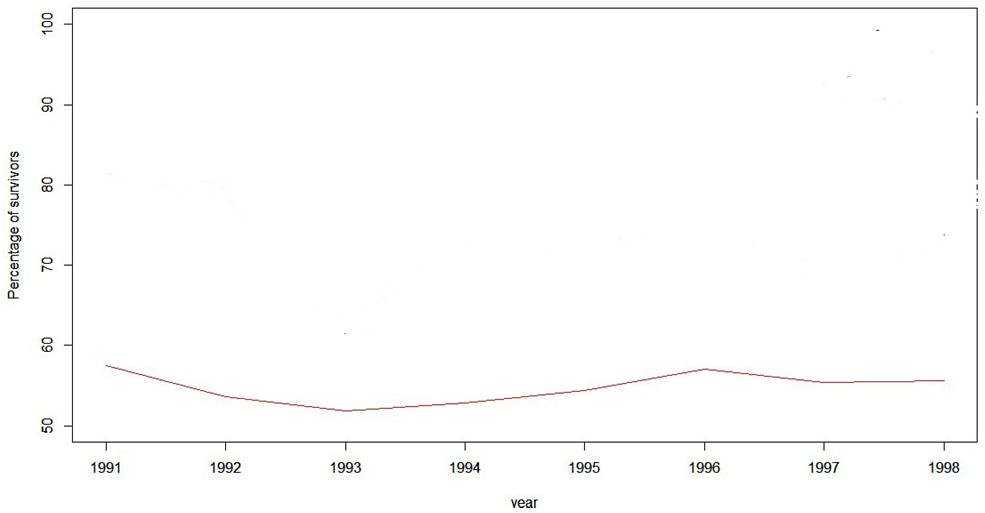 | Figure 1. Percentage of pensioners surviving beyond guarantee period |
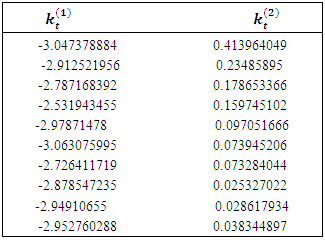
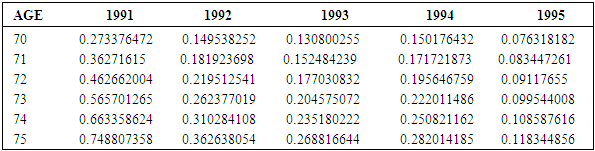
3.2. Results of the Cairns-Blake-Dowd Model
- Using the Cairns-Blake-Dowd (CBD) model, mortality for each cohort was forecasted up to age 90. The parameters obtained are displayed in table 4.3 below. One of the most important factors needed to carry out a longevity hedge is a forecast for future mortality pattern. These forecasted values becomes the expected mortality with which a longevity hedge is done. In our longevity swap, the expected mortality is swapped with the realized mortality. The other leg of the swap deal pays SSNIT an amount which is dependent on the actual survivors. The longevity risk is thereby transferred to the other party who receives payments dependent on the expected mortality.
|
|
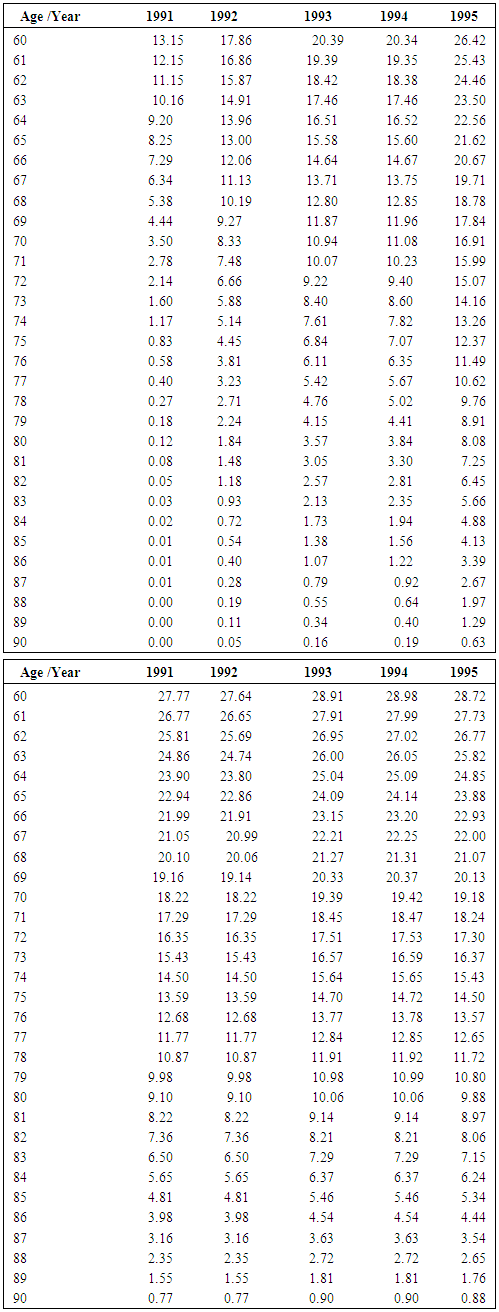
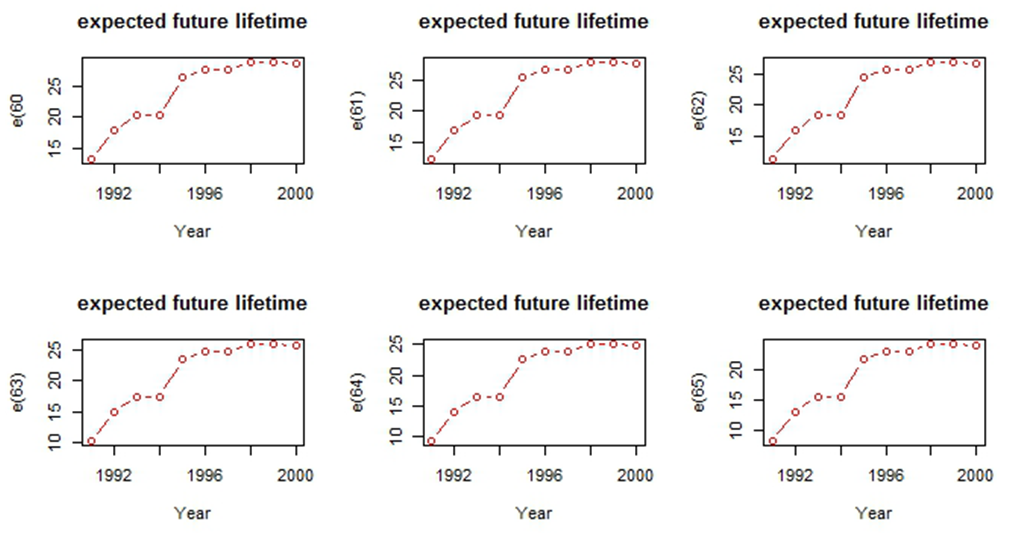 | Figure 2.  for g = 1991, 1992,…, 2000 and x = 60, 61,…, 65 for g = 1991, 1992,…, 2000 and x = 60, 61,…, 65 |
|
4. Conclusions
- Forecasted future mortality rates for male pensioners who retired between 1991 and 2000 obtained was plotted against age for each of the cohorts. The curves obtained are consistent with mortality rates which increase with age.Also we can observe that the mortality rates at higher ages is on the decrease. The forecasted mortality for the 1991 cohort was higher than the forecasted mortality for the 1992 cohort and continued in that order. This suggested that mortality was improving hence more pensioners were likely to survive beyond the guarantee period of 15 years. Also, it is recommended that SSNIT takes appropriate measures to hedge its longevity risk.