-
Paper Information
- Next Paper
- Paper Submission
-
Journal Information
- About This Journal
- Editorial Board
- Current Issue
- Archive
- Author Guidelines
- Contact Us
International Journal of Finance and Accounting
p-ISSN: 2168-4812 e-ISSN: 2168-4820
2016; 5(3): 135-145
doi:10.5923/j.ijfa.20160503.01

Specific Performance Indicators, Market Share and Operating Efficiency for Commercial Banks in Kenya
 Abstract
 Reference
 Full-Text PDF
 Full-text HTML
Robert M. Odunga
Department of Accounting and Finance, School of Business and Economics, Moi University, Eldoret, Kenya
Correspondence to: Robert M. Odunga, Department of Accounting and Finance, School of Business and Economics, Moi University, Eldoret, Kenya.
| Email: |  |
Copyright © 2016 Scientific & Academic Publishing. All Rights Reserved.
This work is licensed under the Creative Commons Attribution International License (CC BY).
http://creativecommons.org/licenses/by/4.0/

Banks play an important role as financial intermediaries for savers and borrowers in an economy. All sectors of the economy virtually depend on the banking sector for their very survival and growth. Efficiency is the ability to deliver products and services cost effectively without sacrificing quality. It involves a combination of right variables to enhance productivity and value of business operations, while driving down the cost of routine operations to a desired level. The Kenyan banking sector has grown tremendously in terms of numbers, size and customer base. Despite growth in the sector, challenges remain; according to the Central Bank of Kenya (CBK) 2012 report, market risk, credit and operational risk still pose a major challenge. There is still no model that bank managers may use to determine their operational efficiency levels. This paper examines the patterns and effect of bank specific performance indicators on their operational efficiency. The result reveals that, bank’s operational efficiency is well explained by bank specific performance indicators as R2 = 64%. Never the less, market share is a matter in determination of bank’s operational efficiency. Close attention to variables that effect operational efficiency is required for banks to remain competitive in the market.
Keywords: Commercial Banks, Operating Efficiency, Specific Performance Indicators, Market Share
Cite this paper: Robert M. Odunga, Specific Performance Indicators, Market Share and Operating Efficiency for Commercial Banks in Kenya, International Journal of Finance and Accounting , Vol. 5 No. 3, 2016, pp. 135-145. doi: 10.5923/j.ijfa.20160503.01.
Article Outline
1. Introduction
- Operational efficiency is the ability to deliver products and services cost effectively without sacrificing quality (Allen and Rai, 1996). It can also be defined as what occurs when the right combination of people, process, and technology come together to enhance the productivity and value of any business operation, while driving down the cost of routine operations to a desired level (Shawk, 2008). The result is that, redirecting resources previously needed to manage operational tasks to new and high-value initiatives that bring additional capabilities to the organization. Relatively firms that are more efficient tend to maintain more stable levels of output and operating performance compared to their industry peers (Mills and Schumann, 1985). An efficient banking sector is critical and able to absorb negative shocks and enhance financial system stability.The operations of a banking sector in any economy are critical because of the role it plays in the growth and development of that economy. The sector acts as a bond that holds the country’s economy together. Sectors such as the agricultural and manufacturing virtually depend on the banking sector for their very survival and growth. The Central Bank of Kenya regulates commercial banks in Kenya. Commercial banks being the dominant players in the sector, (Olweny 2011), they get closer attention from the regulator while conducting off-site and on-site supervision to ensure that they comply with the laws and regulations that guide their operations, for instance, the quarterly financial reports and full disclosure requirement by banks. The banking environment in Kenya has for the past decade, undergone many regulatory and financial reforms like interest rate liberalization, financial innovations and enhanced competition. These reforms have brought about many structural changes in the sector and have encouraged foreign banks to enter and expand their operations in the country (Mwega, 2009). The sector has seen increment in the number of deposit account holders, number of staff, total assets and pretax profits. According to CBK report (2012), growth in banking sector was attributable to adoption of cost effective delivery channels to enhance access to banking services, adoption of ICT by banks, the use of agent banking model and creation of Credit Reference Bureaus (CRBs). Despite growth in the sector, interest rate margins have remained high implying an attempt by commercial banks to pass their inefficiencies to consumers due to their inability to push their operational costs downwards. The sector is the largest in terms of assets in the financial services industry and yet not the largest supplier of credit. Commercial banks in the country disbursed over US$10 billion in loans representing 1.8 million accounts. Non-formal financial institutions served the remainder of the loans market. These included credit union/SACCOs, the largest in Africa, which disbursed US$2 billion in loans with over 3.5 million members. Micro finance institutions (MFIs), which managed only US$300 million among non-formal credit providers (Ahmed and Karunditu, 2010). Operating efficiency was one of the most critical risks faced by financial institutions in Kenya and Kenyan banks were yet to adopt model-based approaches in assessing their operating efficiency (CBK 2012, Mwega 2009). The importance of operating efficiency for banks was evident by a study done on Indian scheduled commercial banks (Siraj and Pillai 2011), which revealed that key determinants of operational efficiency were affected by the global financial crisis. In attempt to provide a model that bank managers may use to measure and predict operational efficiency of their banks, this paper examined the effect of bank specific performance indicators, capital adequacy, credit risk, liquidity, profitability and asset quality on their operational efficiency. Measuring the efficiency levels of individual banks is usually the first step. After all, understanding the determinants behind the differences among banks’ operating efficiency levels is more interesting.
2. Theoretical Literature Review
2.1. Conventional Economic Efficiency Theory
- This theory forms the basis of this study, and stipulates that companies should achieve their output at the lowest possible cost per unit produced. Economies of scale may achieve optimal production, and counteracting perceptible benefit repeated by more costs associated with overstressing the existing systems. In the short run, the situation of maximum operational efficiency is the level of output at which all accessible economies of scale are taking advantage of such efficiency. In the end, lifting the capacity of existing systems can increase the optimal level of productive efficiency (Zerbe, 2001). The conventional economic efficiency theory is in two parts, allocative (price) efficiency criteria and the productive (technical) efficiency criteria. Maximum allocation efficiency is the point when the business produces the optimal output of a combination of goods and services to maximize the benefit to the business as a whole (Said, 2011). The theory provides a basic context for understanding a variety of factors associated with existing operating costs of the business (Zerbe, 2001). For banks to operate at efficient level, then all bank products have optimal pricing. This will in turn reduce unfair competition in the market and reduction in interest rate spreads. The productive efficiency takes place when the business employs all of its resources efficiently, producing the most output from the least input (Quinzi & Sujaya, 1993). Many researchers have employed the theory of conventional economic efficiency to measure efficiency in banking systems (Sathye, 2001; Barr, Killgo, Siems & Zimmer 2002; Saad & El-Moussawi, 2009; Said 2011). A firm with higher profits is more economically efficient but within a given range of prices (Mullineaux, 1978).Efficiency ratios evaluate the overhead structure of a financial institution. It is the measure of how effectively a bank uses overhead expenses including salaries and benefit costs occupancy expenses as well as other operating expenses in generating revenues (Yeh, 1996). Generally, calculating operating efficiency ratio for banks is by dividing operational expenses by the sum of net interest income and non-interest or fee income (Allen and Rai (1996); Yeh (1996); Halkos and Salamouris (2004)). Other things being equal, a decrease in the efficiency ratio is a positive sign while a rising efficiency ratio is generally undesirable. Lower efficiency ratio means that the bank is making considerably more than it is spending and is therefore on sound fiscal footing. Efficiency ratio can be conceptualized as the measure of what a bank must spend in order to make a shilling (Halkos and Salamouris, 2004). However, for the purpose of uniformity and consistency in the data collected, this study used the reciprocal of the ratio by dividing interest and non-interest income by operational expenses. Amer, (2011) used the ratio by dividing interest and non-interest income by operational expenses to determine operating efficiency for Egyptian banks. Therefore, a higher efficiency ratio was more desirable than a lower efficiency ratio in this study. Since the variables used in computation of efficiency ratio (revenues and operational costs) reflect the pricing and production efficiency of a bank, it is a good measure of the dependent variable.
2.2. The Regulatory and Efficient Market-Monitoring Theory
- According to the regulatory hypothesis, regulators encourage banks to increase their capital to commensurate with the amount of risk taken. The increase in capital to march the increase in risk may come from efficient market monitoring, when capital positions are inadequate (Calomiris and Kahn, 1991; Berger, 1995). Therefore, an important factor contributing to a positive relationship between capital adequacy and credit risk management to banks efficiency relates to the actions of regulators and supervisors (Shrieves and Dahl, 1992; Jacques and Nigro, 1997; Aggarwal and Jacques, 1998; Editz, Michael and Perraudin, 1998). Banks could respond to regulatory actions forcing them to increase their capital by increasing asset risk (Kim and Santomero, 1988). Altunbas, Carbo, Gardener and Molyneux (2007), suggest that, any empirical approach used to model the relationships between capital and risk needs to take account of bank efficiency. Level of bank risk could also affect efficiency (Berger and De Young, 1997). For instance, managers who are not very efficient at assessing and monitoring loans are not likely to be very efficient in achieving a high level of operational efficiency. Yener, Carbo, Gardener and Molyneux (2007), did not find a positive relationship between inefficiency and bank risk-taking in contrast to established evidence in the United States. Inefficient European banks appeared to hold more capital and take on less risk. According to Kwani (1997) and Saunders, Strock and Travlos, (1990), bank risk-taking affects and is related to operating efficiency; firms with more capital are bound to operate more efficiently than firms with less capital, indicating that the level of capitalization is a good proxy for performance. From the above discussion, we may deduce that capital adequacy and credit risk affects operating efficiency of a bank.
2.3. Financial Intermediation and Liquidity Transformation Theory
- Liquidity represents the ability of the institution to fund increases in assets and meet obligations as they fall due. It is crucial to the continued viability of any banking institution. The importance of liquidity goes beyond the individual bank as a liquidity shortfall at an individual bank can have systemic repercussions. According to this theory, banks create liquidity by funding illiquid loans with liquid demand deposits. More generally, banks create liquidity on the balance sheet by transforming less liquid assets into more liquid liabilities. Kashyap, Rajan & Stein (2002) suggest that banks may also create significant liquidity off the balance sheet through loan commitments and similar claims to liquid funds. Liquid banks may be more efficient in the sense that, all other things being equal, an efficient bank can produce more output part of which includes liquid and other assets. According to Gorton and Huang, (2002), banks and banking systems that produce more liquidity than others perhaps can be viewed as both more ‘liquidity efficient’ and also less risky. Banks transform the deposits made mostly for short term into medium and long-term credits. This non-correlation between the due dates of attracted deposits and the due dates of the granted credits can lead to the emergence of liquidity risk for the bank; but the larger the bank’s portfolio of assets and liabilities the lower the risk for breach of obligations. We as well deduce that liquidity affects operating efficiency of a bank. The statutory minimum requirement for liquidity ratio for banks in Kenya was 20% during the study period.
2.4. The Efficient Structures and Profitability Theory
- According to the efficient structures hypothesis, banks earn high profits because they are more efficient than others are; profitable firms are more efficient because of their lower operational costs. Such firms tend to gain larger market shares, which may manifest in higher levels of market concentration, but without any causal relationship from concentration to profitability (Athanasoglou, Brissimis and Delis, 2008). In addition, larger firms can obtain lower unit cost and higher profits through economies of scale. In cases where a firm is highly efficient relative to its competitors, the firm can maximize profit by maintaining its current size and pricing strategy or by reducing prices and expanding its operations (Berger, 1995). By extension, those more efficient firms will gain greater market share, which may result in a more concentrated market (Beck, Cull, Fuchs, Getenga and Randa, 2010).A study by Dimitris (2008), on commercial bank in Greece finds that there is a positive relation among profitability, size of the branches and their efficiency and within the branch characteristics, variable, more profitable and larger branches have higher operating efficiency. Overtime and especially among relatively large banks, information flows and competitive pressures act to reduce differences in operating efficiency that may appear in the short run (Myron, Kwast & John 1982). Despite the fact that many studies have looked at profitability as an offshoot of efficiency, in this study, we look at it differently and state that there is a relationship between the two in the sense that firstly, banks may make profits without being efficient by charging excessive interest rates. Secondly, investing in efficiency is a very expensive exercise that would require a lot of financial outlay such that undertaking it may depend on the current profitability levels of the bank. Further, we state there is a structural difference between low market share banks and large market share banks with respect to operating efficiency.
2.5. Portfolio Balance and Asset Diversification Theory
- Studies on quality of assets and efficiency of banks delve indirectly into the issue of quality of lending (Berger and Udell, 1996). Such works deal with whether the involvement of banks enhances or reduces the level of operating efficiency among the affected banks. According to Ezeoha (2011), sound regulatory structures ensure adherence to laid down rules, guide the corporate governance behavior of banks, and specially moderate the conduct of bank managements.Loans and advances to customers is a major component of total assets for banks. However, banks may have diversified assets with the aim of producing superior returns, performance and/or greater security, (Nzongang and Atemnkeng, 2006). The quality of assets held by a bank depends on exposure to specific risks, trends in non-performing loans, and the health and profitability of bank borrowers (Baral, 2005). All these are symptoms of efficiency levels of a bank and finally we may state that asset quality affects operating efficiency of a bank.
3. Methodology and Data
3.1. Study Design, Data Type and Analysis
- In attempt to explain the relationship between the independent variable and the dependent variable and to establish the effect of independent variable on the dependent variable (Saunders, Lewis and Thronhill 2007), the study adopted an explanatory research design using panel data and fixed effects regression model as per the Hausman test results discussed in section 4.5. The collection of secondary data on the rating and bank specific performance measures was from published financial reports of all the 43 commercial banks in Kenya for a seven-year period up to December 2012. The source of data on bank financial reports was the Central Bank of Kenya (CBK). Banks' market share index was determined and used as a measure of large and small banks. Nonstructural approach by determining accounting and financial ratios relevant for each bank and for each year were determined for capital adequacy, credit risk, liquidity, profitability and asset quality by applying the appropriate formulae. Many studies have used accounting and financial ratios in measuring and evaluating performance of banks because ratios provide a great deal of information about a bank's financial performance when compared with prior periods and with other banks' performance (Oral and Yolalan, 1990). According to Ong, Teo and Teh (2011), financial ratio is a tool used to evaluate statements and indicate the financial performance of a bank. A ratio is convenient and reliable analytical tool (Halkos and Salamouris, 2004).Market share index of banks was determined for each year of study as the weighted average percentage of each variable to the market average total. The formulae used was, 0.33*percentage of net assets + 0.33*percentage of total deposits + 0.33*percentage of total capital + 0.01* percentage of total number of deposit accounts (CBK, 2011). Banks then categorized into low and high market share using a simple average of the banks’ share index of (2.486). The determination of suitability of the fixed effect model was by inferential statistics using the Hausman test checks.The estimating equation of the autoregressive model took the following form;
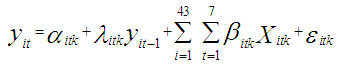 | (1) |
|
3.2. Determination of Optimal Model
- To run a fixed effects regression analysis for the panel data, dummy variable equal to 1 if the bank was in high market share category and 0 if the bank was in low market share category were created. The generation of new variables was by multiplying the dummy variable by each of the independent variables. To determine the optimal combination of variables, several forward stepwise regressions for all the categories of independent variables using proxy variables. The variable that formed part of the combination for optimal model served as the best proxy for the main independent variable in relation to the dependent variable.
4. Results and Discussions
4.1. Descriptive Statistics
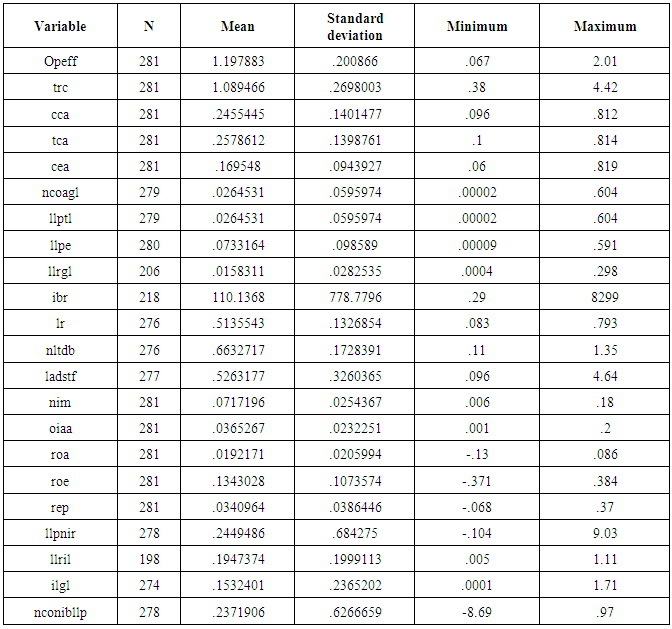
- The summary statistics of the data show that the average operating efficiency of all the banks was 1.198 with a minimum ratio of 0.067 and maximum ratio of 2.01. A mean of 1.198 implies that on average banks were able to cover their full operational costs from revenues generated during the study period, and still made earnings for the owners of the business. It is also important to note that banks that scored lower operational efficiency were in their initial years of operation than those that were in operation for longer period, which implies that operational efficiency cannot be achieved in short run. This result supports the argument by Beck, Cull, Fuchs, Getenga and Randa (2010) that, bank’s operational efficiency is a reflection of its growth and expansion through strategic branch network that can only be a long-term achievement as the bank continues in operation.Banks maintained their capital above the minimum statutory requirement. The average for core capital ratio for the banks was above the minimum statutory requirement of 8%. The average risk based capital ratio for the banks was also above minimum requirement of 12%. The return on assets ratio measures efficiency of the management. The average ratio for the study period was 1.92% with minimum ratio of -13% and maximum ratio of 8.6%. This implies that in general, the management efficiency of the banks was very low during the study period. Return on equity ratio indicates how much earned for each shilling invested by the owners of the business. On average, 13.4% earned for every shilling invested with a minimum ratio of -37.1% and maximum ratio of 38.4% during the study period. An average return on investment of 13.4% was a good return compared to average market rates that prevailed during the study period.
|
4.2. Distribution Test for Dependent Variable
- The assumption of linear regression models is that dependent variable has to be normally distributed. The histogram of operating efficiency for the study period showed normality as described in the bell shaped curve.
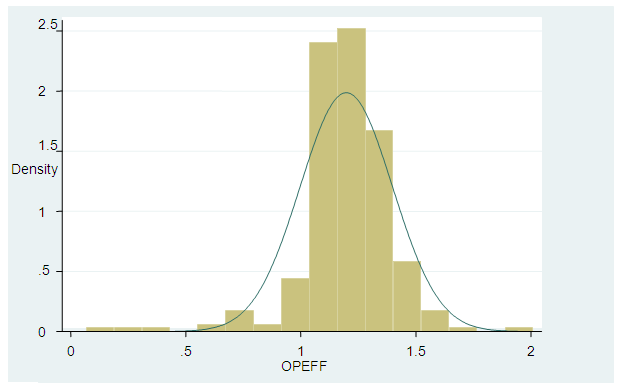 | Figure 1. Operating Efficiency Distribution |
4.2.1. Trend of Operating Efficiency
- Trend in Figure 2 depicts that there was a gradual upward trend of the annual averages of operating efficiency from 2005 to 2012 as indicated in the trend line. In 2005, the average was about 1.155 while in 2011 the average had increased to 1.18. There was a great down surge in the annual mean of operating efficiency of the Kenyan-banking sector between the years 2007 and 2008, this reduction in mean operating efficiency may be attributed to election and post election violence that took place the years 2007 and 2008.
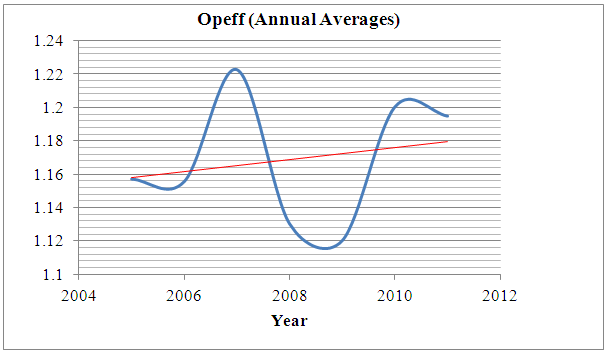 | Figure 2. Trend in Annual Mean of Operating Efficiency |
4.3. Correlation Matrix
- A correlation coefficient of greater than 0.8 between two independent variables means that there exists multicollinearity. Stata automatically checks for multicollinearity when performing regression and omits the regressor variable in the process. High correlation between independent variables though can lead to a high value of the adjusted R-squared coefficient may be misleading. Adjusted R-square is the coefficient of determination that gives the degree to which the predictor variables in their entirety explain variations in the dependent variable. The correlation matrix results showed that there existed multicollinearity between loan loss provision/total loans ratio and net charge off/average gross loans ratio (r >0.8). Stata automatically checks for multicollinearity when performing regression and omits the regressor variable in the process.
4.4. Average Market Share Index Trend
- The graph below clearly shows that the bars for average large market share banks are magnificent and high compared to low market share banks during the study period. The trend was almost constant across the years.
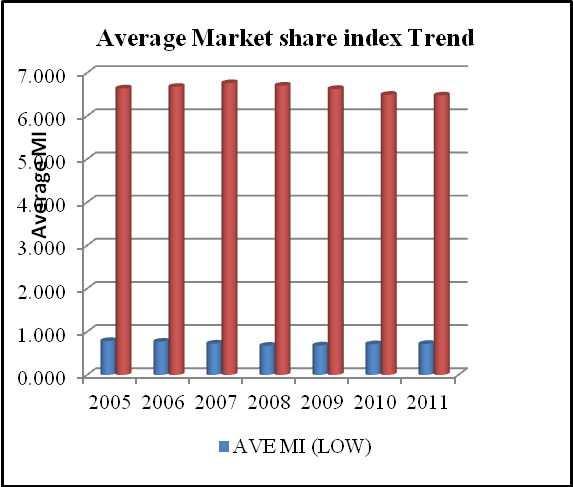 | Figure 3. Trend of Low and High Market Share Banks |
4.5. Tests for the Regression Application Model
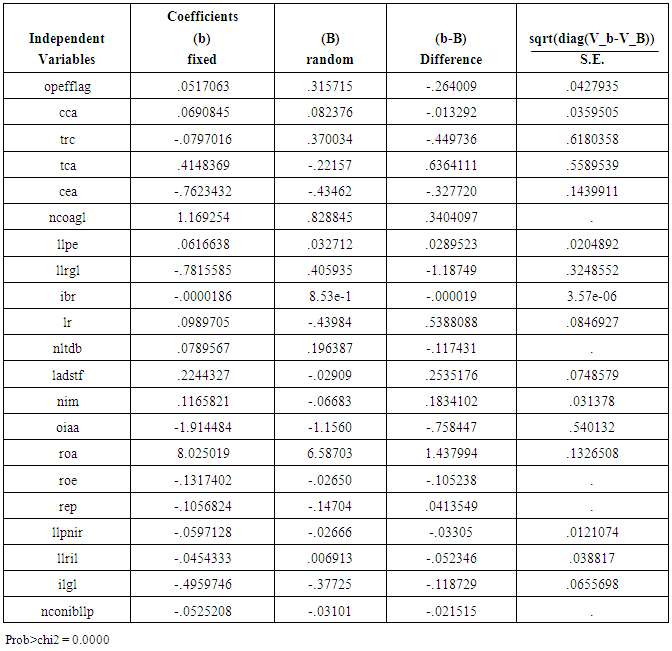
- To decide on the appropriate regression model for the panel data, whether to apply fixed effects regression or the random effects regression, the study applied the Hausman test statistics. The Hausman test checks for a more efficient model against a less efficient one and makes sure that the more efficient model gives consistent results (Baltagi, 2008). In the test, the null hypothesis states that the coefficients estimated by the efficient random effects estimator are the same as the ones estimated by the consistent fixed effects estimator. In the table below, since the p-value was significant (p<0.05) the null hypothesis was therefore rejected and concluded that fixed effects model was statistically viable model for the study. The study data met the requirements for implementation of the fixed effects model because each firm in the sample had more than one measurement on the same dependent variable, thus, operating efficiency for every firm for every study period. Secondly, values of the independent variables were different across the firms and across the periods.
4.6. Fixed Effects Regression Output for Optimal Combination
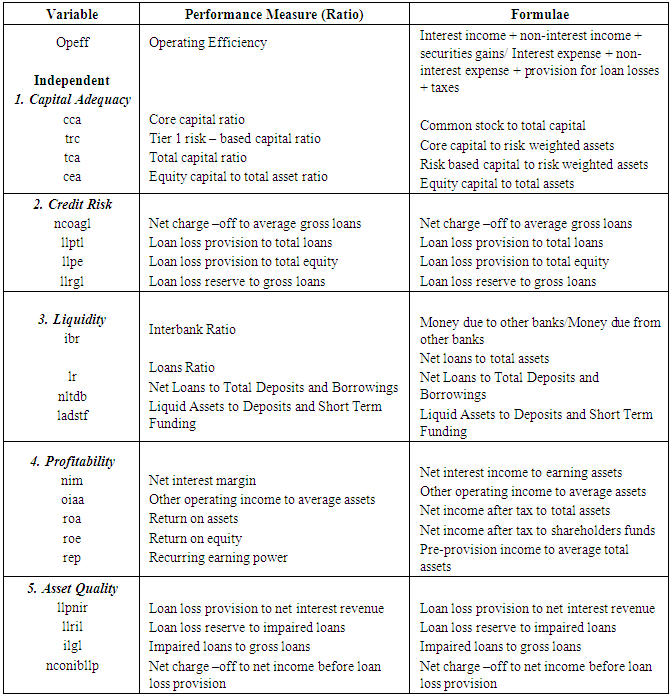
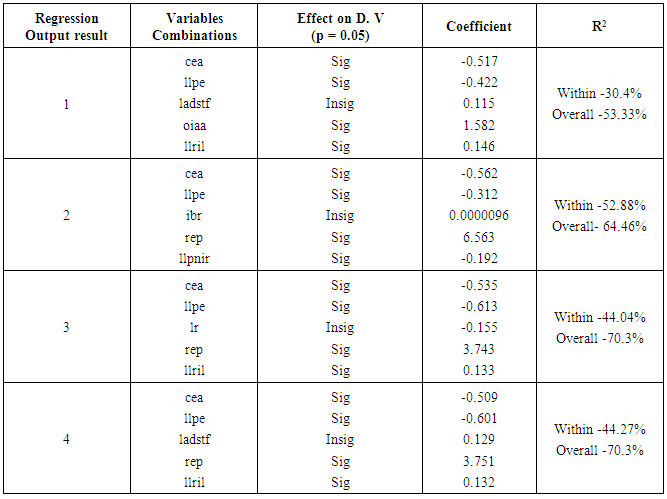
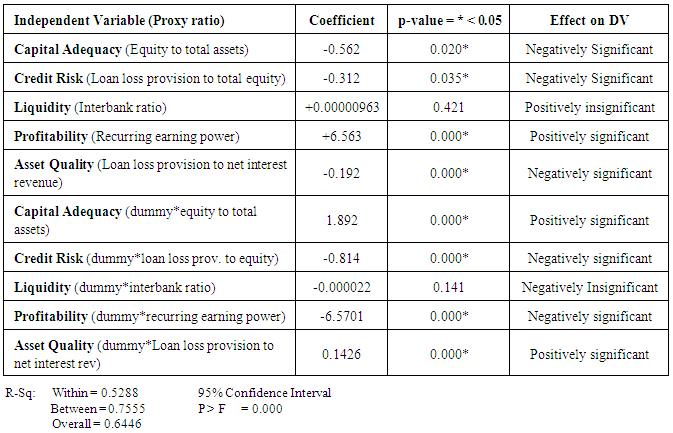
- According to this study, optimal combination variables referred to a proxy variable from each category of the independent variables, capital adequacy, credit risk, liquidity, profitability and asset quality that would combine well with others in forming the optimal model that would best explain the variations in operating efficiency. Table 3 shows the summary of different regression output results for different combination of proxy variables for each of the independent variable.The optimal combination of the independent variables comprised of; Capital adequacy proxy by equity capital to total assets ratio (cea), Credit risk proxy by loan loss provision to total equity ratio (llpe), Liquidity proxy by interbank ratio (ibr), Profitability proxy by recurring earning power ratio (rep) and Asset quality proxy by loan loss provision to net revenue (llpnir). Table 5 shows the summary of the regression output for the optimal combination of the proxy variables.
|
|
|
5. Conclusions and Recommendations
- The results show that the optimal model has a forecast power above average as predictors explained more than half of the variations in operating efficiency as evidenced R2 (within) = 53% and R2 (overall) = 64%. The overall variability in operating efficiency was explained significantly as shown by the model p- value = 0.000 < 0.05, implying that the model was strongly fit. Lagged operating efficiency was positively significant at p –value = 0.001 < 0.05. This implies that operating efficiency of a firm today significantly influences its operating efficiency a year later and that, the history of a firm’s performance will definitely influence how a firm moves forward in an effort to streamline its operational strategies. Statistically, since many of the independent variables were significant in explaining variations in operating efficiency, there is an indication of improved efficiency in the Kenyan-banking sector, which could be because of majorly improved reforms in the sector and reduction in nonperforming loans leading to reduced provisions for the same.
5.1. Capital Adequacy and Bank’s Operating Efficiency
- Equity capital to total assets ratio was the optimal proxy for capital adequacy influencing bank operational efficiency. This is because equity to total assets ratio was significant in explaining operating efficiency in all sets of combination tests unlike the other proxy variables. The ratio significantly influenced bank operating efficiency at p-value = 0.020 < 0.05. However, its influence on operating efficiency differs with low market share banks and high market share banks. Equity capital to total assets ratio represents the bank’s capital structure and shows the ability of a bank to withstand losses. The decline in the ratio signals increased risk exposure and possibility of capital adequacy problem. Banks are therefore encouraged to have more of equity in their capital structure in order to reduce risk exposure and to improve their operational efficiency. Banks need to concentrate on capital adequacy and particularly on equity capital to total assets ratio as a way of improving their operating efficiency. This result was inconsistent with previous findings (Yener, Carbo, Gardener and Molyneux 2007), that the inefficient European banks appeared to hold more capital and take on less risk. The CBK should emphasize on banks increasing their capital levels in order to increase their operational efficiency. Clearly, efficiency has a cost and banks should be ready to accumulate adequate capital to be able to invest in efficiency through acquisition of new technology and provision of quality service to customers.
5.2. Credit Risk and Bank’s Operating Efficiency
- Loan loss provision to total equity ratio was the optimal proxy for credit risk in influencing bank operational efficiency. This is because loan loss provision /equity ratio was significant in explaining operating efficiency in all sets of combination tests unlike the other proxy variables. The ratio was statistically significant in influencing operating efficiency at p-value = 0.035 < 0.05. However, its influence was only limited to low market share banks. Loan loss provision to total equity ratio shows the proportion of loan loss provided for during the year to total equity capital. Low ratios imply high quality of loan portfolio provided by the banks. Banks are therefore encouraged to reduce on their levels of loan provisions in order to improve their efficiency. The bottom line is that, credit risk management affairs of banks should entrust to experienced and superior management. Further to that, risk taking is about management’s attitude, bank shareholders should ensure that the agency problems between them and management are reduced at all costs, Saunders, Strock and Travlos (1990) and Kwan, (1997). This would go a long way towards reducing the level of nonperforming loans and hence reduction on loan loss provisions.
5.3. Liquidity and Bank’s Operating Efficiency
- Interbank ratio emerged as the optimal proxy for liquidity influencing operating efficiency for banks. This is because; of the three proxy variables, liquid assets/deposits and short-term funding ratio, Interbank ratio and Loan ratio that were all insignificant in influencing operational efficiency, interbank ratio had the lowest coefficient hence its contribution in influencing operating efficiency was the minimal. Interbank ratio was statistically insignificant in influencing operating efficiency in both categories of banks. This implied that liquidity of a bank is not critical in determining its operational efficiency. The interbank ratio indicates the position of a bank in terms of being a net placer or borrower of funds in the interbank market. A ratio greater than 100 implies that the bank is a net placer rather than borrower of funds. The average interbank ratio for the banks during the study period was 110.14, meaning that banks were net placers rather borrowers and indication of more liquid banks able to meet their liquidity requirements as they fall due. Whichever way the bank is, it does not affect its operational efficiency significantly. The result is inconsistent with the arguments by Kashyap, Rajan and Stein (2002), Gorton and Huang (2002), that banks that were liquid were more efficient in producing more output part of which are liquid and part in other assets. The implications were that the CBK should not emphasize the minimum liquidity ratio for banks in order for them to enhance their operational efficiency.
5.4. Profitability and Bank’s Operating Efficiency
- Recurring earning power ratio was the optimal proxy for profitability influencing bank operational efficiency. This is because; of the two proxy variables, other operating income/average assets and recurring earning power that were significant in all combinations, recurring-earning power ratio had the highest coefficient value compared to other operating income/average assets ratio hence its high contribution to variations in operational efficiency. The recurring earning power ratio was significant at p-value = 0.000 < 0.05. The ratio shows the return of assets performance measurement before deducting loan loss provisions. This implied that banks should emphasize on increasing their earnings in order to improve their operational efficiency by investing in resources that would boost their operational efficiency like in financial innovations and increase in branch networks. This result supports the findings of Dimitris (2008) that banks that were more profitably and had larger branches had higher operating efficiency. Although from our perspective, increased earnings avail funds for investment in operational efficiency. Regulators should allow banks to engage in other non-intermediation income-generating activities like investment in other assets in order to boost their earnings power. However, as they do that, bank managers should be conscious of the spending on such activities in order to safeguard the core intermediation activities of banks.
5.5. Asset Quality and Bank’s Operating Efficiency
- Loan loss provision to net interest revenue ratio was the optimal proxy variable for asset quality. This is because; of the two proxy variables, loan loss reserve/ impared loans ratio and loan loss provision/net interest revenue ratio that were significant in all the combinations, loan loss provision/net interest revenue ratio had the highest coefficient, meaning higher contribution to explaining variations in operating efficiency compared to loan loss reserve/ impared loans ratio. The ratio was significant at p-value = 0.000 < 0.05. The ratio of loan loss provision to net interest revenue is a measure the relationship between provisions made in the income statement and the interest income over the same period. The result was consistent with the claim by Ezeoha (2011) that sound regulatory structures ensured adherence to laid down rules, guide the corporate governance behaviors of banks and moderate the conducts of banks management. Thus, with this in place, banks may achieve operational efficiency through quality asset portfolio. Berger and Udel (1996) also advocated quality lending, also consistent with this result. Banks should optimally use their huge asset capacity to enhance their earnings profiles. At the same time, banks should avoid reckless lending that would increase the level of unsecured credits in banks’ portfolio that eventually may lead to increased levels of non-performing loans, which in turn may lead to high levels of loan loss provisions by banks. This would go a long way in enhancing operational efficiency for banks.
5.6. Bank Size and Operational Efficiency
- There exists statistical significant structural difference between low market share banks and high market share banks as the effect of the independent variable changes when the analysis introduces dummy variable. This means that the size of a bank in terms of market share is important in determination of bank’s operational efficiency. Banks should work hard to expand their market share through opening of branches and increase in the customer deposits. By doing that, they would increase their operational efficiency through economies of scale and increase in their earnings.