-
Paper Information
- Next Paper
- Previous Paper
- Paper Submission
-
Journal Information
- About This Journal
- Editorial Board
- Current Issue
- Archive
- Author Guidelines
- Contact Us
International Journal of Finance and Accounting
p-ISSN: 2168-4812 e-ISSN: 2168-4820
2016; 5(1): 54-61
doi:10.5923/j.ijfa.20160501.07

Forecasting Stock Market Volatility on Bursa Malaysia Plantation Index
 Abstract
 Reference
 Full-Text PDF
 Full-text HTML
Hui-Shan Lee1, 2, David Ching-Yat Ng1, Teck-Chai Lau1, Chee-Hong Ng3
1Faculty of Accountancy and Management, Universiti Tunku Abdul Rahman, Malaysia
2Faculty of Economics and Management, Universiti Putra Malaysia, Malaysia
3Graduate School of Management, Universiti Putra Malaysia, Malaysia
Correspondence to: Hui-Shan Lee, Faculty of Accountancy and Management, Universiti Tunku Abdul Rahman, Malaysia.
| Email: |  |
Copyright © 2016 Scientific & Academic Publishing. All Rights Reserved.
This work is licensed under the Creative Commons Attribution International License (CC BY).
http://creativecommons.org/licenses/by/4.0/

This research applies the Bursa Malaysia Plantation Index to examine the most suitable forecasting model. The Plantation Index is studied because Malaysia is the world second largest in oil palm producer. Additionally, volatile crude palm oil price has resulted in the Plantation Index becoming more volatile as earnings of plantation companies depend heavily on crude palm oil prices. The forecasting techniques applied were random walk, moving average, simple regression and historical mean. The error in forecasting was measured by symmetric and asymmetric error statistics. The most suitable volatility forecasting technique for Bursa Malaysia Plantation Index was simple regression technique. The findings to a very large extent indicate that although there are different sophisticated forecasting technique, investor, managers and regulators could employ the less costly simple regression method to forecast oil palm related stocks and make their wise decision in investment, management and regulation in oil palm industry.
Keywords: Forecasting, Security market volatility, Volatility forecasting technique, Symmetric error statistics, Asymmetric error statistics
Cite this paper: Hui-Shan Lee, David Ching-Yat Ng, Teck-Chai Lau, Chee-Hong Ng, Forecasting Stock Market Volatility on Bursa Malaysia Plantation Index, International Journal of Finance and Accounting , Vol. 5 No. 1, 2016, pp. 54-61. doi: 10.5923/j.ijfa.20160501.07.
Article Outline
1. Introduction
- Volatility of stock markets has generated much interest among investors because high volatility can bring about huge gains or losses to investors. This directly creates a risk to investors (Poon and Clive 2003). Undeniably, a rational investor always makes an investment decision based on risk and return. There have been numerous studies that have been carried out in order to identify the risk factors. A volatility forecasting technique is used as a risk indicator because it can predict the future trend by tracing the pattern. Numerous practitioners and investors have applied volatility forecasting techniques in stock market valuation and derivative securities in order to help them make better judgment in asset allocations, portfolio choices and to determine the fair value of assets.Stephen (2004) indicated that there are a large number of volatility forecasting techniques but not all techniques are appropriate to be applied in different context. Hence it is important to determine which technique/s is/are superior to forecast the stock market. Identifying the best volatility forecasting technique is a critical job (Brailsford and Faff, 1996). This is because a best predict volatility forecasting techniques not only depends on data availability and predefined assumption but also depends on the quality of data (Abraham et al, 2007).This study seeks to examine the ability of four different types of volatility forecasting technique in predicting the Bursa Malaysia Plantation Index. The research objectives of this are:1. To determine the most suitable forecasting model among the four volatility forecasting techniques.2. To examine the relationship between the period of historical data and accuracy to forecast Bursa Malaysia Plantation Index.3. To determine the degree of under-prediction or over-prediction for each volatility forecasting technique.
1.1. Bursa Malaysia
- Bursa Malaysia is considered a relatively young stock market compared to other capital markets in developed countries such as United States. However, Bursa Malaysia’s growth has been nothing short of stunning since its inception. According to Chong and Puah (2009), the market valuation of Bursa Malaysia in 1980s was estimated as RM43 billion and this had increased to RM1 trillion in 2007.In 2012, Malaysia becomes an oasis and hot spot in a tepid global market for the Initial Public Offerings (IPO) because the second and third world largest initial public offering occurred in Malaysia - Felda Global Ventures Holding Berhad (FGV) and Integrated Healthcare Holding Berhad (IHH). These two stocks were heavily oversubscribed by institutional subscription and the public portion. The FGV and IHH IPOs raised about US$ 3.2 billion and US$ 2 billion respectively. This catapulted Bursa Malaysia ahead other Asian IPO.With the subprime crisis that happened in 2007 – 2008 along with the European Sovereign Debt Crisis, the Bursa Malaysia has become more and more volatile. These two crises had caused Bursa Malaysia Plantation Index to experience high volatility (Figure 1). The Plantation Index had its highest point on 31 December 2007 which was 8089.3 points. When the two crises happened in 2008, it resulted in the Index to slump to its lowest point which was 3119.48 point on 28 October 2008.
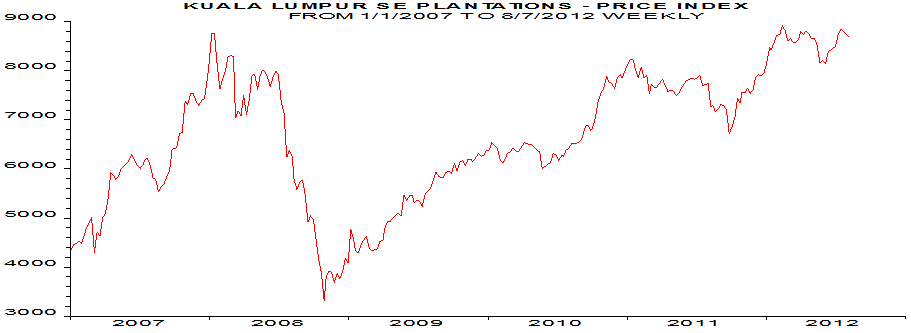 | Figure 1. Bursa Malaysia Plantation Index 1 January 2007 to 7 August 2012 (Adopted from Thomson Datastream, 2012) |
2. Literature Review
- Kumar (2006) tested the ability of different volatility forecasting techniques in the context of Indian stock and forex markets. Volatility forecasting techniques applied in this research were random walk, historical mean, moving average, simple regression, exponential weighted moving average, simple and higher order GARCH models. The results revealed the exponential weighted moving average was the superior technique in predicting the volatility in the stock market while the GARCH (5.1) technique was the superior technique to predict the volatility in forex market.Ercan et. al. (2004) evaluated the out-of-sample forecasting accuracy of eleven models for monthly volatility in fifteen stock markets. The sample period was from 1988 to 1997. The eleven models were random walk model, historical mean model, moving average models, weighted moving average models, exponentially weighted moving average models, an exponential smoothing model, a regression model, an ARCH model, a GARCH model, a GJR-GARCH model, and an EGARCH model. The mean absolute error, root mean squared error, and mean absolute percentage error were used to evaluate the performance of the competing models. According to all of these standard loss functions, the exponential smoothing model provided superior forecasting ability of volatility.
2.1. Theoretical Framework
- The Bursa Malaysia Plantation Index consists of 41 public listed companies. The fundamental influence of the Bursa Malaysia Plantation Index is stock prices of these companies. According to Ng (2012), the slump in commodity prices had resulted in commodity based companies’ stock price to decrease. The decrease price of crude palm oil caused Bursa Malaysia Plantation Index to fall from 8000 points in early 2008 to nearly 3000 points by the end of 2008. Profit margins and earnings of all 41 companies had decreased. It can be concluded that these 41 companies’ stock price were influenced greatly by demand and supply of crude palm oil. Other factors had only indirect effects through changes in 41 companies’ stock price. Figure 2 shows the factors that affect Bursa Malaysia Plantation Index.
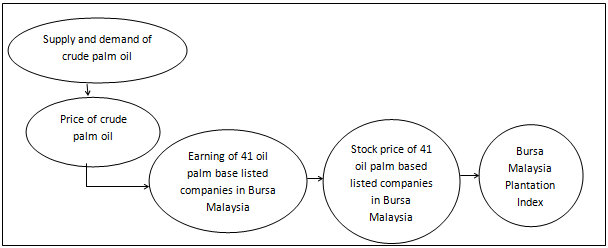 | Figure 2. Factor Affecting Bursa Malaysia Plantation Index |
2.2. Random Walk
- Seyyed (2010) studied the random walk hypothesis in an emerging stock market which is Iran stock market. The daily stock price index of Tehran stock exchange (TEPIX) had been used in this research. The sample period includes 2650 observations during the period 2 January 1999 to October 31 2009. Findings of this research confirmed that past movements in stock prices in Iran stock market cannot be used to predict their future changes. This confirms the Random Walk Theory. Franses and Dijk (1996) examined the forecasting ability of the GARCH I family of models against the Random Walk model in five European stock markets and found that the Random Walk model was more accurate although the data contained extreme events such as 1987 stock market crash.
2.3. Moving Average
- According to Bigalow and Elliot (2004), a simple moving average ranges from 3 days to 1000 days. The 50 to 200 day simple moving average is more reliable to predict the movement of stock prices. Masudul, Lasker and Nahida (2012) used the Random Walk, historical average, moving average, simple regression, exponential smoothing and autoregressive model to examine relative ability of these models to predict Dhaka Stock Exchange (DSE) 20 daily stock index. The results showed that the moving average had the best ability to forecast daily stock indexes.
2.4. Simple Regression
- Bodicha (2003) applied simple regression models to the Nairobi Stock Exchange data. The result showed that the regression models are appropriate for short term forecasting. According to Brailsford and Faff (1996), simple regression model and ARCH class models were accurate models and obtained better performance in predict the volatility in the Australian stock market. Dimson and Marsh (1990) showed that in United Kingdom equity, simple models provide more accurate and better performance than complex models. The authors recommended exponential smoothing and simple regression models.
2.5. Historical Mean
- Poon (2012) stated that random walk technique and historical mean technique were superior techniques to forecast medium and long horizon. The historical mean technique had a superior performance for forecast horizon longer than 6 months with a low frequency of data.
2.6. Error Statistics Evaluation
- According to Brailsford and Faff (1996), there are two types statistics error which were systematic error statistics and asymmetric error statistics. The systematic error statistics are mean error, mean absolute error, root mean squared error and mean absolute percentage error while asymmetric error statistics are mean mixed error under-prediction and mean mixed error over-prediction.
3. Data and Methodology
3.1. Sample Source
- Bursa Malaysia Plantation Daily Index data were collected from Thomson DataStream. Sample of data consists of 6,496 observations. The period under this study was from 1 December 1987 until 30 September 2012. This period of data collection experiences 3 economies crisis which were Asian Financial Crisis, Sub-Prime crisis and the European Sovereign Debt Crisis. Besides that, Bursa Malaysia Plantation Daily Index require large volume of data, thus, the daily sample data should be converted to monthly data.
3.2. Data Analysis
- The raw data of Bursa Malaysia Plantation Daily Index is converted to raw monthly volatility series which is sum of squared daily return. It can be converted by using Equation 1 (Brailsford and Faff, 1996: Ong et. al 2011).
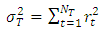 | (1) |
 is rate of return of Bursa Malaysia Plantation Daily Index
 represent number of trading days in one month.After data analysis, the sample data in this project became 289 monthly volatility series data. This project uses the initial set data to forecast later data. The initial set data is 144 monthly volatility series data which start from December 1987 until November 1999 (months T = 1, 2, 3…144). The first month later data is predicted by using initial set data which is month December 1999 (month T = 145). The later data is started from month 145 to 289.
3.3. Volatility Forecasting Techniques
- Random WalkBased on to random walk technique, the volatility in this month is forecasted based on last month's volatility (Brailsford and Faff, 1996: Ong et. al 2011).
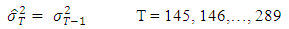 Where
Where  is the monthly volatility series, calculation is defined in equation (1)
 is last month's volatilityHistorical MeanAccording to historical mean technique, the volatility in this month is forecasted based on long term mean of past months’ volatilities (Brailsford and Faff, 1996: Ong et. al 2011).
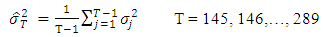 Where
Where  is the monthly volatility series, calculation is defined in equation (1)
 is sum of monthly volatility seriesMoving AverageMoving average is a method of average the stocks’ price. The outcome of moving average is a smooth line where it provides visual aid to users by determines the direction of stocks’ price (Brailsford and Faff, 1996: Ong et. al 2011).
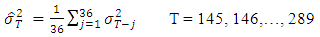 Where
Where  is the monthly volatility series, calculation is defined in equation (1)
 is sum of 36 month volatility series
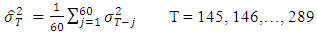 Where
Where  is the monthly volatility series, calculation is defined in equation (1)
 is sum of 60 month volatility series
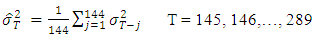 Where
Where  is the monthly volatility series, calculation is defined in equation (1)
  is sum of 144 month volatility seriesSimple RegressionThis technique implemented ordinary least squares (OLS) regression to examine the volatility (Brailsford and Faff, 1996: Ong et. al 2011).
 Where
Where  is the monthly volatility series, calculation is defined in equation (1)
 is coefficient of intercept
  is coefficient of independent variable
  is last month volatility seriesOut Sample Statistics ErrorsOut sample statistics errors are used to find out the most suitable forecasting volatility technique for Bursa Malaysia Plantation Index. The statistics errors are categorized to two which are symmetric error statistics and asymmetric error statistics.Symmetric Error StatisticsDavid et. al. (2000) and Ercan et. al (2004) had applied various statistics to evaluate the errors in forecasting technique. Therefore, this study use four types of statistics errors which is mean error, mean absolute error, root mean squared error and mean absolute percentage error to evaluate the accuracy of volatility forecasting techniques.
 Where
Where  is sum of forecast monthly volatility series, calculation is defined in equation (1)
 is sum of monthly volatility series
 Where
Where  is sum of forecast monthly volatility series, calculation is defined in equation (1)
  is sum of monthly volatility series
 Where
Where  is sum of forecast monthly volatility series, calculation is defined in equation (1)
 is sum of monthly volatility series
 Where
Where  is sum of forecast monthly volatility series, calculation is defined in equation (1)
 is sum of monthly volatility seriesAsymmetric Error StatisticsThe asymmetric error statistics are used to examine under-prediction and over-prediction for each forecasting volatility technique. There are two types of asymmetric error statistics which are mean mixed error (under-prediction) and mean mixed error (over-prediction).
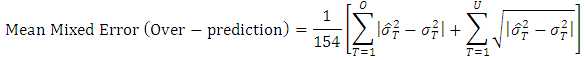 Where
Where  is sum of forecast monthly volatility series, calculation is defined in equation (1)
  is sum of monthly volatility series
  O is the over-predictions number
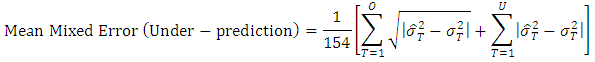 Where
Where  is sum of forecast monthly volatility series, calculation is defined in equation (1)
  is sum of monthly volatility series
  U is the under-predictions number
4. Data Analysis
4.1. Characteristic of Sample
- Figure 3 showed that Bursa Malaysia Plantation Monthly Index had 3 highest volatility points which were on T74, T129 and T250, and monthly volatility at 0.1252, 0.0857 and 0.0050 respectively. The highest volatility happened in February (T74) due to two events. Firstly, the overall performance of balance of trade in 1993 showed the highest surplus position at RM 29,239 million since the Malaysia Independence day. Secondly, the Financial Times Stock Exchange Bursa Malaysia Kuala Lumpur Composite Index (FTSEBM KLCI) hit the highest record at 1,275 points.
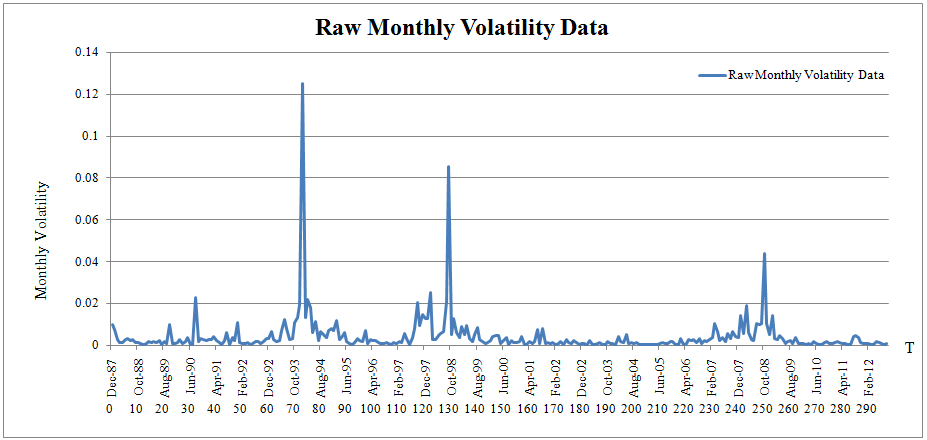 | Figure 3. Volatility of Bursa Malaysia Plantation Monthly Index |
4.2. Error Statistics Results
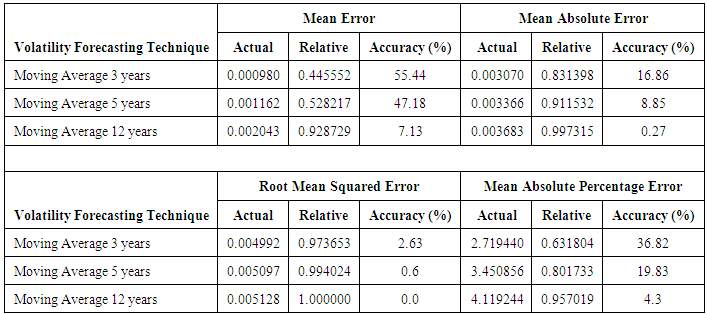
- Table 1 exhibits the results of actual and relative symmetric error statistics for six volatility forecasting techniques. The relative symmetric error statistics was a procedure to standardize error measure. The purpose of applying relative symmetric error statistics was to make the statistic become more easily to interpret in benchmark forecast. Relative symmetric error statistics was calculated by using actual symmetric error statistics of a model divide by of actual symmetric error statistics of worst performing model. Six volatility forecasting techniques were evaluated by symmetric error statistics in order to find out superior volatility forecasting technique.
|
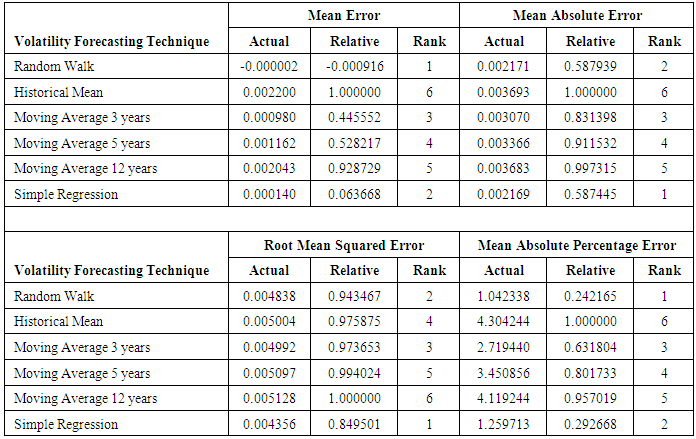
4.3. Superior Forecasting Technique
- The random walk ranks first in mean error and mean absolute percentage error while simple regression rank first in mean absolute error and root mean squared error. But simple regression better than random walk in forecasting Bursa Malaysia Plantation Monthly Index because simple regression ranked first in root mean squared error.The root mean squared error is the best model to explain the overall performance of accuracy volatility forecasting technique. According to Amalia (1999) and Audrino et al. (2014), the reason of root mean squared error being more precise than others systematic error is the root mean squared error is more sensitive to measure occasional large error when compared with other errors. This is because the squaring process gives disproportionate weight to very large errors. Subsequently, the squared root process converts back the data in same units with initial data. Additionally, the root mean squared error is applicable to a large number of analysis, forecast elements and model types. As a result, root mean squared error is an appropriate model to explain the overall performance of forecasting technique. The most suitable volatility forecasting technique in this study was simple regression technique. But this finding was in contrast with David et. al (2000). David et. al used root mean squared error to determine the superior forecasting technique in predicting the weekly and daily UK FTA All Share and FTSE 100 stock index volatility. In their research, the best forecasting technique in weekly and daily was exponential smoothing model and moving average model.The result contrasted with this study’s findings due to three factors. The first factor is different period of sample data were used. David et al. (2000) covered the period from 1969 until 1996 while this study covered from December 1987 until September 2012 which included two recent global economy crises. This showed that two recent crises brought about a substantial changing effect to the trend of the security market. The second factor is different investors’ behavior and culture between Malaysia and United Kingdom that caused a different degree of volatility between the security markets, resulting in different volatility forecasting techniques being required. According to Meir (2008), Malaysia investors behavior are risk takers because collectivistic societies make up Malaysia and have lower income per capita when compared with United Kingdom.The third factor is different security market conditions between Malaysia and the United Kingdom. Bursa Malaysia is relative young when compares with the London Stock Exchange. The market capitalization of London Stock Exchange is US$3.266 trillion which is larger than Bursa Malaysia. Aside from that, the London Stock Exchange is the fourth largest stock exchange in the world. These security market conditions also give rise to different trading volumes with the London Stock Exchange recording a much larger volume when compared to the Bursa Malaysia. This gives rise to different volatility forecasting techniques being required.
4.4. Relationship between Latest Forecasting Data and Accuracy of Forecasting
- Table 2, showed that the short term moving average which was the 3-year moving average perform better than the 12-year moving average. This indicated that accuracy of forecasting Bursa Malaysia Plantation Index based on moving average increased when using latest forecasting data. This is because longer periods in the sample data will include a lot of outdated historical data (Putirka, 2014). According Shih et. al (2011), outdated data could deteriorate the accuracy of forecasting model. The data becomes outdated because the economic conditions keep changing so the business life cycle becomes shorter. The reasons of the business life cycle becomes shorter is the pace of change become faster due to competition globally and from the unexpected. For example, Apple’s IPhone successfully replace Nokia as a global market leader in hand phones. As a result, the changing business environment will change the performance and trend of security market.
|
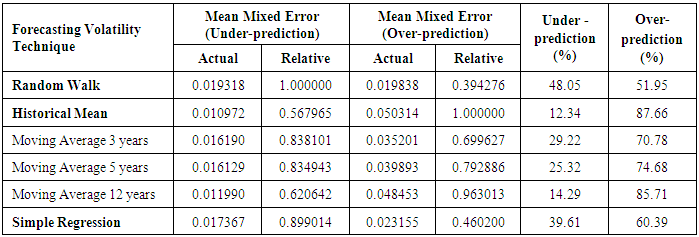
4.5. Asymmetric Error Statistics
- Mean mixed error (Under-prediction) and mean mixed error (Over-prediction) were used to describe potential asymmetry of loss function. The mean mixed error (Under-prediction) was used to penalize under-prediction while mean mixed error (Over-prediction) was used to penalize over-prediction. Sellers who quote the selling price based on under-prediction forecasting technique will experience less earning. Therefore, sellers will put a lot of attention in mean mixed error (Under-prediction) rather than buyers. For buyers, they will put a lot of attention to mean mixed error (Over-prediction) because over-prediction will cause buyers to quote a higher buying price (Byun, 2014). Thus, over-prediction is undesirable for buyer. Table 3 showed the mean mixed error statistics and percentage of over-prediction or under-prediction for six forecasting volatility techniques. Simple regression technique performance in mean mixed error was an over-prediction technique because it had 60.39% over-prediction. Therefore, when investors applied simple regression technique as a forecasting volatility technique, investors need to keep in mind the forecast result obtained from simple regression technique highest probability was over-prediction.
|
5. Conclusions
- The characteristics of volatility Bursa Malaysia Plantation monthly Index showed that Bursa Malaysia Plantation Index was heavily dependent on the Malaysian and global economy. The most suitable volatility forecasting technique in Bursa Malaysia Plantation Index was simple regression technique while the worst forecasting technique was historical mean technique. Simple regression technique used in this research showed the characteristic of over-prediction which mean that monthly volatility Index predicted by simple regression had a higher probability more than actual monthly volatility. This research also showed that using longer period of historical data had caused the accuracy of forecasting to become less accurate. This was because longer period of historical data had more outdated data which was able to affect the accuracy of predicting.
6. Implication
- Based on the findings, there are several implications for the investor, managers and regulators. Investors who invest in oil palm related stocks, managers who manage oil palm related firms and regulators who implement capital controls to regulate the outflow of funds in order to assist the county economy recover from the crisis could forecast the oil palm index by employing simple regression model. The result suggested that simple regression technique showed the characteristic of over-prediction which mean higher probability of monthly volatility more than actual monthly volatility strongly recommended that investor, managers and regulators have to be more conservative in their decision making relates to oil palm, especially during the high volatility of oil palm price during 2014-2015 (Zunaira, 2015). The findings to a very large extent indicate that although there are different sophisticated forecasting technique, investor, managers and regulators could employ the less costly simple regression method to forecast oil palm related stocks and make their wise decision in investment, management and regulation in oil palm industry.