-
Paper Information
- Previous Paper
- Paper Submission
-
Journal Information
- About This Journal
- Editorial Board
- Current Issue
- Archive
- Author Guidelines
- Contact Us
International Journal of Finance and Accounting
p-ISSN: 2168-4812 e-ISSN: 2168-4820
2015; 4(5): 253-261
doi:10.5923/j.ijfa.20150405.04
Interactions between Earnings and Dividend Payout Rate in the Oil and Gas Sector: Evidence from Nigeria (2004 - 2014)
 Abstract
 Reference
 Full-Text PDF
 Full-text HTML
Oliver Ike Inyiama, Ugah Helen
Department of Accountancy, Enugu State University of Science and Technology, Enugu State, Nigeria
Correspondence to: Oliver Ike Inyiama, Department of Accountancy, Enugu State University of Science and Technology, Enugu State, Nigeria.
| Email: |  |
Copyright © 2015 Scientific & Academic Publishing. All Rights Reserved.
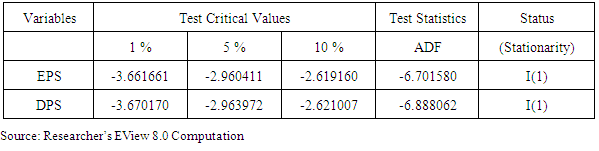
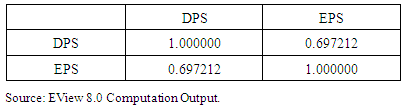
The aim of the study is to determine the nature, direction and significance of the interactions between earnings per share and dividend per share in the Nigeria oil and gas sector from 2004 to 2014. Engle and Granger 2-step co-integration and correlation approach was adopted in the analysis with an estimation of an error correction period. Stationarity of time series data was tested with the adoption of Augmented Dickey Fuller (ADF) procedure. All the study variables were integrated of the same order I(1), signaling a co-integration. Earnings Per Share has a short term positive and significant effect on Dividend Per Share while the long run coefficient shows a negative and significant influence on dividend per share. The error correction mechanism suggests that deviations from equilibrium are corrected at approximately 56% per annum. This implies that the distortions affecting dividend per share in the long run could be corrected in approximately one year and nine months (approximately 21 months). There is no causality running from either EPS to Dividend Per Share or otherwise, both at 1 year and 2 years lagged periods. The implication is that Dividend Per Share does not granger cause EPS and vice versa. The result further reveals that a very strong relationship exists between EPS and DPS at approximately 70%. Firms in the oil and gas sector that intend to increase their dividend pay-out propensity in order to give the shareholders and other proposed investors the signal that they are very healthy, in line with the signaling theory, should, therefore, pursue strategies geared towards cost reduction, elimination of wastes, full automation of production lines and being more socially and corporately responsible to their host communities, in order to improve their earning capacity.
Keywords: EPS, DPS, Oil and Gas, Regression, Co-Integration, Nigeria
Cite this paper: Oliver Ike Inyiama, Ugah Helen, Interactions between Earnings and Dividend Payout Rate in the Oil and Gas Sector: Evidence from Nigeria (2004 - 2014), International Journal of Finance and Accounting , Vol. 4 No. 5, 2015, pp. 253-261. doi: 10.5923/j.ijfa.20150405.04.
Article Outline
1. Introduction
- The world over, crude oil is the largest source of energy today, it powers the global economy and its industrialization processes; fluctuation in the price of crude oil is expected to have significant impact on both importers and the exporters of the product (Abubakar and Umar, 2013). They further stated that Nigeria is an oil producing state and the largest oil producer in Africa; also with 6th position among OPEC membership. The position of crude oil as the mainstay of the economy of Nigeria cannot be over emphasized. However, the impact of the fall in OPEC (Organization of Petroleum Exporting Countries) prices of crude oil export has almost got the economy of Nigeria on its’ knees. The dependence of Nigeria on crude oil production and export, could qualify her as a Dutch Diseased Economy. Dutch Diseased economy is an economy whose original exports were tradable agricultural goods, but shift to export of booming sector that consequently leads to a real exchange rate appreciation and the near extinction of the original agricultural exporting sector (Adebisi, 2012). He emphasized that the expansion of Nigeria’s petroleum exports drained resources from other parts of the economy, brought about a rise in urbanization to the new oil centres and generated an appreciable exchange rate that culminated in a decline in the competitiveness of non-oil exports and of import-competing industries. Dividend distribution by corporate organizations is a fundamental obligation to shareholders and therefore ranks as one of the most important corporate decisions, as a company’s ability to consistently pay out increased levels of dividend over time, conveys information about the management’s assessment of the firm’s future prospects, thereby sending strong signals to the market about its fundaments. The investigation towards the revelation of the key determinants of dividend policy, which is regarded as a puzzle, has been on over years. The research works on this subject has no doubt increased our understanding of the concept of dividend policy and its constituents but the puzzle still persists. This could be the justification for the position taken by a school of thought that researchers have merely contributed to the multiple paradoxes of corporate dividend policy, thereby adding more pieces to an enlarged puzzle rather than finding the final matching piece that would provide a more precise and complete understanding of the determinants of dividend policy. Some investors believe in capital accretion in form of capital gains than annual dividend that may tend to eat deep into corporate investible funds thereby pruning down the planned level of financial performance. Mlonzi, Kruger and Nthoesane (2011) argue that earnings provide critical information to shareholders about firm past performances and are also used extensively in forecasting future performance and in valuation of equity. They emphasized that the primary role of reported earnings and dividend payout propensity is to provide some predictive information about future earnings to both present and potential investors in making rational investment decisions. Therefore, declaration of proposed dividend by the directors at the Annual General Meeting is expected to serve as an indication that the firm is healthy and capable of sustaining and improving upon the current level of financial performance at both short and long run. This view is also supported by the signaling theory.Nwidobie (2013) is of the opinion that the higher these dividends, the satisfied are these owners who see such financial investments as rewarding, and thus attractive to non-owners to invest in; as payment of the reward, dividend, signals good prospects of higher earnings for firms. He stated, while citing Park (2009) that dividend payments are associated with firms with good corporate governance, concluding that firms in legal regimes that focus on protecting investors are more likely to earn more and pay even higher dividends than firms in legal regimes with less investor protection. In terms of shareholders wealth, the conventional wisdom is that a properly managed dividend policy had an impact on share prices and shareholders’ wealth (Gill, Biger and Tibrewala, 2010), as efforts are made by management and the board to continually enhance corporate earnings. They further stated that the reasons why dividend should be paid includes that (i) dividends provide certainty about the company’s financial wellbeing, (ii) dividends are attractive for investors looking to secure current income, and (iii) dividends help maintain market price of the share.The study aims at evaluating the interactions, with regards to causality, relationship, magnitude and nature of influence, between earnings and dividend payout rates in the Nigeria Oil and Gas Sector. The rest of the research paper is organized into four sections as follows: Section 2 reviews existing literature in the area of study, section 3 enlists the methodology applied for analysis, section 4 discusses the empirical results/findings while section 5 concludes after the summary.
2. Review of Related Literature
- Signaling theory by Ross (1977), who created a theoretical model, had its root from the information asymmetry existing between managers as fund users and shareholders as fund providers. The theory assumes that managers have access to more information relating to the value of the firm’s assets than other outside agents and investors. Therefore managers seek to use dividend pay-out policies to signal to the shareholders about the financial performance of their firms. In addition, the firms could also reveal the strategies adopted in pursuing their vision and attaining their mission.An effort to determine the factors that motivate the dividend policy among the cement industry in Karachi Stock exchange and State bank of Pakistan was made by Islam, Aamir, Ahmad and Saeed (2012). It was found that PE ratio, EPS growth and sale growth are positively associated with the dividend payout while profitability and debt to equity were found to have negative association with dividend payout.Factors that determine the dividend payout policy in the Lebanese banks listed on the Beirut Stock Exchange which included profitability, liquidity, leverage, firm size, growth, firm risk and previous year’s dividend payout, was investigated by Maladjian and Khoury (2014). They used OLS and the dynamic panel regressions and found that the dividend payout policies are positively affected by the firm size, risk and previous year’s dividends, but are negatively affected by the opportunity growth and profitability. This implies that firms pay dividends with the intention of reducing the agency conflicts and that Lebanese listed firms prefer to invest their earnings to grow rather than to pay more dividends. Arif and Akbar (2013) made an attempt to evaluate profitability, size, tax, investment opportunities and life cycle stage of firm as determinants of dividend policy in non-financial and sub sectors of non-financial sector of Pakistan. Using panel data and regression analysis, it was revealed that profitability, tax, size and investment opportunities are the most influential determinants of dividend policy.An investigation into whether there are any significant abnormal returns around the public announcement of earnings and to establish whether the efficient capital market hypothesis applies to the small ALtX market was conducted by Mlonzi, Kruger and Nthoesane (2011). The study focused on all the companies listed on the JSE-ALtX that announced annual earnings between 1 January and 31 December 2009 employing Capital Asset Pricing Model (CAPM). Empirical evidence demonstrates that there is substantial negative share price reaction to earnings announcements on the small ALtX stock market. The ALtX also shows the weak form of market efficiency. The study concluded that during a recessionary period, shareholders’ wealth is eroded in the small ALtX market; however, the weak form of market efficiency provides an opportunity for entrepreneurs and investors to exploit the market for profits when the market is performing well.Nuredin (2012) adopted a mixed research approach to conduct a study seeking to find the determinants of dividend policy such as profitability, growth, liquidity, size and leverage of insurance companies in Ethiopia, using panel data and an in-depth interview. The results show that profitability and liquidity positively and significantly influence dividend policy of insurance companies in Ethiopia, whereas growth influences dividend policy negatively and significantly. Size and leverage were found to be insignificant in influencing the dividend policy of insurance companies in Ethiopia.Exploration into the determinants of the dividend policy in Poland, examining whether corporate governance practices determine the dividend policy in the non-financial companies listed on Warsaw Stock Exchange was done by Kowalewski, Stetsyuk and Talavera (2007). The results suggest that large and more profitable companies have a higher dividend payout ratio. The other ay round, concentrated share ownership as well as the deviation from the one-share-one-vote principle leads to a reduction of the payout dividend ratio, suggesting that dividends may signal the severity of conflicts between controlling owners and minority shareholders. The study found support for the fee cash flow hypothesis implying that dividends in Poland have less of a signaling role than in the developed capital markets.In an attempt to contribute to solving the dividend puzzle, Moscu (2010) carried out a study to determine the dividend policies for 209 companies listed on London Stock Exchange and Paris Stock Exchange in 2010 and to explain their dividend payment behavior. He estimated some models to examine the impact of firm profitability, return on assets, firm size, previous year's dividend, free cash-flow, total shareholder return, corporate tax, dividend yield and ownership structure on dividend payout ratios. The results show that UK companies pay high dividends if ownership is a more dispersed one and cash from basic activity (free cash flow) is enough to be allocated to equity holders. In France, the determinants of dividend policy were found to be earnings per share, dividend from the previous year and indebtedness.An exploration of the determinants of dividend payout ratios for the American service and manufacturing firms was done Gill, Biger and Tibrewala (2010). They found that dividend payout ratio is the function of profit margin, sales growth, debt-to-equity ratio, and tax. However, for firms in the Services industry, the dividend payout ratio is the function of profit margin, sales growth, and debt-to-equity ratio and for manufacturing firms, it was found that dividend payout ratio is the function of profit margin, tax, and market-to-book ratio. The relationship between profitability and dividend payout in Korean banks during 1994 –2005 was examined by Lee (2009) using panel data. He found that the banks with higher profitability or performance pay more dividends and very strong, significant, and consistent evidences that the safer banks pay more dividends.Lintner (1956) adopted dividend model to examine the dynamics and determinants of dividend payout policy of 320 non financial firms listed in Karachi Stock Exchange. The outcome of the analysis reveals that Pakistani listed non-financial firms depend on both current earning per share and past dividend per share to set their dividend payments. Though, dividend tends to be more sensitive to current earnings than prior dividends. It was also revealed that profitable firms with more stable net earnings can afford larger free cash flows and therefore pay larger dividends, while ownership concentration and market liquidity also have positive impact on dividend payout policy. Investment opportunities and leverage, capitalization and size of the firms exert negative impact on dividend payout policy.Al-Kuwari (2009) investigated the determinants of dividend policies using a panel dataset of non-financial firms listed on the GCC country stock exchanges and a series of random effect Tobit models, impact of government ownership, free cash flow, firm size, growth rate, growth opportunity, business risk, and firm profitability on dividend payout ratios were among the factors considered. It was revealed that the main characteristics of firm dividend payout policy were that dividend payments related strongly and directly to government ownership, firm size and firm profitability, but negatively to the leverage ratio. This implies that firms pay dividends with the intention of reducing the agency problem and maintaining firm reputation, since the legal protection for outside shareholders was limited.An examination of the determinants among dividend payout of non-financial firms listed on Nairobi Securities Exchange which included profitability, growth, current earnings, liquidity, size and business risk was done by Musiega, Alala, Musiega, Maokomba and Egessa (2013). Using purposive sampling technique for sample selection of 30 non-financial companies and descriptive statistics and multiple regressions for analysis, it was found that return on equity, current earnings and firms’ growth activities were positively correlated to dividend payout. Business risk and size were found to be among the major determinants of dividend payout.An exploration of the determinants of the dividend policy of firms in the Japanese electrical appliances industry was conducted by Tsuji (2010). The research outcome reveals that corporate managers do not cater for investors’ demands in both their dividend initiation and continuation decisions. The determinants of firm’s dividend policies in the Japanese electrical appliances industry are value-weighted dividend yields, value weighted non-payers’ size, and value-weighted after-tax earnings-to-total-asset ratios. It further reveals that dividend payments tend to decrease company earnings in the Japanese electrical appliances industry in contravention of the traditional signaling hypothesis.Zaman (2013) examined bank profitability, growth, and size by using multiple regression and correlation, as potential determinants of dividend policy in Dhaka Stock Exchange of Bangladesh. The study reveals that while profitability appears to be a better determinant of bank dividend policy than a bank’s growth and size, it may not be concluded that profitability alone is a strong indicator of bank dividend policy over time in the capital market of Bangladesh.An examination of the factors determining dividend represented by Dividends per share for non- financial companies in the Saudi Arabia stock exchanges (TASI) was conducted by Alzomaia, and Al-Khadhiri (2013) applying regression model and using panel data. The impact of Earnings per share (EPS), Previous Dividends represented by dividends per share for last year, Growth, Debt to Equity (D/E) ratio, Beta and Capital Size on Dividends per Share was considered. It was revealed that Saudi listed non-financial firms rely on current earnings per share and past dividend per share of the company to set their dividend payments.Hellström and Inagambaev (2012) examined the relationship between a number of company selected factors such as free cash flow, growth, leverage, profit, risk and size and the companies’ dividend payout ratios, using both an Ordinary least square (OLS) and a Tobit regression. Previous studies were reviewed as well as dividend theories in order to conclude which factors that potentially could have an impact on the companies’ dividend payout ratios. The dividend payout ratios of large caps were found to have a significant relationship with free cash flow, growth and risk, while the dividend payout ratios of medium caps have a significant relationship with free cash flow, leverage, risk and size.,The review of related literatures revealed that studies in this area concentrated more on banks and non-bank financial institutions with a scanty study of the manufacturing sector. Most of the existing studies were done in developed countries of Europe and America with less emphasis on emerging economies of Africa to which Nigeria belong. It was also observed that the methodology dealt more on assessing relationships and evaluating effects of the independent variables on the dependent variable. However, considering these gaps, this study aims at carrying out an analysis of the interactions between earnings and dividend payout rate in Nigeria Oil and Gas Sector from 2004 to 2014.
3. Methodology
- ● DataThe research was conducted in the petroleum sector of Nigeria with eight companies listed in Nigeria Stock Exchange namely African Petroleum Plc, Afroil Plc, Chevron Oil Nigeria Plc, Conoil Plc, Eterna Oil & Gas Plc, Mobil Oil Nigeria Plc, Oando Plc and Total Nigeria Plc. Availability of data is key to an ex post research of this nature, hence Mobil, Total and Conoil Company were selected and used for data collection and analysis. Annual data was obtained for earnings per share and dividend per share from the annual report and accounts of the selected companies. Other companies in the sector had scanty information about the variables under consideration.
4. Discussion of Findings
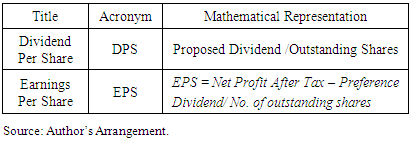
- ● Dividend Per Share (DPS)
|
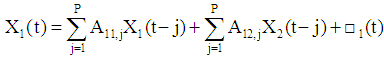
 | (1) |
 | (2) |
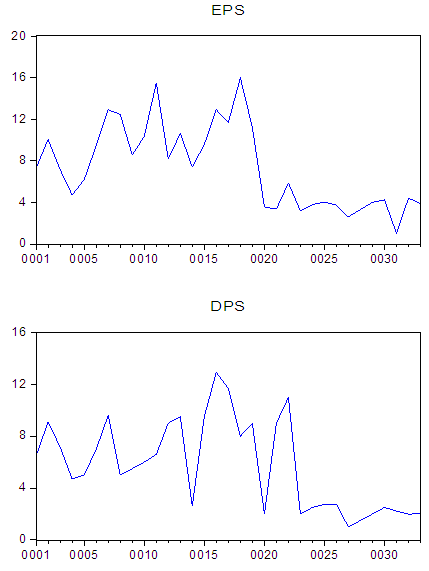 | Figure 1. |
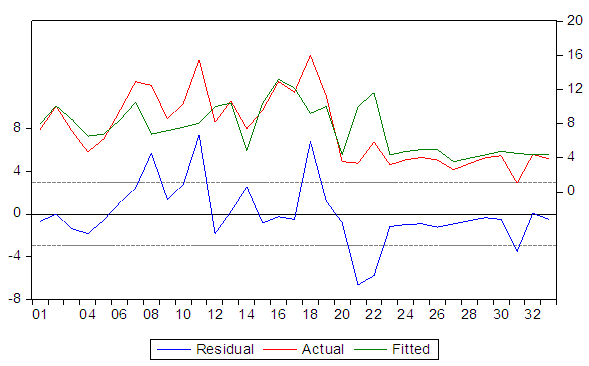
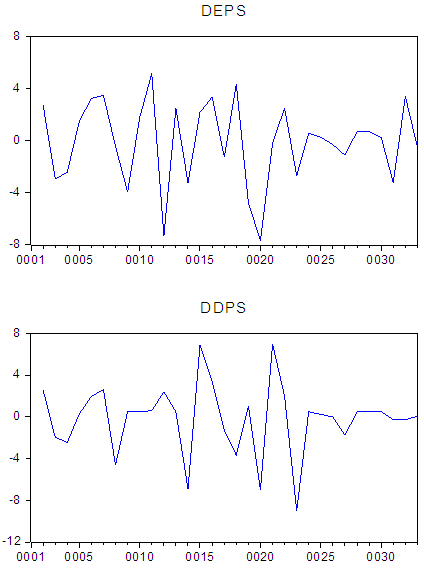 | Figure 2. Graphical Representation of the Variables after differencing at I(1). Source: Author’s EView 8.0 Output |
|
|
 | (3) |
 | (4) |
|
|
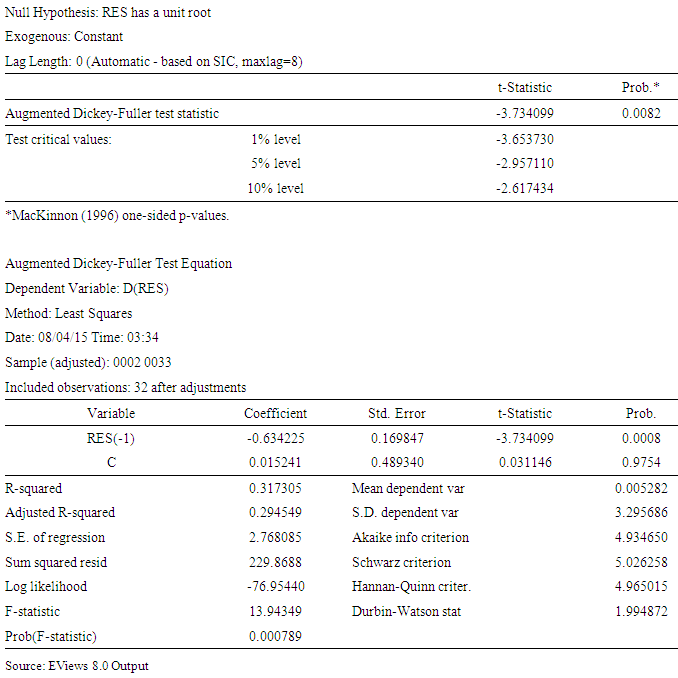
 | Figure 3. Residual graph of the parsimonious model. (Source: EViews 8.0 Output) |
|
|
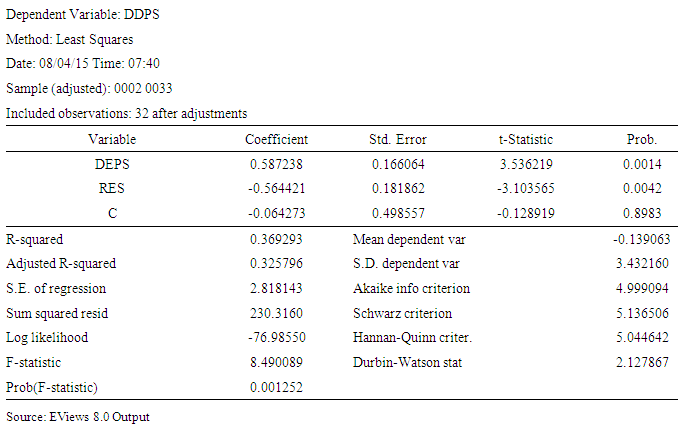
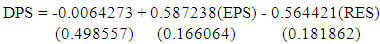 Table 7 reveals the comprehensive effect of EPS on DPS in Nigeria Oil and Gas sector. The outcome of the regression analysis shows that Earnings Per Share has a short term positive and significant effect on Dividend Per Share while the long run coefficient shows a negative and also significant influence on Dividend Per Share by EPS at 5 percent level of significance. This is supported by the fact that the P-Values of 0.0014 for Earnings Per Share in the short term and 0.0042 for Earnings Per Share in the long term are both less than 0.05 which is the level of significance. The result further indicates that a unit change in EPS at the short term will give rise to a 0.587238 increase in DPS while in the long run, a unit change in EPS could trigger a 0.564421 decrease in DPS. The Error Correction Mechanism (ECM) suggests that deviations from equilibrium could be corrected at approximately 56% per annum. This implies that the distortions affecting dividend per share in the long run could be corrected in approximately one year and nine months (approximately 21 months).
|
5. Summary and Conclusions
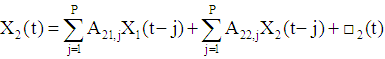
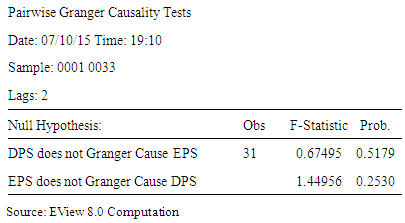
- The study aims at determining the extent to which dividend per share is influenced by annual earnings and the nature and magnitude of their causalities. The researcher applied the 2-step cointegration and error correction model of Engle and Granger (1985) in a simple regression framework. Earning (proxied by Earnings Per Share) has a short term positive and significant effect on Dividend Per Share while the long run coefficient shows a negative and significant influence on dividend per share. On causalities, there is no causality running from either earnings per share to dividend per share or otherwise, both at 1 year and 2 years lagged periods. The implication is that earnings do not granger cause dividend pay-out rate and vice versa. The long term negative and significant relationship is in line with our a priori expectation that an increase in earnings in a year is expected to increase dividend per share for that year. When production machineries are new and the company is young, maintenance costs will be low and the fixed assets produce at optimal capacity and this has a direct bearing on financial performance and by extension, the annual dividend. According to the life cycle theory, as the company advances in age, it will begin to take up investment opportunities in a bid to grow and expand. In this stage, the company tends to play down on dividend pay-out and retains more for investments. This accounts for the decline in dividend per share, at the long run, against retentions in line with the life cycle theory. This implies that consistent with the bird-in-hand and life cycle theories, very young companies pay more dividend but as the firms advance in age, they retain more earnings than pay dividend. Firms in the oil and gas sector that intend to increase their dividend pay-out propensity in order to give the shareholders and other proposed investors the signal that they are very healthy, in line with the signaling theory, should, therefore, pursue strategies geared towards cost reduction, elimination of wastes, full automation of production lines and being more socially and corporately responsible to their host communities, in order to improve their earning capacity.