-
Paper Information
- Previous Paper
- Paper Submission
-
Journal Information
- About This Journal
- Editorial Board
- Current Issue
- Archive
- Author Guidelines
- Contact Us
International Journal of Finance and Accounting
p-ISSN: 2168-4812 e-ISSN: 2168-4820
2015; 4(3): 180-186
doi:10.5923/j.ijfa.20150403.05
Cost Efficiency of Chinese Commercial Banks
 Abstract
 Reference
 Full-Text PDF
 Full-text HTML
Hailing Zhao, Sangmok Kang
Department of Economics, Pusan National University, Busan, South Korea
Correspondence to: Sangmok Kang, Department of Economics, Pusan National University, Busan, South Korea.
| Email: |  |
Copyright © 2015 Scientific & Academic Publishing. All Rights Reserved.
This study measures cost efficiencies of 18 Chinese commercial banks, divided into the state-owned banks and the joint-stock banks, by the translog cost function based on stochastic frontier analysis (SFA), and proves that translog cost function is more suitable in this study than Cobb-Douglas cost function. The finding shows that there is an upward trend in the overall mean of cost efficiencies of both the state-owned banks and the joint-stock banks, and the cost efficiencies of the state-owned banks has improved greatly. Moreover, the cost efficiency gap between the state-owned banks and the joint-stock banks decreased, and the overall cost efficiency of 18 Chinese commercial banks increased.
Keywords: Cost efficiency, Translog cost function, Chinese commercial banks
Cite this paper: Hailing Zhao, Sangmok Kang, Cost Efficiency of Chinese Commercial Banks, International Journal of Finance and Accounting , Vol. 4 No. 3, 2015, pp. 180-186. doi: 10.5923/j.ijfa.20150403.05.
Article Outline
1. Introduction
- As the Chinese government gradually opens their finance market to the outside world, many foreign financial institutions have entered the Chinese markets. Before China opened its finance market, Chinese commercial banks had a monopolistic position. Hence, the cost efficiencies of Chinese commercial banks have remained relatively poor. Faced with entry of foreign financial institution, Chinese commercial banks must work to maintain original market share. After the Chinese commercial banks became listed companies, the efficiencies of these banks have been vastly improved. Particularly, after the local banks became joint-stock banks, many famous financial institutions bought the significant shares of these banks and became the biggest shareholders. These famous financial setups not only brought adequate capital, but also introduced advanced managerial methods. Therefore, the efficiencies of these banks have improved to a large extent. However, there are still many problems that are having a negative effect on the cost efficiency of Chinese commercial banks. Since 2006, Chinese housing prices have started to rise, so the Chinese central bank raised deposit-reserve ratio 28 times during 2006-2010. In addition, it continued to increase the interest rate of deposits and loans to curb the increase of housing prices. Because of these reasons, operating costs kept rising. Hence, it is vital to effectively manage and improve the cost efficiency for the Chinese commercial banks.This paper consists of six sections as outlined below: Section 2 will introduce existing studies. Section 3 introduces translog function of cost efficiency. Section 4 shows sample data used in this paper. Furthermore, estimated results are illustrated in section 5, including cost efficiencies and the estimated values of the translog function of cost efficiency. Section 6 contains concluding remarks.
2. Literature Review
- Fu and Heffernan (2007) [1] employs the stochastic frontier approach (SFA) to investigates the cost X-efficiency in the Chinese banking sector over the period of 1985-2002, and identifies the significant variables influencing X-efficiency. The results show that banks are operating 40-60% below the X-efficiency frontier, and the joint-stock banks are more X-efficient than the state-owned banks. Shen and Chen (2010) [2] re-investigates the Taiwanese bank cost efficiency by a combination of two strands of literature. Jiang, Yao, and Zhang (2009) [3] applies the stochastic distance function approach to examine the technical efficiency of bank, and differentiates the static, selection and dynamic governance effects on bank efficiency from 1995 to 2005. The results show that bank efficiency has improved, and joint-stock ownership is associated with better performance in terms of profitability than the state-ownership. Dong, Hamilton, and Tippett (2013) [4] estimate cost efficiency and economies of scale based on an unbalanced panel data set of Chinese banks during the period 1994-2007, and findings reports that moderate consistency between parametric and non-parametric frontier methods in efficiency scores rankings, identification of best and worst practise banks, the stability of efficiency scores over time and correlation between frontier efficiency and accounting based performance measures. Akkaya (2013) [5] analyses by SFA with four different estimators how cost efficiency in Swedish financial enterprises has changed since the banking crisis in 1993, and findings show that the other mortgage institution are more efficient than other financial enterprises. In addition, other credit market companies are less inefficient than other financial enterprises. Bhattacharyya and Pal (2013) [6] estimate technical efficiency of Indian commercial banks from 1989 to 2009, using a multiple-output generalized stochastic production frontier and analyse the effects of financial reforms on estimated efficiency. The results show that Indian commercial banks were operating with 64% efficiency on average and declined consistently before increasing towards the end of the sample period.
3. Methodology
- This paper applies stochastic frontier approach to measure cost efficiency of 18 Chinese commercial banks. Schmidt and Lovell (1979) [7] reported in their study that the log-likelihood of the cost frontier is the same as that of the production frontier, except for a few sign changes. The log-likelihood functions for the cost function analogues of the Battese and Coelli (1995) [8] models were also found to be obtained by making a few simple sign changes, hence referring to frontier production function, the cost model can be defined [9]
 | (1) |
 is a (K+1) column vector of unknown parameters to be estimated; ui is a non-negative random variable, which are assumed to account for the cost of inefficiency in production.The ratio of the observed cost for the i-th firm, relative to the potential cost, defined by the frontier function, given the output vector, xi, is used to define the cost efficiency of the i-th firm:
 | (2) |
 is minimum cost and Ci is actual cost. The equation (2) is a measurement of cost efficiency, of which the value is equal or less than one. Based on Battese and Coelli (1992) [10], these equations of frontier cost function can be changed:
 | (3) |
 | (4) |
 | (5) |
 Where
Where  is estimated parameter; T is basic year. When
  it means that equation (3) is a time-varying inefficiency model. If
  equation (3) is changed into the time-invariant model. If
  cost inefficiency decreases with time change, and vice versa.Using maximum-likelihood estimation to calculate
 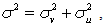 and
and  ,
,  has a value between zero and one. If
  it means that Uit can be deleted from the frontier cost model. In other words,
  means that cost inefficiency does not exist and the difference between the real value and optimal value is caused by Vit. So the function can use OLS to estimate in this case.The general form of translog frontier analysis is shown as equation (6).
 | (6) |
 | (7) |
 | (8) |
 | (9) |
 and
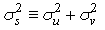
and  Battese and Corra (1977) [12] suggested that the parameter,
  be used because it has a value between zero and one, whereas
  the parameter could be any non-negative value. In addition, it is necessary to perform a likelihood ratio test to examine whether the regression results are efficient or not. In the analysis of the stochastic frontier, null hypothesis can assume
  namely,
  If the null hypothesis is accepted, Uit can be eliminated. Uit=0 means that cost inefficiency does not exist in the model. In other words, we do not need to use MLE, but OLS regression.When alternative hypothesis is
  cost inefficiency exists in the model. When
  inefficiency is totally the result of cost inefficiency. However, the test
  of is a one-side test, so
  must not be negative. The LR test statistic is calculated as
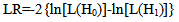 | (10) |
4. Data
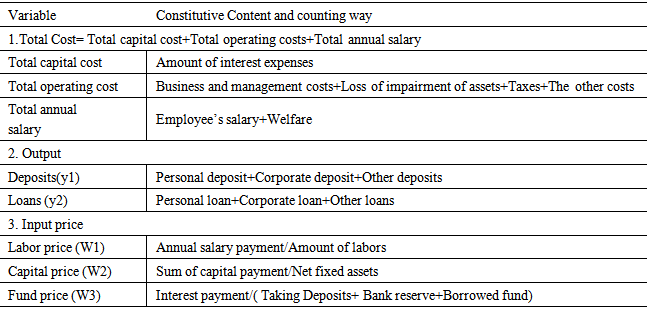
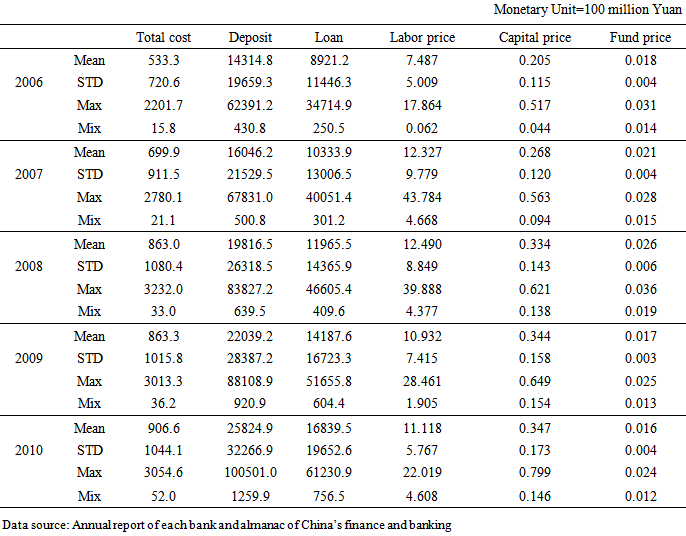
- Sample data of this paper consists of five state-owned banks and thirteen joint-stock banks over the period of 2006-2010. The variables includes total cost, deposits and loans as outputs as well as labour price, capital price and fund price as input prices. Moreover, the component of the variables is shown in table 1.
|
|
5. Results
5.1. Estimation of Cost Function
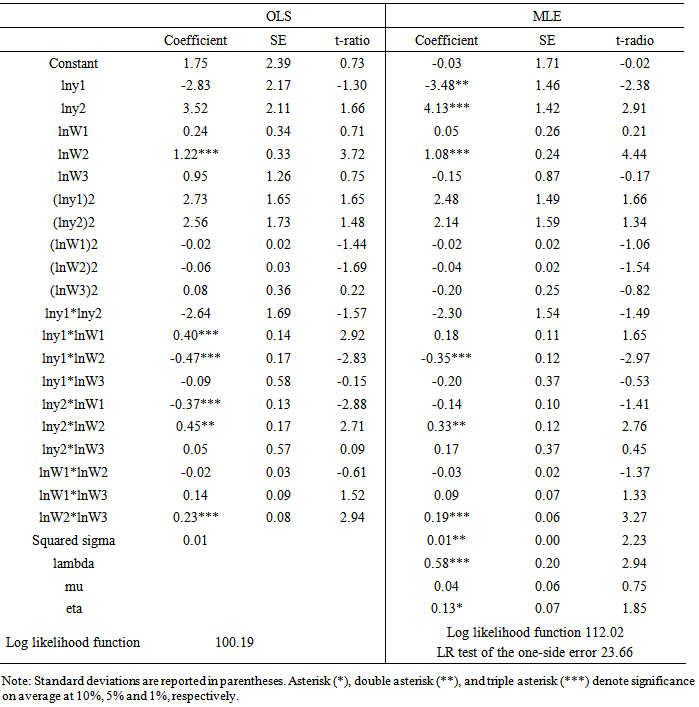
- Table 3 illustrates estimation of the cost function based on ordinary least square (OLS) and maximum likelihood estimate (MLE), respectively. Regression results based on MLE are significantly better than those based on OLS. In the MLE estimation, deposits, loans, and capital price have a significant impact on total cost, while only capital price significantly affects total cost in the regression results of OLS. Moreover, coefficient of
 is significant and the value is 0.58, which means 42% of cost inefficiency derives from effect of external environment.
|
5.2. Hypothesis Test
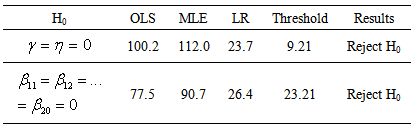
- Table 4 shows the results of hypothesis tests. Based on the result of first hypothesis test, MLE should be used in this paper. Moreover, the second hypothesis test is practiced for the accuracy of the cost functional form. The H0 insists that the Cobb-Douglas function is correct. According to the result of second hypothesis test, translog cost function is more appropriate than Cobb-Douglas cost function.
|
5.3. Cost Efficiency
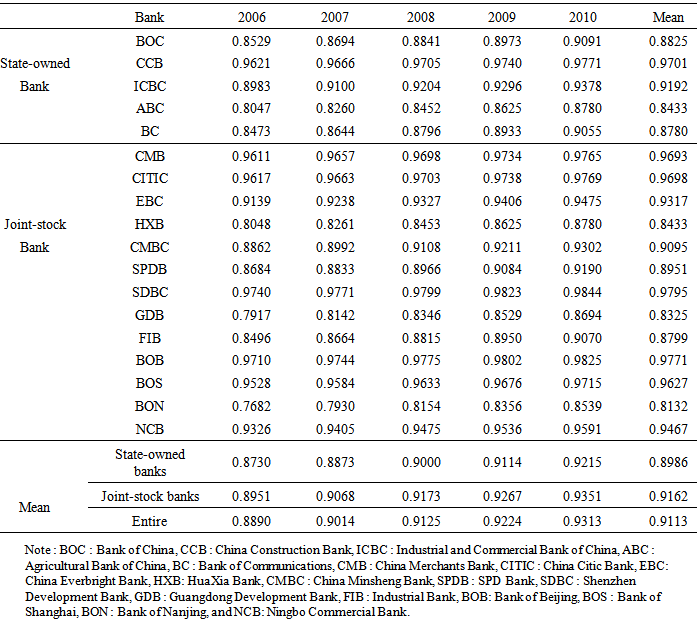
- Table 5 illustrates cost efficiency of each Chinese commercial bank during 2006-2010. As can be seen in table 5, the entire mean cost efficiency of 18 Chinese commercial banks (0.9113) lies at a relatively higher level but increases over the sample period. Moreover, the overall mean of cost efficiency of joint-stock banks was higher than that of state-owned banks through the whole period of 2006-2010, and there was an upward trend on the overall mean of cost efficiencies of state-owned banks and joint-stock banks as well.
|
6. Conclusions
- This article uses translog cost function to measure cost efficiencies of the 18 Chinese commercial banks, including 5 state-owned banks and 13 joint-stock banks, during the period of 2006-2010. The results show that the overall mean of the 18 Chinese commercial banks lies at the higher level (0.9113), and the cost efficiencies of the 13 Chinese joint-stock banks (0.9162) are relatively higher than those of the 5 Chinese state-owned banks (0.8986). Moreover, the difference of the cost efficiencies between the state-owned banks and the joint-stock banks is much smaller than before, which contributes to Chinese financial reform. Cost efficiency of the CCB bank is greatest among the state-owned banks, and that of the SDBC is highest among the joint-stock banks. Furthermore, the hypothesis tests prove that translog cost function is more appropriate in this study than Cobb-Douglas cost function.Furthermore, compared with foreign experience, China and other countries have much in common. Hasan and Marton (2002) [13] analyse cost efficiency and profit efficiency of Hungarian banking during the transitional process from a centralized economy to market-oriented system, and report that banks with foreign involvement were found to be significantly less inefficient than their domestic counterparts and a higher share of foreign ownership was associated with lower inefficiency. Tzeremes (2014) [14] indicates that at the start of Global Financial Crisis, Indian national banks’ technical efficiency levels were relatively unaffected compared to the technical efficiency levels of the foreign and domestic private banks. Casu et al. (2013) [15] and Fujii et al (2014) [16] support the same conclusion that the ownership structure affects directly banks’ performance levels. This study confirms the aforementioned conclusions suggesting ownership plays an important role on effect on efficiency of banking industry.In addition, Fries and Taci (2005) [17] measure cost efficiencies of 289 banks in 15 East European countries in order to analyse transformation of banking industry in the post-communist transition, and agree with aforementioned conclusion that privatised banks with majority foreign ownership are the most efficient and private banks are more efficient than state-owned banks. Because both China and East European countries are post-communist, the results of them are more comparable. There is the same status that the cost efficiency of Chinese state-owned banks is lower than that of Chinese joint-stock banks, but the efficiency gap keeps decreasing. Nowadays, China still lies in the stage of gradually opening financial market to foreign investors, so it is beneficial for Chinese banking to further improve the overall efficiency as overseas capital further flow into Chinese financial market. Particularly, Chinese government has been fully supporting banking industry, then performance of Chinese banking will be expected to vastly improve at the same time. Although official direct supervision and protection to the state-owned banks enhance banking performance, Keeley (1990) [18] suggests that financial deregulation increases the degree of competition in the market, which thereby induce banks managers to undertake imprudent risks. Hence, Chinese government has to take into account how to promote efficiency of banking industry by fully utilising overseas capital and management technique and to enhance competitiveness of banking industry without protection and help from government.