-
Paper Information
- Paper Submission
-
Journal Information
- About This Journal
- Editorial Board
- Current Issue
- Archive
- Author Guidelines
- Contact Us
International Journal of Finance and Accounting
p-ISSN: 2168-4812 e-ISSN: 2168-4820
2014; 3(5): 327-334
doi:10.5923/j.ijfa.20140305.07
Credit Risk Assessment for a Small Bank by Using a Multinomial Logistic Regression Model
 Abstract
 Reference
 Full-Text PDF
 Full-text HTML
Michiko Miyamoto
Akita Prefectural University, Yurihonjo, Akita, Japan
Correspondence to: Michiko Miyamoto, Akita Prefectural University, Yurihonjo, Akita, Japan.
| Email: |  |
Copyright © 2014 Scientific & Academic Publishing. All Rights Reserved.
The purpose of this study is to investigate indicators needed for credit risk measurement for the small bank, using financial information, as well as corporate information the bank collected over the years of relationships by using a multinomial logistic regression model.The analyses in this study show that not only financial information but non-financial information is the valuable source for a small bank risk assessment.
Keywords: Credit risk assessment, Small bank, Multinomial logistic regression model
Cite this paper: Michiko Miyamoto, Credit Risk Assessment for a Small Bank by Using a Multinomial Logistic Regression Model, International Journal of Finance and Accounting , Vol. 3 No. 5, 2014, pp. 327-334. doi: 10.5923/j.ijfa.20140305.07.
Article Outline
1. Introduction
- Financial statements and non-financial information are an important consideration in credit risk analyses for a small bank (Miyamoto 2014). The purpose of this study is to investigate indicators needed for credit risk measurement for the small bank, using financial information, as well as corporate information the bank collected over the years of relationships by using a multinomial logistic regression model. Traditionally, multiple discriminant analysis and logit regression are the preferred statistical techniques for credit risk modeling. However, non-financial information here contains categorical variables. For example, ‘‘education’’ is measured by highest degree attained, using the categories none, high school, bachelor’s, college dropout, and vocational school; it is interval when measured by number of years of education, using the integers 0, 1, 2, … Multinomial logistic regression is an accepted statistical method for assessing association between an anticedant characteristic (risk factor) and a quantal outcome (probability of default), statistically adjusting for potential confounding effects of other covariates. This area has not been well exposed so far, and the results will be valuable for the credit risk assessment for small banks.
2. Related Literature
2.1. Small Business Lending by Small Banks
- Small banks have traditionally been considered better positioned to make loans to the local small business. Small banks depend more on non-financial information principally because reliable financial data of small business loan applicants are not available, and small banks have better understanding of local business and economic conditions through informal meetings and conversations with business owners (Feldman, 1997). From a credit risk point of view, SMEs are different from large corporates for many reasons. Small banks rely more on non-financial information collected by personal contact, community ties and close lender–borrower relationships, because small business borrowers who are major loan clients of small banks tend to be more informationally opaque than large banks (Cole, et al, 2004; Berger and Udell, 2006).
2.2. Modeling Financial Default
- There are two approaches to default modelling: 1) discriminant analysis, and 2) probit and logit analysis. Discriminant analysis, like probit and logit analysis, is used to determine which variables discriminate between two (or more) naturally occurring groups, for example, default and no default. Logit and probit regression analysis are the multivariate techniques which allow for estimating the probability that an event occurs or not, by predicting a binary dependent outcome from a set of independent variables. The response,
 , is equal to 0 if default occurs (with probability
  ) and to 1 if default does not occur (with probability 1 –
 ). In regression models, the probability
  that the default will occur by specifying the following model
 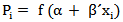 | (1) |
 are particular financial indicators and α, β are estimated parameters. In logit model, the logistic transformation is used:
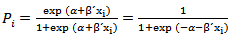 | (2) |
 and assuming that defaults are independent, the logarithm of likelihood function is formed as follows:
 | (3) |
2.3. Multinomial Logistic Regression Model
- Multinomial logit models are used to model relationships between a polytomous response variable and a set of regressor variables. Multinomial logistic regression is a simple extension of binary logistic regression that allows for more than two categories of the dependent or outcome variable, suggested by McFadden (1974), called it a discrete choice model. A binary logistic regression model compares one dichotomy (for example, passed-failed, default-survived, etc.) whereas the multinomial logistic regression model compares a number of dichotomies. Like binary logistic regression, multinomial logistic regression uses maximum likelihood estimation to evaluate the probability of categorical membership. According to Hosmer and Lemeshow (2004), let assume that the categories of the outcome variable, Y are coded 0, 1, or 2. In the three outcomes, category model to logit functions are needed. Use Y=0 as the referent, or baseline, outcome and to form logit functions comparing each other category to it. To develop the model, assume there are p covariates and a constant term, denoted by vector x, of length p+1, where
 . The two logit functions are denoted as
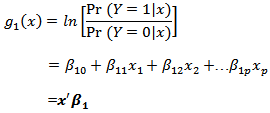 and
and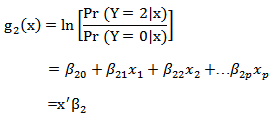 It follows that the conditional probabilities of each outcome category given the covariate vector are
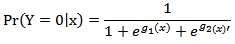
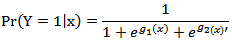 and
and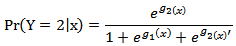 A general expression for the conditional probability in the three category model is
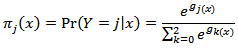 where the vector
  .The conditional likelihood function for a sample of n independent observations is
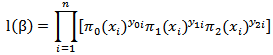 where if Y=0 then
  then
then  and
and  ; if Y=1 then
  , and
, and  ; and if Y=2 then
  . And no matter what value Y takes on, the sum of these variables is
  .
.3. Data
- In this paper I analyze credit risk assessment by using both financial and non-financial dataset consists of nearly 4,955 loans to individual entrepreneurs and small enterprises extended by one bank located in the provincial city of Japan over the period 2002 to 2004. The data provide information on each firm’s balance sheet and income statement; its credit history; the firm’s characteristics, including industrial classification, organizational form, and age; and demographic characteristics of each firm’s primary owner, including age, education, experience, and credit history. Descriptive data and differences in averages for individual entrepreneurs and small enterprises are shown in Table 1. There are statistically significant differences in averages are seen between individual entrepreneurs and small enterprises, except ROA, ratio of current expense to current income, number of mortgages, number of delinquents within one year, number of borrowings within one year, and number of borrowings from credit companies.
 | Table 1. Descriptive statistics for individual entrepreneurs and small enterprises |
4. Empirical Results
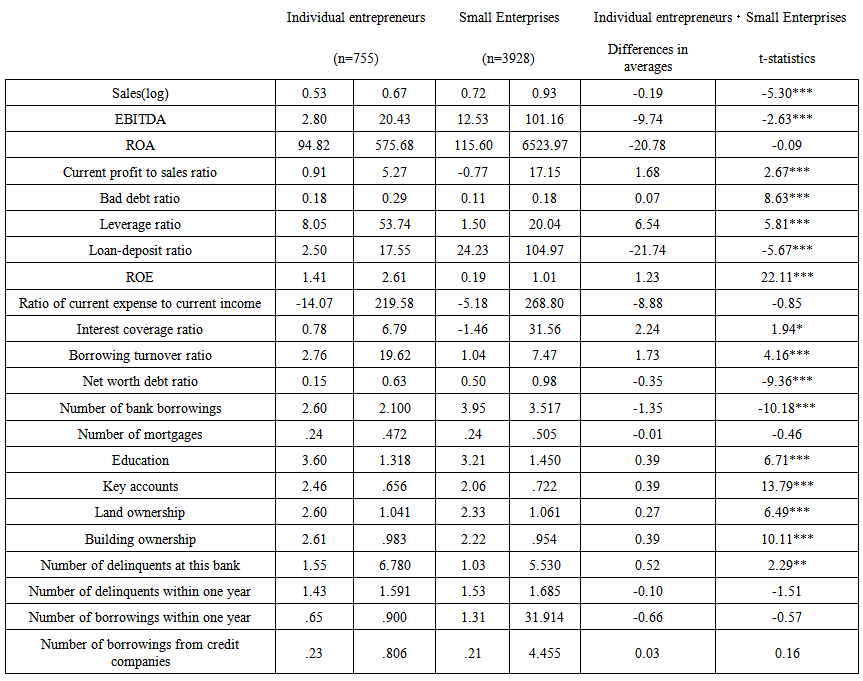
- Table 2 shows results of multinomial logit model for individual entrepreneurs and small enterprises, respectively.
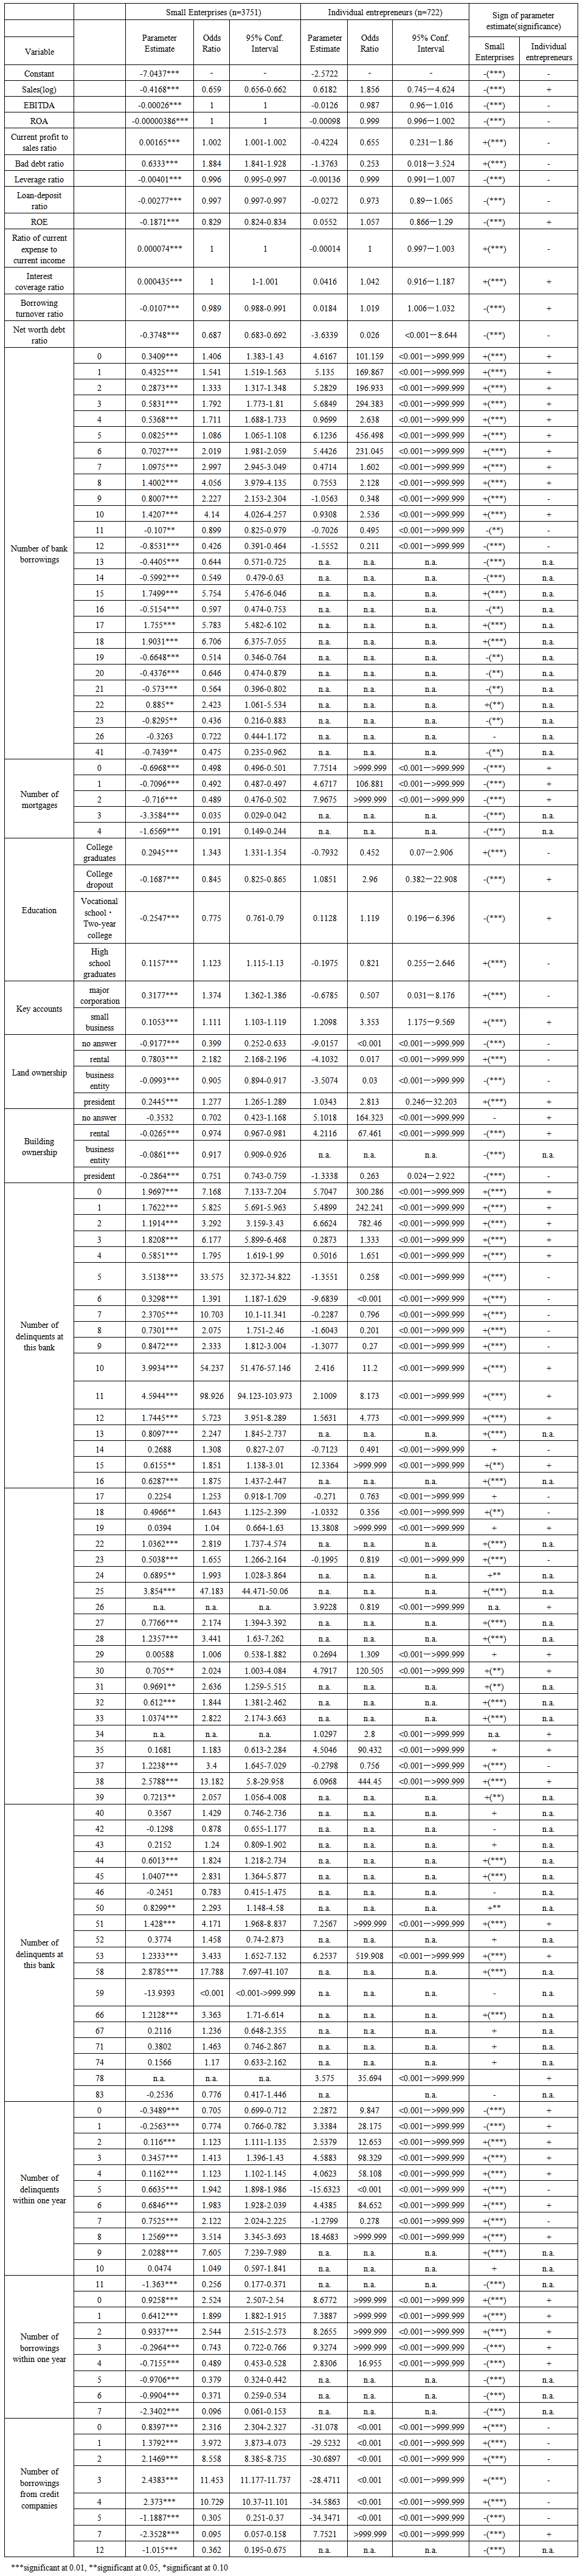 | Table 2. Results of Multinomial Logit Model (Dependent variable: default) |
4.1. Financial Information
- Among financial information for small enterprises, current profit to sales ratio, bad debt ratio, ratio of current expense to current income, and interest coverage ratio are positive and significant, while sales (log), EBITDA, ROA, leverage ratio, loan-deposit ratio, ROE, borrowing turnover ratio, net worth debt ratio are negative and significant. For individual entrepreneurs, sales and ROE, interest coverage ratio, and borrowing turnover ratio are positive, but not statistically significant.
4.2. Non-Financial Information
- As for non-financial information, bank borrowings up to 10times, 15, 17~18, 22~23times are positive and significant for small enterprises. Any numbers for mortgages are negative and significant for small enterprises, while positive for individual entrepreneurs. College graduates and high school graduates are positive and statistically significant for small enterprises, while college dropouts and vocational school graduates are positive for individual entrepreneurs. As far as key accounts are concerned, both major corporations and small businesses are positive and significant for small enterprises, while major corporations are negative, but small businesses are positive for individual entrepreneurs, though they are not statistically significant. Rental and president land ownerships are positive and significant, and land ownerships by business entities are negative and significant for small businesses. As for building ownership, all the answers are negative and significant for small businesses, while individual entrepreneurs who rent buildings are positive. Any delinquents at this bank are positive and significant. 2~9 delinquents within one year are positive and significant. Less than 2 borrowings within one year are positive and significant, however more than 3 borrowings are negative and significant for small businesses. Less than 4 borrowings from credit companies are positive and significant, while more than 5 borrowings are negative and significant for small businesses.
5. Credit Risk Model Validation
- ROC (Receiver Operating Characteristic) and CAP (Cumulative Accuracy Profile) analyses are two ways of evaluating credit risk model. Both ROC and CAP analysis provide satisfactory analyses of the accuracy of assessments of credit ratings (Irwin and Irwin 2012). The key idea underlying ROC and CAP analysis is that diagnosis involves a trade-off between default and non-default (that is, between true and false positives) and that this trade-off varies with the stringency of the threshold used to decide whether an alarm is sounded. Financial analysts have used ROC analysis to assess credit-ratings systems and indicators of financial crisis (e.g., Basel Committee on Banking Supervision, 2005; Engelmann, Hayden, and Tasche, 2003; Sobehart and Keenan, 2001; Van Gool, Verbeke, Sercu, and Baesens, 2011; IMF, 2011).See details on how to construct a ROC curve and other validation methods in BCBS Working Papers No 14(2005). A rating model’s performance is the better the steeper the ROC curve is at the left end and the closer the ROC curve’s position is to the point (0,1). Similarly, the model is the better the larger the area under the ROC curve is (BCBS 2005). The ROC curve for small enterprises is shown in figure 1, and that for individual entrepreneurs is shown in figure 2.
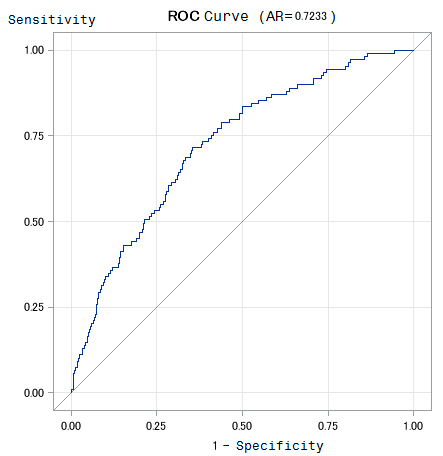 | Figure 1. ROC curve for small enterprises |
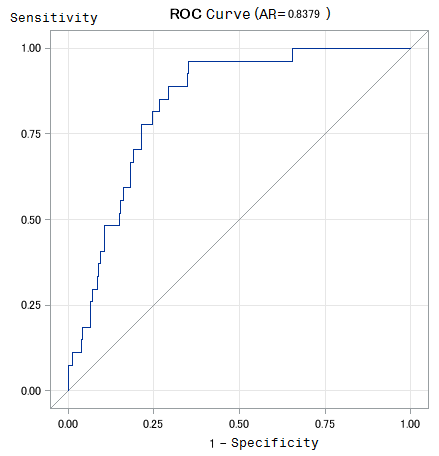 | Figure 2. ROC curve for individual entrepreneurs |
6. Conclusions
- The purpose of this study is to investigate indicators needed for credit risk measurement for the small bank, using financial information, as well as corporate information the bank collected over the years of relationships by using a multinomial logistic regression model.The analyses in this study show that not only financial information but non-financial information is the valuable source for a small bank risk assessment.