-
Paper Information
- Next Paper
- Paper Submission
-
Journal Information
- About This Journal
- Editorial Board
- Current Issue
- Archive
- Author Guidelines
- Contact Us
International Journal of Finance and Accounting
p-ISSN: 2168-4812 e-ISSN: 2168-4820
2014; 3(4): 209-226
doi:10.5923/j.ijfa.20140304.01
The Impact of Corporate Governance on Firm Performance on Stock Price among Publicly Listed Companies in the Philippines 2009 to 2011
 Abstract
 Reference
 Full-Text PDF
 Full-text HTML
Habib Mohammadpoor1, Benito L. Teehankee2
1College of Business, Graduate School, Accountancy Department, Manila, 1004, Philippines
2College of Business, Management and Organization Department, Manila, 1004, Philippines
Correspondence to: Habib Mohammadpoor, College of Business, Graduate School, Accountancy Department, Manila, 1004, Philippines.
| Email: |  |
Copyright © 2014 Scientific & Academic Publishing. All Rights Reserved.
As corporations grew into Microsoft, GMs and GEs of today, they threw of the remaining shackles of state limitations. They gained the institutional rights and became self-perpetuating entities (Millstein, 2003). Nowadays, corporate scandals and bankruptcies have extremely affected many countries particularly those that happened in Enron Corp. and Xerox Corp, smooth the way for companies to improve their corporate governance practices. This study examined the impact of corporate governance on firm performance and stock price among publicly listed companies in the Philippines during 2009 to 2011. This study used multiple regression analysis to test the hypothesis in a sample of 52 firms. The researcher utilized Full model and Stepwise Model to come up with set of independent variables that were significant to ROE, ROA and Stock Price. The variables are transformed to make it comparable and were able to meet assumptions such as Linearity, Multicollinearity, Normality and Heteroscedasticity. Firm size directly related to ROE and Stock Price while inversely related on ROA. Interaction of Firm Size and Silver directly related to ROE and Stock Price while inversely related on ROA. The Interaction of Firm Size and Gold directly related to ROA while inversely related on ROE. Interaction of Firm Size and Platinum inversely related to Stock Price. Interaction of Firm Age and Silver directly related to ROA while inversely related on ROE. The Interaction of Firm Age and Gold directly related to ROE while inversely related on ROA and Stock Price. Interaction of Firm age and Platinum and Interaction of Firm age and Platinum Plus directly related to Stock Price.
Keywords: Corporate governance, Bankruptcies, Firm performance, Stock price
Cite this paper: Habib Mohammadpoor, Benito L. Teehankee, The Impact of Corporate Governance on Firm Performance on Stock Price among Publicly Listed Companies in the Philippines 2009 to 2011, International Journal of Finance and Accounting , Vol. 3 No. 4, 2014, pp. 209-226. doi: 10.5923/j.ijfa.20140304.01.
Article Outline
1. Introduction
- Corporate governance is not entirely new to the corporate world. It has existed in some substance and form in different places before. But with the corporate scandals that have rocked the US and of late Europe, corporate governance has now become the favorite recipe in corporate circles in the Philippines and abroad. And it will become so with certain variations until every citizen’s investment is protected from unscrupulous business leaders, owners and board of directors.The US responded swiftly to address the well-publicized corporate anomalies. The US Congress passed the Sarbanes-Oxley Act (SOA) on July 15, 2002 and signed by the president into law on July 30, 2002, less than a year from the resignation of the CEO of Enron on august 14, 2001. This is the broadest package of federal disclosure and corporate governance legislation since the federal securities laws were first enacted in the 1930s. Most substantive provisions of the SOA can be traced directly to problems identified with Enron, Worldcom or other companies that collapsed one after another in 2002.According to Philippine Stock Exchange definition, corporate governance (CG) defines as the framework of rules, systems and processes that governs the performance by the board of directors and management of their respective duties and responsibilities to the stockholders, with due regard to the stakeholders. Specifically, corporate governance is a system of directing and managing a corporation which involves the development and achievement of corporate goals; the function of the board and its relationship with management; control, risk and performance management systems; compliance with laws and best practices; and corporate self-restraint and ethics, among others.The Philippines has been able to address this issue by announcing a corporate governance code on April 4, 2002 and by 2005, the Institute of Corporate Directors (ICD) has introduced the corporate governance scorecard and respective classification of companies that aims to measure compliance of entities to good corporate governance. In the year 2007, Securities and Exchange Commision (SEC) agree to partner up with ICD to encourage the companies to participate.This research primarily discusses how the top performance publicly listed companies degree of compliance with good governance is related with the way the corporation performs as indicated by its accounting performance and stock price.This study will determine, the impact of corporate governance top performance classification of publicly listed companies in the Philippines on their accounting performance which are return on asset, return on equity and stock price for 2009 to 2011. Is there any impact of corporate governance top performance classification of publicly listed companies in the Philippines on their accounting performance in terms of Return on Asset (ROA), Return On Equity (ROE), and Stock Price for the year 2009 to 2011?
1.1. Corporate Governance and Firm Performance
1.1.1. The Impact of Corporate Governance on Firm Performance
- The World Bank, in 1999, states that corporate governance comprises two mechanisms, internal and external corporate governance. Internal corporate governance, giving priority to shareholders’ interest, operates on the board of directors to monitor top management. On the other hand, external corporate governance monitors and controls managers’ behaviors by means of external regulations and force, in which many parties involved, such as suppliers, debtors (stakeholders), accountants, lawyers, providers of credit ratings and investment bank (professional institutions).
1.1.2. Board Structure
- Veliyath (1999) pinpoints that the board serves as a bridge between owners and managers; its duty is to protect shareholders’ interests. Specifically speaking, taking responsibility for managing and supervising, the board should monitor managers’ behaviors for shareholders’ interests, make important decisions, employ management team and superintend firms to obey the law.Jensen (1993) finds out that directors in a large board have diverse opinions and Consensus is difficult to reach, then the efficiency being lower, the situation could deteriorate if directors increase (Lipton and Lorsch, 1992), Yermack (1996), Eisenberg, Sundgren and Wells (1998) and Singh and Davidson (2003) unveil that board size is negatively related to corporate performance. Nevertheless, Bacon (1973) holds an opposite opinion that larger board implies members with diverse background and viewpoints, which is helpful for the quality of decisions; additionally, a wide range of their interests may neutralize decisions. Also, Zahra and Pearce (1989) and Kiel and Nicholson (2003) reveal board size is positively related to corporate performance.A board includes internal and external directors. Fama and Jensen (1983) detect that internal directors, by virtue of their positions, possess much more information, are likely to collude with managers and make decisions against shareholders. By comparison, external directors in neutral position, acting as supervisor, are good for eliminating principal-agency problem.Beasley (1996) investigates the relation between board composition and financial scandals, revealing that the ratio of independent directors in the firms with no scandals is higher than the firms, which have been caught manipulating financial reports.Bhagat and Black (2002) take the ratio of independent directors minus the ratio of inside directors as a proxy, and the result discloses that board independence, significantly and negatively, correlates with short-term performance, but board independence makes no difference in improving corporate performance.According to Agency Theory, when a chairman assume the role of CEO, namely acting as decision maker and supervisor at the same time, the function of the board to minimize agency cost could be weaken tremendously; in the end, corporate performance goes down. (Jensen and Meckling, 1976; Fama and Jensen, 1983; Patton and Baker, 1987) Empirical studies by Daliy and Dalton (1993) and Dahya, Lonie and Power (1996) unveil that CEO duality could bring about negative effects for corporate performance. Nevertheless, according to stewardship theory, executives’ responsibility may neutralize self-interest behaviors derived from CEO duality, and they are even much more devoted to advance corporate performance. Boyd (1995) agrees to that CEO duality brings in positive effects for corporate performance.
1.1.3. Ownership Structure
- Berle and Means (1932) set forth that ownership dispersion implies management is distinguished from ownership, which, as Jensen and Meckling (1976) emphasize, may contribute to agency problems between managers and shareholders or Shareholders and debtors. On the other hand, Shleifer and Vishny (1986) and Morck, Shleifer and Vishny (1988) detect the phenomenon of ownership concentration. La Porta et al. (1999) and Claessens et al. usher (2000) in the conception of ultimate controller; they define firm ownership as voting rights, unearthing that many controlling shareholders of listed firms predominate firms by means of pyramid structure and cross holding, which could result in central agency problem.Kao, Chiou and Chen (2004) reveal that firms in financial distress are closely related to high ratio of the shares pledged by directors, causing concern about the agency problem resulting from the pledge of corporation shares. Chiou, Hsiung and Kao (2002) indicate that, directors and supervisors could fund by the collateralized shares and further purchase more firm stocks to manipulate stock price or enhance their power. Directors’ and supervisors’ financial stress, because of the collateralized shares, is closely related to share price. Share price slumping, the value of the collateralized shares depreciates and even drops below the standard of the required margin; correspondingly, collateralizing shareholders will be requested to collateralize more shares, while debtors fail to afford more shares as collaterals, financial institutions as creditors will close the position of collateralized shares. As a result, collateralizing shareholders, making use of their position, may make a prey of small shareholders or embezzle company funds.
1.2. Corporate Governance Mechanisms
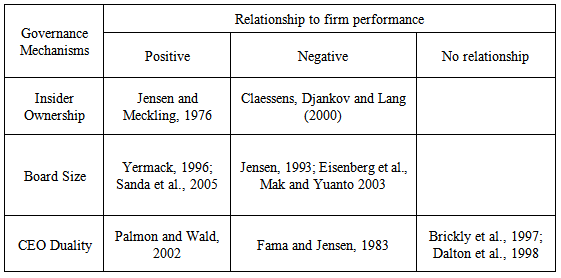
- It is well recognized in the literature that there are two types of governance mechanisms that help resolve the conflict between owners and managers and between controlling shareholders and minority shareholders. The first type is internal mechanisms (e.g., board of directors), while the second is external mechanisms (e.g., market for corporate control). In this study, due to level of importance, only internal mechanisms are assessed.Insider ownership. One of the most important ways through which a firm maximizes its value is through well-designed ownership structure of the firm’s shares. Generally, concentrated insider ownership is regarded as a bad mechanism since it gives the largest shareholders more discretionary powers of using firm resources in the areas that only serve their own benefits. But, such structure is common in Asian firms in the form of cross holding and pyramidal ownership (Claessens, Djankov and Lang, 2000). The consequence of such ownership arrangement is that the controlling shareholders are able to obtain more control at minimal capital expense. Some studies contend, however, that when the largest shareholder’s stake is large, he would align his interest with the firm’s interest leading to a positive effect (e.g., Jensen and Meckling, 1976).Board Size. The literature has not defined the optimal board size. However, a number of studies argue that large boards (more than 7 or 8) are less effective because of high coordination costs and free rider problems (e.g., Jensen, 1993). In contrast, smaller boards reduce the possibility of free riding by individual directors and thus increase their decision-making processes (Yermack, 1996). Eisenberg et al. (1998) find a negative relationship between board size and profitability when studying a sample of small and mid-sized Finnish firms. Mak and Yuanto (2003) also confirmed the above findings in firms listed in Singapore and Malaysia. But, some empirical studies have found a positive relationship between small-sized boards and corporate performance (Yermack, 1996; Sanda et al., 2005) although Bhagat and Black (2002) noted that such relationship is not robust to changes in the measurement of performance. As a result, the relationship between board size and firm performance remains an unresolved issue in the literature.CEO Duality. Duality occurs when the same person undertakes both the roles of chief executive officer and chairman or member of the board. The potential advantage of having the same person filling both posts is that they should exhibit a greater understanding and knowledge of the company’s operating environment. But, separating the roles of the CEO and chairman of the board at the time of the IPO can be considered as one way of increasing the board’s independence from management and reducing uncertainty about the intrinsic value of issuing firms (Certo et al., 2001).While it is argued that CEO duality is undesirable because it gives one person too much power within the decision-making process, there is however, little evidence to support that position. Most studies find no adverse relationship between duality and performance (e.g. Dalton et al., 1998). Moreover, Palmon and Wald (2002) find that small firms benefit more from the clearness and decisiveness of decision-making under a single leader, but large firms benefit more from the monitoring and balancing of having different people fill these two positions. Based on these findings the actual impact of duality on corporate performance is not clear. Table 1 summarizes the reviewed corporate governance mechanisms and their relationship to firm performance.
|
1.2.1. Ownership Structure of Publicly Listed Companies in the Philippines
- The dominating factor in Philippines corporate governance is the large, family-based ownership structure of companies (Saldaña, 1999). This highly concentrated ownership in relatively weak legal and external control environments (Saldaña, 1999) remains a concern because it increases the agency risks of expropriating minority shareholders. Since the passage of the Securities Regulation Code of 2000, several reforms have been undertaken. For instance, the revised PSE listing rules require that a minimum of 10 percent of outstanding shares of a company shall be allocated to local small investors and 20 percent be issued to the general public (Revised Listing Rules, Art.III, Part G, Sec. 3 and 5). The rationale for this is to have wider dispersal of IPO shares and expansion of local investors (Revised Listing Rules, Art.III, Part G, Sec. 1). But do Philippine IPO firms issue enough shares to be truly widely held?De Ocampo (2000) and Saldaña (2001) observed that companies usually issue only the minimum required number of shares in order to list. As a result, the controlling shareholders who own the larger bloc of shares dominate corporate decision-making. Minority shareholders are not in a position to influence management and a takeover by other companies is very difficult. For these reasons, the resolution of conflicts of stakeholders in Philippines companies depends very much on the effectiveness of internal control systems (Saldaña, 2001), which, in turn, rests significantly on the actions of the board of directors.
1.2.2. Board Structure of Publicly Listed Companies in the Philippines
- The Philippines Corporation Code mandates the board of directors to exercise its control over a corporation. The typical board is composed of at least five members representing the largest shareholders of the company. They are usually brought in by controlling shareholders (Saldaña, 1999). Interlocking directorates are common and extensive. According to the ADB survey (cited by Saldaña, 2001) board directors and chairpersons were elected mainly on the basis of either relationship with major shareholders or percentages of shareholdings. Board chairpersons in a substantial number of responding companies did not own significant amounts in their personal capacities. They got control through holding companies in which they have majority ownership.The average term of office of the chairperson and members of the board is one year suggesting that large shareholders want to keep their board members under close control (Saldaña, 2001). The Corporation Code prohibits the removal of any director without cause if that act would deprive minority shareholders of representation in the board. To strengthen due diligence procedures, companies may create special board committees but in the ADB survey, only about one-third of the companies have set up board committees (Saldaña, 2001).Agustin et.al. Mentioned that each mechanism, either internal or external, has its own effect towards the company’s performance. the concept of duality dictates that if there is a lack of sepration between the duties of the CEO and the Board’s Chairperson then it would lead to lower performance for the company (Agustin, 2006). The same goes with having CEO with larg shareholdings, in which, the company’s performance could be jeopardized. On the other hand, if the company has an audit committee, majority of its shareholdings are coming from the external sector, high level of leverage and high probability of having takeover, it is most likely that the company would be having better performances. Their group used the Q ratio, a measurment of how close the management and shareholder’s interests are, with respect to the running of the business to determine the relationship each mechanism toward the company’s performance (Weir, 2002).According to the study, corporate governance control mechanism are composed as follow:
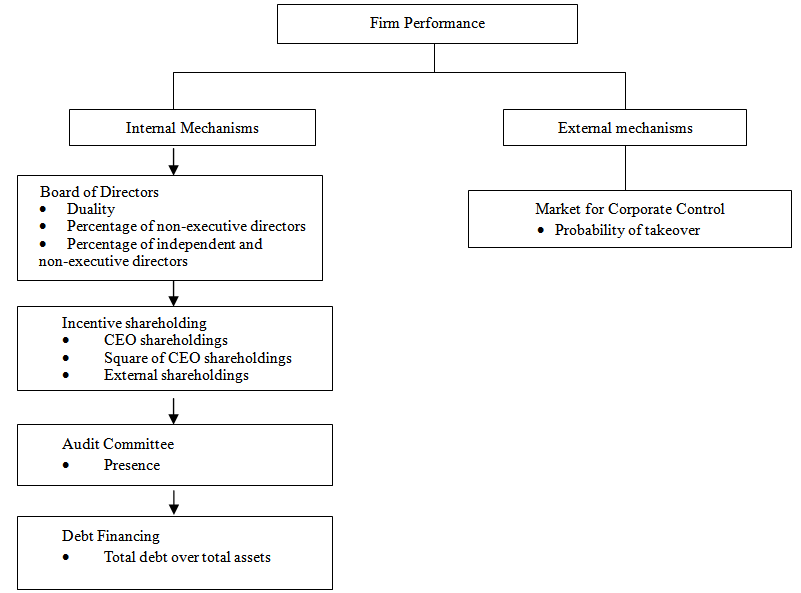 | Figure 1. Composition of Corporate Governance Mechanism (Agustin et.al, 2006) |
2. Method
2.1. Research Design
- A relational study conducted to determine the impact that exists among the level of conformance to corporate governance principles as measured by corporate governance classifications and scores on the accounting performance and stock price of companies. This trend analysis study on the corporate governance practices and performance examined over 2009, 2010 and 2011. Bulks of the data used quantitative in nature specifically for the accounting performance. However, for data drived from corporate governance classifications, though quantitative in form, are actually is based on qualitative assessment on criteria outlined in the scorecards, the level of compliance is based on a qualitative assessment of companies on compliance to Corporate Governance practices and principles.Essentially, this study conducted by having quantitative measures of quality assessment for a relational conclusion with regard to the impact that exists among the variables being studied.
2.2. Population and Respondents
- The population involved in this study is all top performance publicly listed companies that are registered in the Securities and Exchange Commision and are actively trading their stocks at Philippine Stock Exchanges in 2009, 2010 and 2011. There are a total 52 publicly listed companies that participated in the CG scorecard in 2011. However not all companies are part of the study. These were subjected to the scope and limitations discussed earlier.
2.3. Sampling Design
- Casual sampling employed to conduct the study. A set of classification or criteria adopted to determine the data and companies to be included. As what has been stated in the scope and limitation, only three years 2009 to 2011 corporate governance classifications of those companies that regularly answering and submitting the corporate governance scorecards through out the period were include in the study. This is further screen to exclude the companies that having incomplete and inconsistent data and those that have temporarily or permanently ceased operations during the three periods.This study also excluded other classification of corporation and companies that are ranged between 50% to 89.9% which are companies that are Good, Pass, Need Improvement, Need Considerable Improvement by other. Other types of entities or companies such as education, holding and financial institutions excluded as well. Considering factors and qualifications presented, 52 companies would remain as subjects of the study during 2009, 2010 and 2011. This is approximately 20% of the PLCs in the Philippines. The sample size that has choose for this study is 52 PLCs in the Philippines.
2.4. Research Procedure
2.4.1. Data Procedure
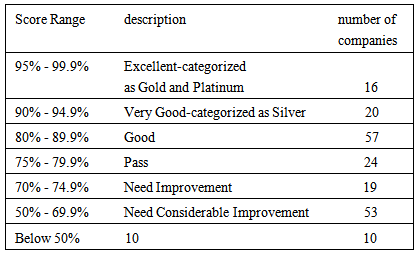
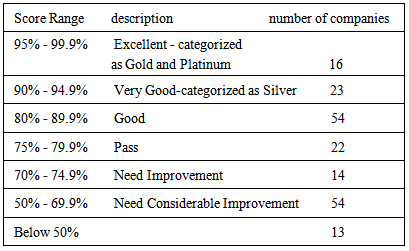
- To operationalize this study, various proxies were utilized to measure corporate governance and firms accounting performance and stock price. For corporate governance variable, the classifications according to respective score for corporate governance practice of the PLCs were provided by the institute of corporate directors (ICD). The scorecards used by ICD were based on OECD’s five criteria good corporate governance. Under each criterion are sub-criteria, each of these are combined of questions based on good corporate governance practices of OECD. Corporate governance practices then were measured, adequate, better, best and with each description have corresponding scores. The scores were aggregated according to the five criteria (sub-scores), which constitute the overall rate for the firm’s corporate governance (overall scores).All of these aforementioned processes would be done and after that ICD will classify all publicly listed companies that has a attention to employee corporate governance practices and programs. Each of these three years have its own classification that follow as bellow:In relation to 2009ICD has been pushing companies in various sectors to aim for compliance when it comes to their corporate governance practices. The ICD, therefore, recognizes the best performing companies (in alphabetical order) in the CG Scorecard for PLCs:Gold Awardees (95% and above)Aboitiz Equity Ventures, Inc.Aboitiz Power CorporationAyala CorporationAyala Land, Inc.Bank of the Philippine IslandsChina Banking CorporationEnergy Development CorporationFirst Metro Investment CorporationFirst Philippine Holdings CorporationManila Water Company Inc.Metro Pacific Investments CorporationPhilippine Long Distance Telephone CompanySM Development CorporationSM Investments CorporationSM Prime Holdings, Inc.Union Bank of the Philippines, Inc.Silver Awardees (90% - 94.99%)Aboitiz Transport System (ATSC) Corporation/ ATSCBanco De Oro Unibank, Inc.Cebu Holdings, Inc.Globe Telecom, Inc.Highlands Prime, Inc.House of Investments, Inc.Integrated Micro-Electronics, Inc.Lopez Holdings CorporationMacro Asia CorporationManila Electric CompanyManulife Financial CorporationMetropolitan Bank and Trust CompanyPetron CorporationPhilex Mining CorporationPhilippine National BankPhilippine Savings BankPhilippine Seven CorporationPhilweb CorporationPhinma CorporationRizal Commercial Banking CorporationSan Miguel Brewery, Inc.San Miguel Pure Foods Company, Inc.Security Bank CorporationIn relation to 2010There are 36 companies scoring 90% and above in the 2010 Corporate Governance Scorecards or PLCs. Among which, 16 companies belong to the Gold Category with 95% and higher ratings. On the other hand, there are 20 companies, belonging to the Silver Category with scores ranging from 90%to 94.99%. This year, ICD specially recognizes those companies that have consistently earned a Gold Category rating in the last three years. They are now classified under the Platinum Category. To remain in this category, companies must consistently earn a CG score of at least 95% in all annual surveys moving forward. Once it fails to reach threshold mark, it will have to accumulate another 3 years of Gold Category ranking before it can rejoin the Platinum Category. Followings are the top scoring companies:Platinum (in alphabetical order)Ayala CorporationAyala Land, Inc.Cebu Property Ventures & Dev’t Corp.First Philippine Holding Corp.Globe Telecom, Inc.Manila Water Company, Inc.Philippines Long Distance Telephone Co.GOLD (in alphabetical order)Aboitiz Equity Ventures, Inc.Aboitiz Power CorporationABS-CBN Broadcasting CorporationCebu Holdings, incorporatedChina Banking CorporationEnergy Development CorporationGMA NETWORK, Inc.Integrated Microelecteronics IncLopez Holding CorporationSILVER (in alphabetical order)Aboitiz Transport System Corp. (ATSC)Alaska Milk CorporationBank of Philippine Islands (BPI)Filinvest LandFirst Gen CorporationFirst Metro Investment CorporationInternational Container Terminal Service, Inc. (ICTSI)IPVG CorporationManulife Financial CorporationMetro Pacific Investments CorporationPetroenergy Resources CorporationPetron CorporationPhilex Mining CorporationPhilippine National BankSan Miguel Pure Foods Company, Inc.Semirara Mining CorporationSM Development CorporationSM Investments CorporationSM Prime Holdings, Inc.Union Bank of the Philippines, Inc.This year ICD also developed a description nomenclature corresponding to the corporate governance scores. For instance, companies scoring 95% and higher are labelled as excellent and companies with 90% to 94.9% are labelled as very good and companies with 80% to 89.9% are labelled as Good and companies with 75% to 79.9% are labelled as Pass and companies with 50% to 70% and below 50% need improvement and without any description.
|
|
2.4.2. Data Collection
- After the explaining about the sampling design, in properly conducting the study and establishing its feasibility, the following sources of data used in gathering the necessary data and information.1. Institute of corporate director - governance databank - For the corporate governance classifications of publicly listed companies2. Financial statements for 2009, 2010 and 2011of the companies under the study- For financial data that was analyzed3. Securities and Exchange Comission- For the stock price status of publicly listed companies that were studied4. Philippine Stock Exchange- For the list and stock price status of publicly listed companies that were studied5. Osiris- For a comprehensive database of financial information of publicly listed companiesIn this study, the data need for corporate governance obtained from ICD’s corporate governance and their databank. As per sec memorandum circular No 12-2009, publicly listed companies were directed to comply with the ICD policy on corporate governance, submiting their requirements for the corporate governance scorecards (survey) to be used in series of assessments by SEC or ICD to come up with firms’ score.
2.4.3. Data Analysis
- In determining the impact of corporate governance on firm performance - accounting performance and stock price with respective publicly listed companies classification in the Philippines from 2009 to 2011, the study assigned firm performance as a dependent variable as measured by various performance proxies covering accounting performance. Corporate Governance, on the other hand, designated as an independent variable as peroxide by variables on the ICD classifications.Descriptive statistics is the term given to the analysis of data that helped describe, show or summarize data in a meaningful way such that patterns might emerge from the data. However, descriptive statistics do not, allow us to make inferences or conclusions beyond what the data we have or come up with any conclusions with regards to our research hypotheses. Descriptive statistics are very important primarily because simply presenting raw data would pose difficulty to visualize what the data is showing. Descriptive statistics allows us to present the data in a more organized and meaningful ways wherein we can simplify all the data gathered (Gravetter & Wallnau, 2013). Descriptive statistics, however, are limited such that they only allow you to make summations about the people or objects that you have actually measured. In this regard, solely using descriptive statistics does not allow the data collected to create generalizations based on the sample to infer the properties of the population (Levin, Fox & Forde 2009).Inferential statistics is therefore concerned with making inferences about a population based from observations and data gathered from the sample. In other words, inferential statistics allows for the analysis of data gathered from the sample in order to arrive at a conclusion and make generalizations applied to the larger population that the sample is representing. Pearson Correlation Coefficient used to correlate the variables in the study. The main goal of Pearson Correlation Coefficient Analysis is to determine the strength of relationship among the variable and how will these models behave in terms of pairs. Degree of relationship can easily be determine through their Correlation Coefficient wherein a Correlation Coefficient of ±1.00 mean perfect correlation, ±0.75 to ±0.99 means a high degree of association, ±0.25 to ±0.74 is moderate degree while ±0.01 to ±0.24 mean low degree of association.Multivariate Statistics through Multiple Regression Analysis was utilized to determine the significant predictor of the Accounting Performance Model. The general purpose of multiple regression (the term was first used by Pearson, 1908) is to learn more about the relationship between several independent or predictor variables and a dependent or criterion variable. (http://www.statsoft.com). In order to use this treatment, testing of assumptions must be done first. These assumptions are: Linearity Assumption, Multicollineairity Assumption, Heteroscedasticity Assumption and Normality Assumption. Commonly, in order to meet these assumptions, data transformations were done. These data transformations are in the form of Logarithm and Square root suitable for large figures, Exponential and inverse for small positive figures and Squared for small or negative figures. Regression Model is commonly in the this form:
 | (1) |
3. Results
3.1. Descriptive Statistics
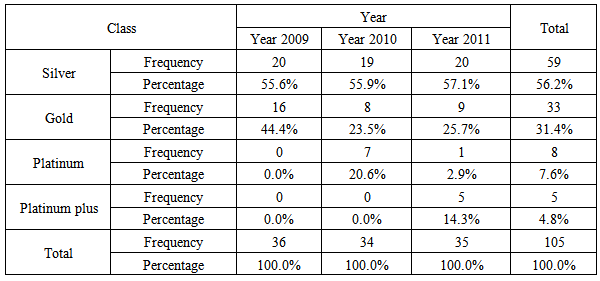
- Table 4 presented the Frequency and Percentage of the classifications of companies from year 2009 to 2011. As observed, Silver companies increases as time increased from 55.6% in 2009, 55.9% in 2010 and 57.1% in 2011. Gold companies decreased from 44.4% in 2009, 23.5% in 2010 to 25.7% in 2011. Companies classified as Platinum decreased from 20.6% in 2010 to 2.9% in 2011 while no records of Platinum Plus companies in 2009 and 2010 but 14.3% was recorded during 2011. As it shown in table 4 there is a change either decrease or increase in corporate governance classification which are platinum plus, platinum, gold and silver based on three respective years 2009 to 2011.
|
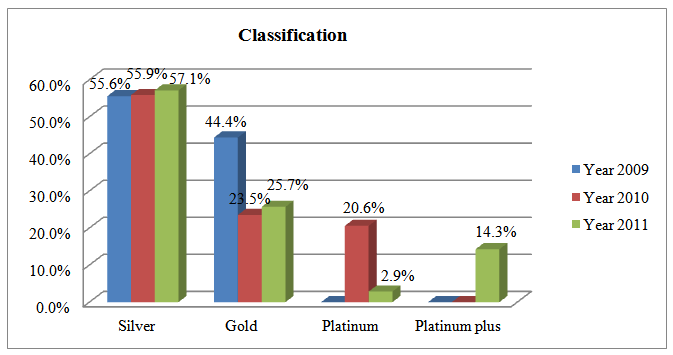 | Figure 2. Classifications of Companies from 2009 to 2011 |
|
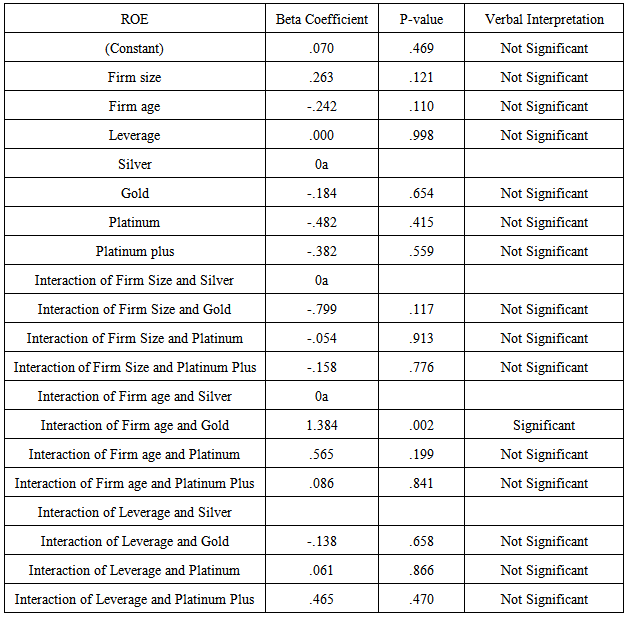
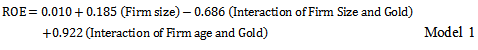
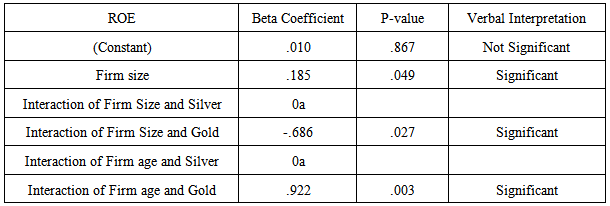
3.2. Multivariate Regression Analysis
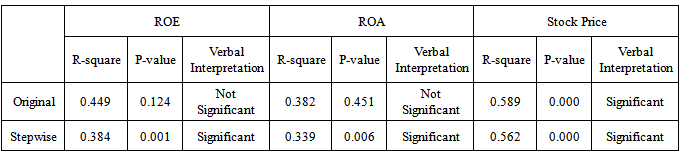
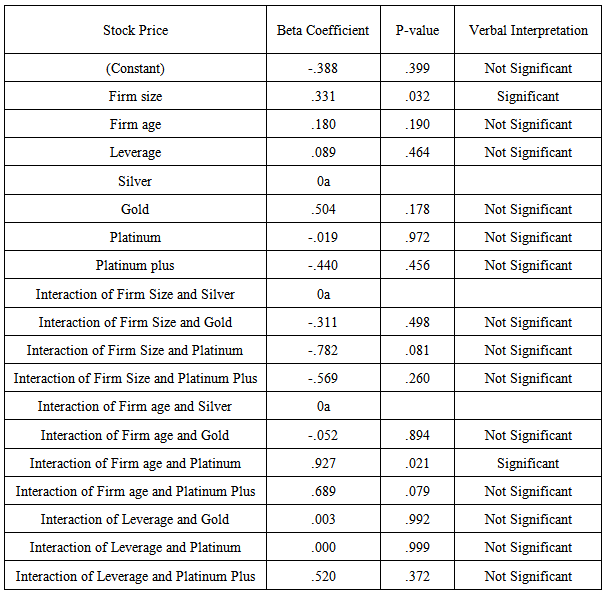
- Table 6 presented the Regression Models for ROE, ROA and Stock Price. As observed, the models are divided into two; the Original Model and the Stepwise Model. The Original Model has the complete set of independent variable which includes Firm size, Firm age, Leverage, Governance Classifications (Silver, Gold, Platinum and Platinum Plus) and its interactions while the Stepwise Model consist of reduced independent variables that were significant to the ROE, ROA and Stock Price which would be the final Model. R-square is used to determine the predicting ability of the model. A value above 0.300 or 30.0% amount of variance is said to have a good predicting ability while 0.800 or 80.0% is considered as high. Null hypothesis will be rejected at 0.05α-level of significance.
|
|
 | (2) |
|
|
 | (3) |
|
|
 | (4) |
|
3.3. Assumptions
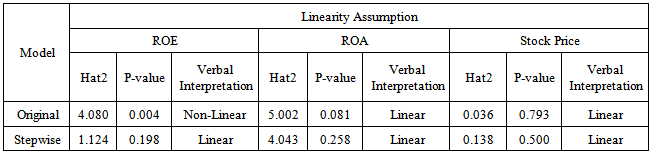
3.3.1. Linearity Assumption
- Table 13 presents the Linearity Assumption of the three models in the Analysis through “linktest” command of STATA. Here, the null hypothesis that the predicted model (Hat square is statistically equal to the real value of ROE, ROA and Stock Price. The goal of the researcher is to accept the null hypothesis that corresponds to linearity assumption. For ROE, the original Model has p-value of 0.004, which means that we reject the null hypothesis and therefore conclude that the original Model of ROE is not linear. However when stepwise analysis is considered, the p-value became 0.198, which means that we fail to reject the null hypothesis and therefore conclude that the stepwise or reduced Model of ROE is linear.
|
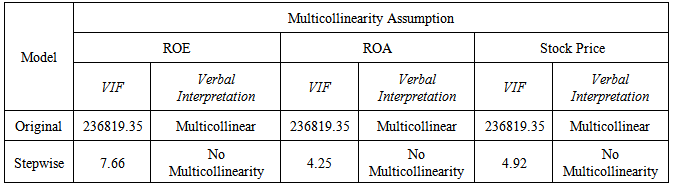
3.3.2. Multicollinearity Assumption
- Table 14 showed the Multicollinearity Test through Variance inflation factor (VIF) output for the model ROE, ROA and Stock Price Models. A VIF greater than 10 means that the data is subjected to multicollinearity. For ROE, the original Model has VIF of 236819.35, which means that the original model is subjected to Multicollinearity problem or over-correlation. However, when the stepwise process is done, the VIF became 7.660, which means that there is no presence of multicollinearity in the model. For ROA, the original Model has VIF of 236819.35, which means that the original model of ROA is subjected to Multicollinearity problem. However, when the stepwise process is done, the VIF became 4.25, which means that there is no presence of multicollinearity in the model on ROA.
|
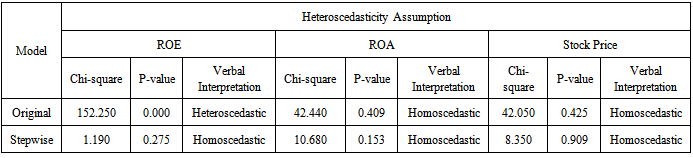
3.3.3. Heteroscedasticity Assumption
- Table 15 showed the Heteroscedasticity on ROE, ROA and Stock Price Models. Here, we tested the null hypothesis that there was no Heteroscedasticity in the data. The motive is to accept the null hypothesis. For ROE, the original Model has p-value of 0.000, which means that we reject the null hypothesis and therefore concluded that the original Model of ROE is Heteroscedastic or unequal variances. However when stepwise analysis is considered, the p-value became 0.275, which means that we fail to reject the null hypothesis and therefore concluded that the stepwise or reduced Model of ROE is Homoscedastic.
|
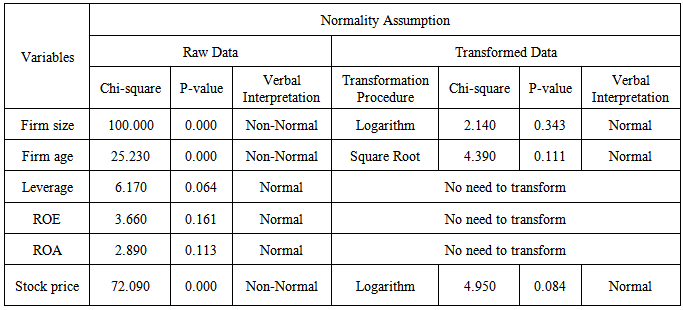
3.3.4. Normality Assumption
- Table 16 showed the Normality test of each variable. Unlike other assumption of regression, Normality test was done on each variable to determine which transformation procedure to be done onto it. Here, the null hypothesis that there is normality in the data is tested and the goal of the researcher is to accept the null hypothesis that variances are equal to 0, which corresponded to normality assumption. Using the raw data, Firm size, Firm age and Stock price are non-normal with p-value below 0.05 however, when the data is transformed; Logarithm on Firm size and Stock price and Square Root on Firm age, p-value became 0.343 (Firm Size), 0.111 (Firm Age) and 0.084 (Stock price) which mean that these variables were normal. On the other hand, Stock Price, ROE and ROA using its raw values are normally distributed with p-value above 0.05.
|
4. Discussion
- In this study the researcher employed a relational approach using a cross sectional data of 52 companies across industries for the year 2009 to 2011 to estimate the impact of corporate governance classification on firm performance and stock price for the said period. With this end at hand, the researcher constructed regression models of firm performance using two proxies for performance (ROE and ROA) and Stock price to stimate the impact of governance classifications (Platinum plus, Platinum, Gold and Silver) to firm performance-accounting performance and stock price. Other variables such as firm size, firm age and firm leverage were also indentified and held as moderating variable in construction of the original model to take into consideration the effects of these variables to firm performance and stock price.
|
5. Conclusions
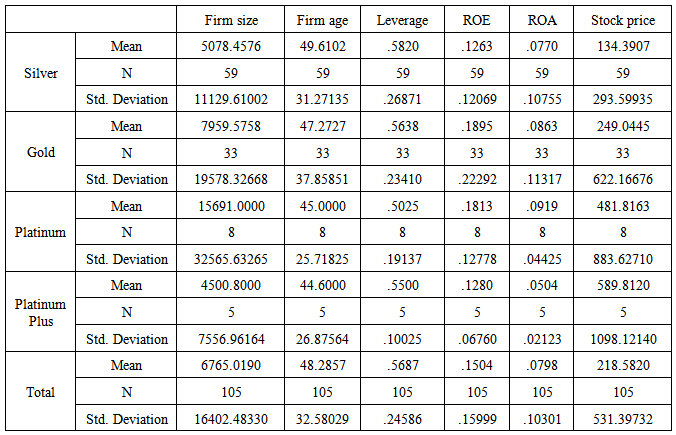
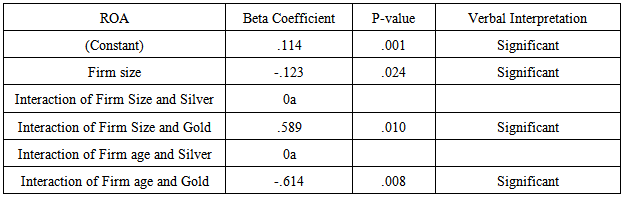
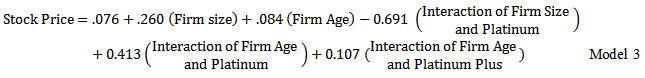
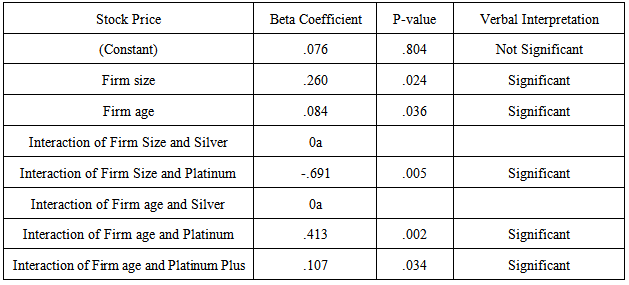
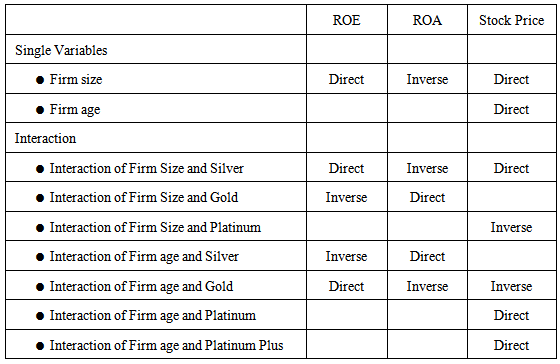
- Silver companies had an increasing behavior across years. While Gold companies decreased across years same as to the companies classified as Platinum while no records for Platinum Plus companies. The average Firm size is 6765.0190; the average Firm Age is 48.2857 while mean Leverage is .5687. The mean ROE is .1504, mean ROA is .0798 and the mean Stock price is 218.5820.Across Classification, there is an increasing number of firm size, mean ROE, ROA and Stock Price while a decreasing behavior across classification was observed on variables; Firm age and leverage. Most of the companies were under Silver with 59 or 56.2%, Gold with 33 or 31.4%, Platinum with 8 or 7.6% and Platinum plus with 5 or 4.8%.According to observed results on hand, corporate governance classifications of top performance publicly listed companies in the Philippines (Platinum plus, Platinum, Gold and Silver) did not have any significan impact on firm performance (ROE, ROE) and Stock price, Firm size directly related to ROE and Stock Price while inversely related on ROA. Interaction of Firm Size and Silver, being the point of comparison of Interaction of Firm Size and government classification directly related to ROE and Stock Price while inversely related on ROA. The Interaction of Firm Size and Gold directly related to ROA while inversely related on ROE. Interaction of Firm Size and Platinum inversely related to Stock Price. Interaction of Firm Age and Silver, being the point of comparison of Interaction of Firm Age and governance classification directly related to ROA while inversely related on ROE. The Interaction of Firm Age and Gold directly related to ROE while inversely related on ROA and Stock Price. Interaction of Firm age and Platinum and Interaction of Firm age and Platinum Plus directly related to Stock Price. Cells in black are the once omitted during the stepwise process.
ACKNOWLEDGEMENTS
- First and foremost, I would like thank GOD for being my best that provided me with the strength and the will to continue, and the light that gave me the wisdom and enlightenment to keep me on track. I would like to appreciate chair of Management and Organization department in college of business Dr. Benito. Lteehankee as my supervisor due to all his precious advices that he has given me so far. I also would like to thank Accountancy Department and its Faculty members such as Ms. Herminigilda E. Salendrez, Dr. Rodiel C. Ferrer and Dr. uy. And lastly, my family that helped me a lot in this way.