Nsama Musawa
School of Business Studies, Mulungushi University, Kabwe, 10101, Zambia
Correspondence to: Nsama Musawa, School of Business Studies, Mulungushi University, Kabwe, 10101, Zambia.
| Email: |  |
Copyright © 2014 Scientific & Academic Publishing. All Rights Reserved.
Abstract
This paper estimated the short and long run impact of the change in exchange rate on the trade balance. The hypothesis for the research was that there is no evidence of the long run and short run relationship between Real Exchange Rates and the Trade Balance in Zambia. Using Cointergration analysis and the Vector Error Correction model on Zambia’s trade balance and the exchange rates for the period 2000-2010, the empirical results suggest that exchange rates in Zambia have no impact on the trade balance in the short run but they have an impact in the long run.
Keywords:
Real Exchange Rate, Trade Balance, J-Curve Hypothesis
Cite this paper: Nsama Musawa, Relationship between Zambias Exchange Rates and the Trade Balance – J Curve Hypothesis, International Journal of Finance and Accounting , Vol. 3 No. 3, 2014, pp. 192-196. doi: 10.5923/j.ijfa.20140303.06.
1. Introduction
Fluctuating exchange rates in Zambia have a significant effect on the economy. This is reflected in the balance of payment account. Zambia has been recording a deficit trade balance from 2000 to 2005 and 2008[1] as can be seen from figure 1 below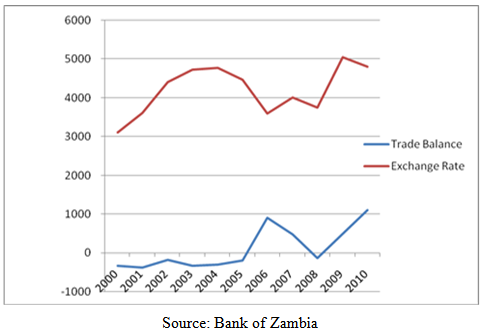 | Figure 1. Zambia’s Nominal Exchange rate and the Balance of trade over the period 2000-2010 |
The deficits are mainly offset by government borrowing both internally and externally. External borrowing subjects the country to strict conditions that Lenders attach to the loans [6]. While internal borrowing pulls out private borrowing and investing by forcing up interest rates and slowing down business. This has hindered the economic development of Zambia.There is therefore need to investigate ways of improving the trade balance. According to Stucka (2004), there are two approaches to improving the trade balance .First is the internal approach which relies on the supply side policies such as influencing labor productivity by reducing taxes or relaxing rigid labor market conditions, this improves gross domestic product which in turn improves exports. Second is the external approach consisting of devaluing or depreciating the currency. This changes the relative price of imports and exports. According to the J-Curve hypothesis, depreciation of a currency can have a negative impact on the trade balance in the short run while having a positive effect in the long run [4]. A real exchange rate is the actual spot rate adjusted for relative price level changes since the base period [7]. The trade balance is derived from the balance of payment which is the statistical record of a country’s transaction with the rest of the world [9].This paper focused on estimating the short and long run impact of exchange rate on the trade balance so as to ascertain if the external approach of improving the trade balance can work for Zambia. The main aim of this paper was to determine the relationship that exists between the real exchange rates and the trade balance in Zambia. Specifically the paper sort to:1. Investigate if there is any evidence of the J-curve effect for Zambia between exchange rates and the trade balance2. Investigate if there is a long run relationship between the trade balance and the exchange rate3. Investigate to what extent the fluctuation in exchange rates affect the trade balance in Zambia4. Investigate if the depreciation of the Zambian Kwacha is good for Zambia.
1.1. Significance of the Study
The study is significant because it will guide the Bank of Zambia in its formulation of monetary and supervisory policies. Quantifying both the short and long run relationship of the trade balance and exchange rates in important because if such a stable long run does not exit the depreciating the exchange rate does not seem to be a reasonable way of improving Zambia’s competiveness on the long run basis. If the long run relationship does exist it is necessary to establish whether depreciation is likely to lead to the net improvement in the long run.
2. Literature Review
The short and long -run relationships between the trade balance and exchange rates have been subject to many empirical studies. The short run effect and the J-curve phenomenon was first advanced by Magee (1973), after the fact that short-run and long –run improvements after currency depreciation resembles the letter “J”. In their paper Rose and Yallen (1989) used quarterly data for the period 1960 and 1985 at the bilateral level between United States and six largest trade partners. They did not find J-curve pattern or long-run relationship. Singh (2004) analyzed Indian trade balance by using the real exchange rate, the real domestic income and the real foreign income. He found that, depreciation leads to an improvement in the long run. However, the exchange rate was found to be insignificant in the short run and the trade balance was not found to follow a J-path. Baharumshah (2001), employed an unrestricted Vector Autoregresion (VAR) model for the bilateral trade balances of Thailand and Malaysia with the United States and Japan for the period 1980 to 1996. He found support for a stable and positive long-run relationship between trade balance and the exchange rate. The evidence on the short-run response of the trade balance supporting the J-curve effect was mixed. A delayed J-curve seemed to apply to Thai data, whilst no support for the J-curve was found in Malaysian data.Upadhyaya and Dhakal (1997), tested the effectiveness of devaluation on the trade balance for eight developing countries (Colombia, Cyprus, Greece, Guatemala, Mexico, Morocco, Singapore, and Thailand). Their findings were contradictory to Baharumshah's findings regarding Thailand. They provided evidence that seemed to suggest that only, in the Mexican case that devaluation improved the trade balance in the long-run.Razafimahefa and Hamori (2005), examined import and export demand function for Madagascar and Mauritius, and found existence of the cointegration between imports, exports and exchange rate for both countries. The long-run income elasticities were 0.86 and 0.67 and price elasticities -0.49 and -0.64 for Madagascar and Mauritius, respectively. After estimating export demand functions, they concluded that Marshall-Lerner condition is fulfilled only in Mauritius.
3. Research Methodology
To estimate the long run relationship between the trade balance and the real effective exchange rate, the following equation was estimated: | (1) |
Where TB is Trade Balance, GDP is Gross Domestic Product, REER is real effective rate, β is the coefficient of REER, α is the slop ,ɛ is the error term.In order to free the models from the scale effects and interpret the coefficients as elasticities. Some variables like GDP are expressed as logarithms. GDP has been included so as to control the effect of domestic income.If the depreciation improves the trade balance in the long run, β should be positive.The following short run equation that corresponds to the long run equation (1) above .was used to estimate the Error Correction Model (ECM) in order to capture the short run dynamic of REER on Zambia’s trade balance. | (2) |
Where D stands for seasonal dummies to capture the effect of seasonalities in Zambia’s trade balance, ECM is the Error Correction Mechanism Y is the coefficient for REER, β is the coefficient of TB.Quarterly time series data spanning the periods third quarter 2000 to fourth quarter of 2010 was used. The trade balance data was interpolated from annual data using Eviews 7.0, an econometric package, under the assumption of quadratic match average. The ratio of imports and exports was then found by dividing imports by exports. The annual real GDP data was equally decomposed into a quarterly series using the same procedure with Eviews 7.0. Graphical analysis was used to detect the trends while Econometric models were applied to establish the short and long run relationship. Before undertaking any estimation, a unit root test for all the variables of interest was undertaken in order to understand the order of integration of the variables into the long run equation. The cointegration test was used to estimate the long run relationship while the Error Correlation Model (ECM) was used to estimate the short run relation of the trade balance and the real effective exchange rates.
4. Results
Graphical analysis of the data on trade balance and the real effective exchange rates gave the results in figure 2 below. As can be observed from the graph the real effective exchange rate was in the range K2, 500 to K1, 500 from 2000 to 2005 and in the range of K1,400 to K1,100 from 2006 to 2010. In 2006 there was a sudden appreciation of the Kwacha against major currencies like the Us dolla. The trade balance was in deficit from 2000 to 2005 and in 2007 and 2008 while a surplus was recorded in 2006, 2009 and 2010.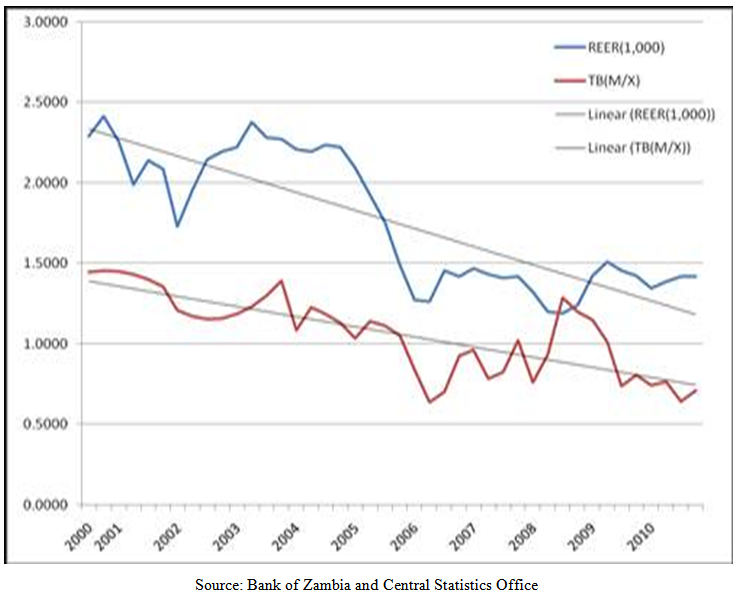 | Figure 2. Graphs showing the trade balance (TB) and Real Effective Exchange Rates (REER) |
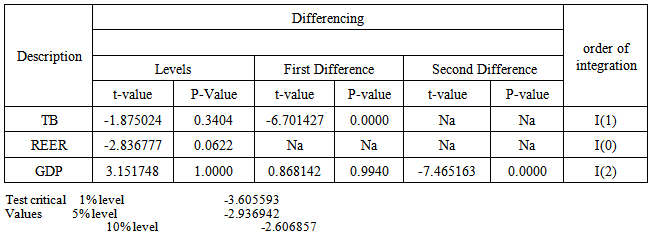
The results for the unit root test using the Augmented Dickey –Fuller (ADF) tests are presented in in table 1 below.Table 1. Summary of ADF Unit Root Test Results
 |
| |
|
The results above show that trade balance has a unit root because the ADF statistic (tα)-1.875024 is greater than the critical value at 1% level of significance of -3.605593 which is not stationary but after the first differencing it becomes stationery ((tα)-6.701427 is less than the critical value at 1% level of -3.605593) and thus integrated of the order one. The second differencing does Not Apply and indicated by the terminology Na in the table.The Real Effective Exchange Rate (REER) is non–stationary at 1% and 5% level of significance as (tα)-2.836777 is greater than the critical values -3.605593 and -2.936942 at 1% and 5% respectively but is stationary at 10% level of significance as (tα)-2.836777 is less than the critical value at 10% level of significance as (tα)- 2.836777 is less than the critical value at 10% level of significance of -2.606857.Therefore it was integrated of the order zero.The unit root for Gross Domestic Product (GDP) showed the series of integration of the order two I(2) as the (tα) 3.151748 is greater than the critical value at all levels (-3.605593 at 1%, -2.936942 at 5% level and -2.606857 at 10% level after the first differencing it was still non-stationary but after the second differencing ,it became stationary as (tα)-7.465163 is less than the critical value at 1% level of significance of -3.605593, thus integrated of the order two I (2).
4.1. Long Run Estimation Based on Cointegration
Since the variables were discovered to have unit roots a cointegration test was performed in order to test whether the group of non-stationary series is cointegrated or not. The presence of a cointegration relation forms a basis for the Vector Error Correction specification. To get the long run equation, Vector Auto Regression (VAR) estimation was undertaken in order to come up with an appropriate lag length for the purposes of establishing cointegration among the variables of interest in the Vector Error Correction Model (VECM). Equation (1) above involving Trade Balance, Real Effective Exchange Rates and a log of real Gross Domestic Product was found to have no cointegration. Consequently, a Vector Auto Regression (VAR) involving Trade Balance and Real Effective Exchange Rate was estimated and used to get an appropriate lag length for the purpose of establishing cointegration in the resulting Vector Error Correction Model (VECM). Based on the Vector Auto Regression (VAR) involving two variables, the Trade Balance and the Real Effective Exchange Rate, a lag length of two was selected as an appropriate equation based on the Akaike Information Criterion (AIC) and the Hannan –Quinn Information Criterion (HQ). Using the equation based on the AIC and the HQ , a Johansson cointegration test based on unrestricted cointegration rank trace was carried out and found one cointegrating equation based on the assumption of intercept and no trend in the cointegrating vector as shown by table 2 below.| Table 2. Unrestricted Cointegrtion Rank Test Analysis results |
| | Hypothesized No. of CE(s) | Eigenvalues | Trace Statistic | 0.5 critical Value | Prob | | None | 0.379613 | 22.26808 | 15.49471 | 0.0041 | | At most 1 | 0.076228 | 3.171578 | 3.841466 | 0.0749 |
|
|
The following was the hypothesis to be testedHo: There is no long run relationship between Real Exchange Rates and the Trade Balance in ZambiaHa: There is a long run relationship between the Real Exchange Rates and the Trade Balance in ZambiaRejection criteria; accept the null hypothesis when trace statistic is less than the test critical value.The trace test reported in table 2 shows that the null hypothesis of no cointegration is rejected, since the trace statistic is larger than 5% critical value (22.268>15.4947). However the null hypothesis cannot be rejected as 3.171<3.8416.The same result of only one cointegrating relation between Trade Balance and Real Effective Exchange Rate was obtained by employing the maximum eigenvalue test. The results are reported in table 3 below.| Table 3. Unrestricted Cointegration Rank Maximum Eigevalue Test Analysis Results |
| | Hypothesized No. of CE(s) | Eigenvalue | Max Eigenvalue statistic | 0.5 Critical Value | Prop | | None | 0.37613 | 19.09650 | 15.49471 | 0.0041 | | At most 1 | 0.076228 | 3.171578 | 3.841466 | 0.0749 |
|
|
The maximum eigenvalue test reported in table 3 above shows that the null hypothesis of no cointegration is rejected since the max eigenvalue statistic is larger than 5% critical value (19.09650> 15.4947), however the null stating that there is at most one cointegrating vector cannot be rejected as 3.171<3.84166.Since the variables do cointegrate, the estimated long run cointegrating equation using Vector Error Correction is presented as equation (3) below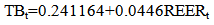 | (3) |
The estimated coefficient for REER is positive and statistically significant indicting that a 1% change in REER will cause the trade balance to change by 0.0446%.
4.2. Short Run Dynamic Estimation
Using the long run Vector Correction model equation, a short run dynamic equation (2) was estimated with the results presented in table 4 below.| Table 4. ECM Short Run Dynamic Results |
| | Variable | Coefficient | Std.Error | t-statistic | Prob. | | TB=0.24+0.446+E | 0.173974 | 0.127342 | 1.366194 | 0.1820 | | ECM | -0.264397 | 0.130076 | -2.032630 | 0.0510 | | D(TB(-1)) | 0.166461 | 0.175720 | 0.947308 | 0.3511 | | D(LOG(REER)) | 0.202317 | 0.132997 | 1.521218 | 0.1387 | | D(LOG(GDP(-4))) | -0.817233 | 1.67620 | -1642819 | 0.1109 | | @SEAS(1) | 0.145775 | 0.056059 | -2.600390 | 0.01230 | | @TRED | 0.005235 | 0.003298 | 1.587179 | 0.1230 |
|
|
Where, ECM is the error correction mechanism, @seas (1) represent a dummy variable for seasonality of first quarter and @Trend is a trend variable to estimate the trend movements in the exchange rates and the trade balance .The rest of the variables are as defined before The results show that the ECM and the seasonality are the only variables found to be statistically significant. The REER has a positive coefficient but not statistically significant which implies that the immediate impact of currency depreciation on trade balance in Zambia is negligible. Hence no J Curve Effect.The results of this paper are similar to the studies obtained in other countries for example Singh (2004) analyzed Indian trade balance by using the real exchange rate, the real domestic income and the real foreign income. He found that, depreciation leads to an improvement in the long run. However, the exchange rate was found to be insignificant in the short run and the trade balance was not found to follow a J-path. Baharumshah (2001), employed an unrestricted Vector Autoregresion (VAR) model for the bilateral trade balances of Thailand and Malaysia with the United States and Japan for the period 1980 to 1996. He found support for a stable and positive long-run relationship between trade balance and the exchange rate. The evidence on the short-run response of the trade balance supporting the J-curve effect was mixed. A delayed J-curve seemed to apply to Thai data, whilst no support for the J-curve was found in Malaysian data.
5. Conclusions
The J-Curve hypothesis does not hold for Zambia’s trade balance and the exchange rate but there is a positive long run relationship. Hence depreciating the currency does seem to be a reasonable way to improve Zambia’s Trade balance and economic competitiveness in the long run.
References
| [1] | Bank of Zambia Annual Reports: 2001-2010. |
| [2] | Baharumshah, A.Z (2001): “The Effect of Exchange Rates on Bilateral Trade Balance: New Evidence from Malaysia and Thailand”, Asian Economic Journal, Vol.15, No.3, pp291-311. |
| [3] | Gligoric, M. and Petrovic, P. (2010): “Exchange Rate and Trade Balance: J-Curve Effect” Faculty of Economics, University of Belgrade, Serbia Panoeconomicus, 2010, 1, pp.23-41. |
| [4] | Kulkarni, K. (2007): The Bilateral J-Curve of Turkey for Consumption, Capital and Intermediate Goods”, Department of Economics, Middle East Technical University. Working paper. |
| [5] | Magee, S.P. (1973) “Currency Contracts, Pass through, and Devaluation.” Brookings papers of Economic Activity, 1:303-325. |
| [6] | Mudenda, D (2007) “Zambia’s Trade Situation: Implication for debt and poverty reduction”. Debt and Trade Project Jesuit Center for Theoretical Reflection Lusaka Zambia. |
| [7] | Mungule, K.O (2004): The determinants of the real exchange rate in Zambia”. Department of Economics. The University of Zambia .African Economics Research Paper 146. |
| [8] | Razafimahefa, I. F., and Hamori, S. (2005): “Import Demand Function: Some Evidence from Madagascar and Mauritius”, Journal of African Economies, 14(3): 411- 434. |
| [9] | Resnik, G.B and Eun, C.S. (2007) “International Financial Management” McGraw-Hill Irwin, New York. |
| [10] | Rose, A. K. and Yellen, J.L (1989): “Is there a J-Curve?” Journal of Monetary Economics, 24: 53-58. |
| [11] | Singh, T. (2004): “Testing J-curve Hypothesis and Analysing the Effect of Exchange Rate Volatility on the Balance of Trade in India”, Empirical Economics, 29, 227-245. |
| [12] | Stucka, T. (2004): “The Effects of Exchange rate Changes to Trade Balance in Croatia”, Croatian National Bank Working Paper Series, No. W-65, April, 2004. |
| [13] | Upadhyaya, K.P. and Dhakal, D. (1997): “Devaluation and the Trade Balance: Estimating the Long Run Effect”, Applied Economics Letters, Vol. 4, pp. 343 – 345. |
 Abstract
 Reference
 Full-Text PDF
 Full-text HTML