-
Paper Information
- Previous Paper
- Paper Submission
-
Journal Information
- About This Journal
- Editorial Board
- Current Issue
- Archive
- Author Guidelines
- Contact Us
International Journal of Finance and Accounting
p-ISSN: 2168-4812 e-ISSN: 2168-4820
2014; 3(2): 122-131
doi:10.5923/j.ijfa.20140302.09
Behaviour of Financial Ratios in Firm Failure Process: An International Comparison
 Abstract
 Reference
 Full-Text PDF
 Full-text HTML
Erkki K. Laitinen1, Oliver Lukason2, Arto Suvas1
1Department of Accounting and Business Finance, University of Vaasa, Vaasa, 65101, Finland
2Faculty of Economics and Business Administration, University of Tartu, Tartu, 51009, Estonia
Correspondence to: Oliver Lukason, Faculty of Economics and Business Administration, University of Tartu, Tartu, 51009, Estonia.
| Email: |  |
Copyright © 2014 Scientific & Academic Publishing. All Rights Reserved.
This paper considers a novel topic of comparing how firm failure differs through countries. Based on the behaviour of financial ratios, namely their changes through five years from six countries (United States, United Kingdom, Belgium, Croatia, Czech Republic, Estonia), it was found that median firms from these countries can follow very similar failure processes. Comparison with Laitinen’s (1991) taxonomy of failure processes revealed that in more developed countries there is a behavioural tendency towards the chronic failing firm type, but in less developed former socialist countries, the opposite tendency towards the acute failing firm type occurs.
Keywords: Firm failure process, Financial ratios, European and US firms
Cite this paper: Erkki K. Laitinen, Oliver Lukason, Arto Suvas, Behaviour of Financial Ratios in Firm Failure Process: An International Comparison, International Journal of Finance and Accounting , Vol. 3 No. 2, 2014, pp. 122-131. doi: 10.5923/j.ijfa.20140302.09.
Article Outline
1. Introduction
- Through decades, numerous studies have been conducted about firm failure, most of them concentrating on one narrow domain: prediction of corporate collapse. Thus, literature reviews by Bellovary et al. [1], Dimitras et al. [2], Altman and Narayanan [3] list hundreds of different bankruptcy prediction models created in the past. Prediction models, by comparing viable (or even successful) and failed (mostly permanently insolvent) firms, offer detailed understanding how to distinguish between the two types of companies. Still, such studies mostly do not clarify whether firms in different countries collapse in the same way and derived from that, whether prediction models could be widely applicable. Only a few authors have specifically studied the failure processes of collapsed firms, but none of them have offered inter-country comparison. The seminal work by Argenti [4] has been followed by a few studies being either merely theoretical (e.g. [5]), or offering some empirical proof (e.g. [6], [7], [8]). One of the most well-known taxonomies based on only financial variables has been developed by Laitinen [7] and three different failure processes were found in this study. Still, literature lacks of similar studies based on the example of firms from different countries.Derived from the above, this paper aims to study, based on the behaviour of financial ratios before failure, whether and which similarities or differences exist in the failure process of firms from different countries. To achieve the objective, two different facets will be considered. Firstly, the individual behaviour of financial ratios in failure process should be compared through different countries. Secondly, as previous studies (e.g. [4], [7]) have proven the presence of a small number of distinct firm failure processes, data from different countries can be compared with a benchmark taxonomy to find out which types of previously established processes are most common in different environments. In order to make the study more elaborate, countries with relatively different background should be included in analysis: for instance examples of former Eastern and Western block countries.The paper is structured as follows. The introductory part will be followed by a literature review, based on which the research hypotheses will be stated. Then, statistical methods and data for the empirical study will be outlined, followed by the results of empirical analysis. Derived from the duality of the objective, empirical results will be presented in two different domains. Firstly, inter-country comparison of the pre-failure values and changes in different financial ratios will be conducted, which is followed by classifying each country by using a benchmark taxonomy and comparing the results. The paper ends with concluding remarks.This research has two main contributions to the literature. Firstly, it serves as a seminal work of comparing the behaviour of financial ratios in the firm failure process through different countries. Secondly, it shows which failure processes are dominant through different countries by applying a well-known taxonomy. In summary, the paper offers novel insight into the similarities and differences of how firms fail in different environments.
2. A Short Review of the Literature
- A failure process in its nature is composed of causes and symptoms [4]. Causes are failure triggers from inside the firm or external environment [9]; symptoms in turn are characteristics that result from the causes and are often revealed to outside parties [10]. Sometimes it is difficult to differentiate causes and symptoms [11], for instance unprofitable principal activities of a firm can symbolize both a cause and a symptom of failure. In the failure process, causes and symptoms are dynamically linked and there is normally more than one contributor to a firm’s collapse [8]. As bankruptcy prediction studies have demonstrated, the most easily observable failure symptoms for a third party are financial variables from annual statements. Other indicators like the firm’s market share and growth potential are often difficult to measure reliably and also their interpretation in the context of failure can be problematic.Different failure studies have applied various financial variables to study decline. Most of them apply financial ratios (see e.g. [2]), as financial statement accounts only can be quite uninformative in the context of firm failure. Profitability, cash flow, liquidity, leverage and efficiency ratios are the most classical ones that have been used in failure prediction studies [2]. Also, changes of financial ratios have been applied [12], as they offer valuable information about the failure dynamics that ratios as static figures do not possess. Still, literature is dominated by the usage of static figures, although their values at different moments of time are being considered, which indirectly incorporates the dynamics in analysis. Changes in financial statement figures could also be applied, but their usage possibilities are again limited. For instance a drop in a firm’s sales cannot be considered a negative tendency unless it is known that this leads to a decrease in profitability.Various taxonomies of failure processes have been created, of which most more or less follow the one established in Argenti’s [4] seminal study. Argenti identified three failure trajectories: 1) a newly founded firm that through its whole life-cycle is poorly functioning, 2) a young firm that has rapid growth, but at a certain point of time plummets very quickly due to wrong business decisions, 3) an old firm that declines gradually. The logic in Argenti’s work has been elaborated in follow up studies by Richardson et al. [13], Ooghe & de Prijcker [8] and Crutzen & van Caillie [14]. These studies list 4-5 failing firm types, largely relying on predefined characteristics (including age and failure reasons). Different failing firm types are characterized by varying development of financial ratio values in the pre-failure phase, as vividly outlined by D’Aveni [6] and Laitinen [7].Laitinen’s study [7] focusing on (old) Finnish firms established three different failure processes based on the factor analysis application on six different financial variables (five ratios and one financial indicator change variable). The three processes were: 1) chronic failure firm (all ratios had very low values for a long time), 2) revenue financing failure firm (some ratios on an average level for a lengthy time and some showed gradual decline), and 3) acute failure firm (all ratios plummeted shortly before failure), whereas for each process the quartile values for ratios were outlined for up to six years before failure ([7]: 662-667). The study also showed that with the decrease in size, acute failure becomes more common, while with the increase in size, the probability of chronic failure grows ([7]: 666). The lengthy failure process of large firms has been also supported in other studies (see e.g. [15]). Still, available studies about firm failure processes do not offer inter-country comparisons to shed light whether financial ratios in the failure process develop in the same way in different environments and whether the development of financial ratios points to the prevalence of different failure processes.As studies focusing on firm failure processes do not offer inter-country comparisons, it is necessary to address failure prediction studies outlining such evidence. Studies by Altman and Narayanan [3], Ooghe and Balcaen [16], and Bellovary et al. [1] show that in different environments failure predictors can be very different, which in turn could point to the possibility that similar firms in different environments go through varying failure processes. The inter-country differences can in turn be caused by a multitude of factors, among them economical, legal and social, but it is difficult to establish specific causal relationships due to a large number of different variables affecting the failure process.When setting the hypotheses, we mostly rely on the fact that there are no inter-country comparisons about failure processes available. For conducting the empirical study, we propose the following:Hypothesis 1: In different countries, financial ratios perform differently in firm failure process, both in dynamic and static sense.Hypothesis 2: In different countries, different failing firm types from Laitinen’s (1991) taxonomy are prevalent.
3. Data and Methodology
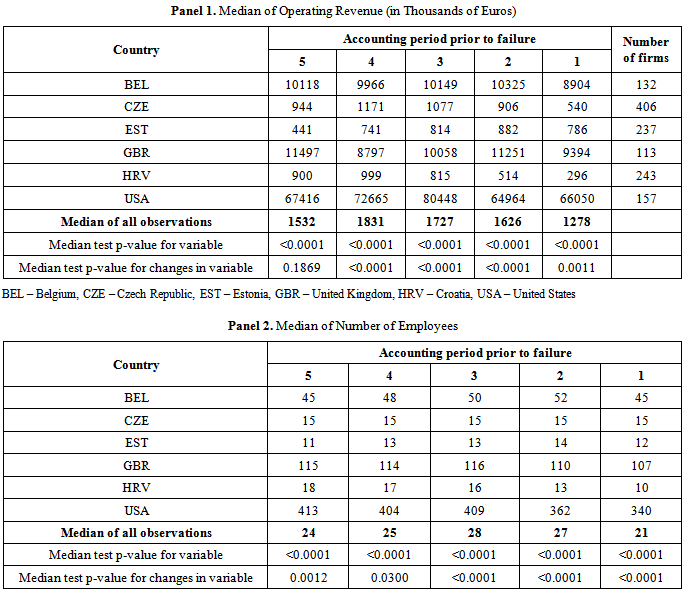
- The empirical data for this study are extracted from the Bureau van Dijk’s (BvD) Orbis database. The database encompasses financial information collected from data vendors of various countries, and the financial statement data are converted by BvD to standard formats to facilitate international comparisons.The dataset is composed of financial statement time series of failed firms, covering six different countries. The main criterion for selecting the countries in this study beside their heterogeneity with respect to development was that the dates of inactivity are coded in the database. This enables us to determine the time span between the last financial statement and the date of inactivity (bankruptcy/insolvency). Based on this span we can determine that each firm has bankrupted during the year after the last reporting year. The firms for this study were selected based on the failure status codes in Orbis (“Bankruptcy”, “Dissolved (bankruptcy)”, or in case of United Kingdom, “Active (insolvency proceedings)”). It is required that the owners of the firm have limited liability, whereby e.g. sole proprietorships, with very different financial characteristics, were excluded. Since we examine how the failure process evolves through time, we required that all five last consecutive financial reports must be available for each firm. After deleting firms that had incomplete information (turnover or operating revenue not disclosed, the amount of cash held by the company not reported, obvious or probable coding errors exist), we ended up with six countries, all of which had more than 100 failed firms fulfilling all the required criteria. The last financial statements cover the time range from 1992 to 2012, the majority (86%) coming from the years 2007-2011. Of the selected European countries, two are western highly developed economies (Belgium and United Kingdom, i.e. UK), whereas three represent emerging economies of the former socialistic block (Croatia, Czech Republic and Estonia). This gives the opportunity to compare failure processes in these potentially very different environments.Furthermore, as it is very interesting to examine what kind of differences exist between failure processes of European firms and those from the United States (US), we included financial statement data of failed US firms as well. It is noteworthy that the US data in Orbis are available only about listed (or formerly listed) failed firms, whereas the majority of our European dataset consists of privately held firms. This difference is, of course, kept in mind and noted in the analysis section. The number of firms is reported by country in the rightmost column of Panel 1 in Table 2.
|
|
|
|
|

|
|
4. Empirical Results
4.1. Size of Firms in Analysis
- Before outlining the results about failure process similarities and differences reflected through financial ratios and their changes, firm size aspect should be addressed as noted in the previous chapter. Table 2 shows the development of the median of size variables during the failure process in different countries. Panel 1 presents the development of operating revenues. Statistical tests show that the medians of the operating revenues and their change are not equal in the countries except for the change in the fifth year prior to failure. The median operating revenue is very high in the United States in comparison to other countries. In addition, in Belgium and United Kingdom the median is about ten times higher than the median in Czech Republic, Estonia, and Croatia. Panel 2 shows the median number of employees for the bankrupt firms. The statistical tests show that the number of employees and its change are also not equal through the six countries. However, the differences between countries are smaller than for operating revenue. In summary, the differences in size and its growth between the countries are significant and the countries can be classified into three groups according to the median size of bankrupt firms (US; UK & Belgium; and Czech Republic & Estonia & Croatia). This means that firms from former socialist countries in the current analysis are remarkably smaller and the publicly traded U.S. firms significantly larger than the firms from other countries.The differences in the failure process in terms of median change in size between the countries are remarkable. In Belgium, the process is stable except for the first year prior to bankruptcy when the size significantly decreases. In Czech Republic, the number of employees is constant for all years, but operating revenue decreases after the fourth year before bankruptcy and the decrease is very large in the first year. In Estonia, the median size increases until the first year when it remarkably decreases. In UK, the number of employees starts to decline in the second year whereas operating revenue does not decline before the first year. In Croatia, the diminishing of size is very strong and systematic after the fourth year prior to bankruptcy. For the large US firms, the negative process of decreasing size starts in the second year. In summary, the countries show significant differences in their failure process in terms of size measures. However, it is a common characteristic for each country that the median size remarkably declines at least in the first year prior to bankruptcy.
4.2. Return on Assets Ratio and Its Change
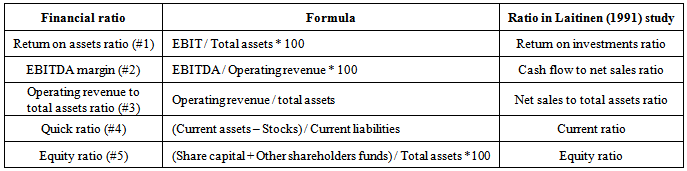
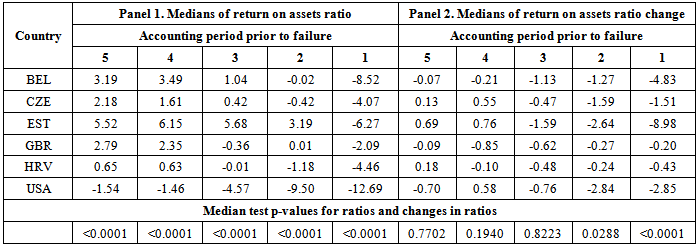
- Table 3 presents the values and changes of return on assets ratio. The medians of return on assets ratio are not equal for the countries in any of the five years, whereas the median changes in the ratios differ significantly from each other only in the first year before the event. Thus, in spite of the differences in the levels of the ratio, the changes reflecting the process are similar except for the first year. This allows to conclude that firms in different countries witness very similar development in profitability before collapse. The median ratio is negative for each country in the first year prior to bankruptcy and for most of them also in the second year. As can be seen from Table 8, the differences in the ratio development are mostly caused by Estonia and Belgium, of which the former shows a very large collapse in the ratio value. However, it should be noted that return on assets ratio can be among other factors affected by firm size. Namely, small firms are often characterized by the evaporation of most of the assets before failure, therefore the denominator becomes very small and the ratio and its change can show abnormal values when the numerator is a large negative figure (heavy losses during the year previous to bankruptcy). When in some countries the acceleration in the drop of profitability is evident (e.g. Belgium and Estonia), then for several others the dropping speed is quite stable during the last activity years (e.g. USA, Czech Republic, United Kingdom).
4.3. Traditional Cash Flow Ratio and its Change
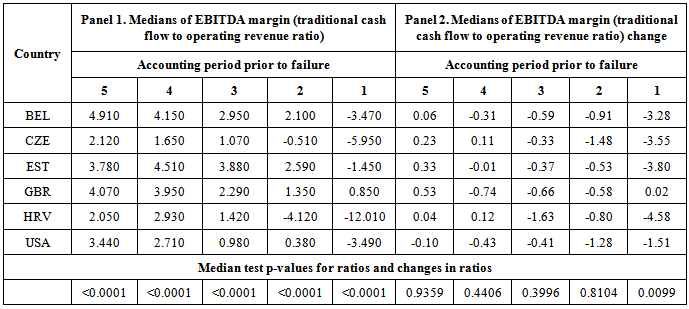
- Table 4 presents the values and changes of traditional cash flow ratio (EBITDA margin). Similarly to return on assets ratio, the values are significantly different through all viewed years, but for the ratio change this applies only for the first year before bankruptcy. Thus, the ratio change reflecting the failure process is very similar through countries. Similarly to the return on assets ratio, the values of EBITDA margin vary a lot through countries, but MT p-values indicate that changes are more similar. For all countries, the EBITDA margin is on an acceptable level before the first or second year before bankruptcy. On the contrary, the changes reflect a constant negative tendency and for the first year before bankruptcy the collapse in ratio value is large for most countries. The MTs with country pairs indicate that in all cases (n=4) where the medians are different for the first year before bankruptcy, this is always caused by United Kingdom as one country in the pair. Namely, unlike other countries, it shows slight improvement in the first year before bankruptcy, probably due to the fact that most of the collapse has already occurred during previous years. Out of all ratios studied, the EBITDA margin has the most similar development through six countries in the analysis (see Table 8).
4.4. Quick Ratio and its Change
- Table 5 presents the values and changes of quick ratio. The values and development of quick ratio follow exactly the same pattern as for two previously considered ratios. Namely, all values are significantly different through studied years and only the change during the first year before bankruptcy shows significant differences. Therefore, the conclusion is that this ratio acts very similarly in the failure process through all countries studied. The values of quick ratio indicate very low liquidity of firms, as mostly the ratio values remain under one per cent. The ratio collapses constantly but slowly for most of the countries, the largest decreases being mostly during the first year before bankruptcy. As Table 8 indicates, the evidence about the countries causing the differences in medians is mixed. Namely, each country is represented in the pairs 1-4 times. As the changes in the ratio values are very small, then a small growth in the decline speed in some country can cause the changes to differ already for several times, which is the main cause for dissimilarities during the first year before bankruptcy.
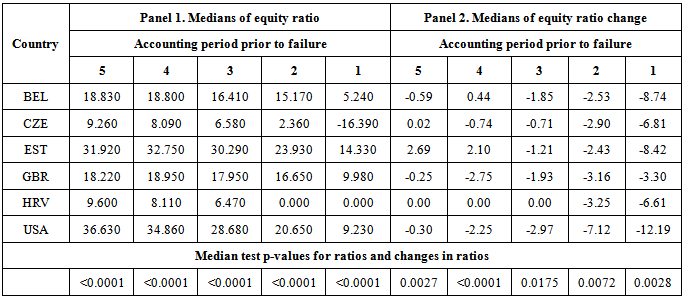
4.5. Equity Ratio and Its Change
- Table 6 presents the values and changes of equity ratio. Unlike other previously considered ratios, the values and changes for this ratio are very different through studied countries. When in some countries (e.g. United States, United Kingdom, Estonia) the values are on a reasonable or at least on a not very problematic level until the first year before bankruptcy, then in others (e.g. Czech Republic, Croatia) more or less lengthy problems can be outlined. For most of the countries, a steady collapse in the ratio value with a remarkable acceleration during the first year before bankruptcy can be observed. The causes in the differences of equity ratio values and changes through countries can include varying legislation (e.g. minimum equity requirements in business and/or insolvency codes), capital structure practice and accounting regulations. As can be seen from Table 8, there are numerous countries that differ from each other. At least for the first year before bankruptcy, the contributor to inter-country differences is United Kingdom with a remarkably lower change value when compared to other countries. Out of the ratios studied, the equity ratio acts very differently through countries and therefore it would for instance be very difficult to apply bankruptcy models created based on the data of one country and including the given variable, in another country.
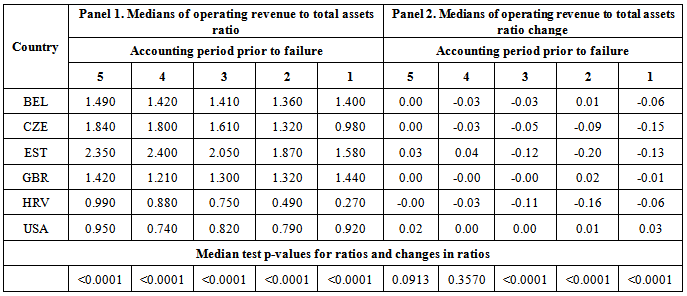
4.6. Efficiency Ratio and Its Change
- Table 7 presents the values and changes of operating revenue to total assets ratio. Similarly to equity ratio, the efficiency ratio’s values and changes reflect quite an unsteady pattern. Namely, it can be seen that both of those figures fluctuate considerably, so in several countries it definitely cannot be said that the situation for the fifth year before bankruptcy would be remarkably better than for the first year. Such abnormalities are probably caused by the fact that this ratio is affected by simultaneous evaporation of assets and decrease in sales when failure approaches. Only the changes in the fifth and fourth year before bankruptcy are not significantly different through studied countries. As can be seen from Table 8, all countries seem to contribute almost equally to the inter-country differences. It can also be said that in Eastern European countries the ratio goes through a steady collapse starting from different pre-failure years. Among studied countries, Croatia is characterized by an exceptionally low productivity of assets.
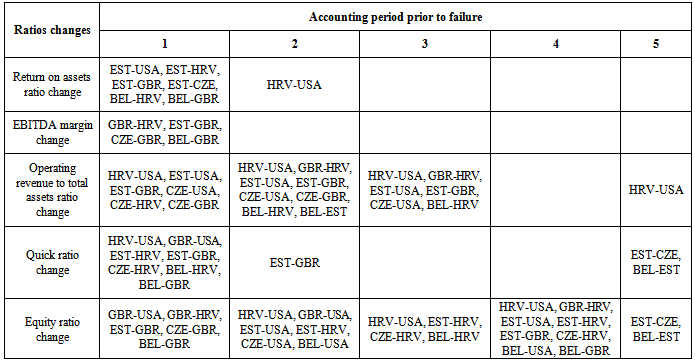
4.7. Summary of Financial Ratios
- The analysis with five ratios has demonstrated that the behaviour (i.e. values and changes) of financial ratios before failure can vary through countries. Out of five financial ratios studied over the period of five pre-failure years, median test showed that on all 25 occasions it was conducted, the differences in the ratio values through countries are significant on 0.01 p-level. On the contrary, in case of the financial ratio changes, the same result was 10 out of 25. Thus, financial ratios, except for equity ratio and operating revenue to total assets ratio, perform almost identically through countries in the failure process. Also, ratio changes tend to be different just before failure emerges: namely between first and second pre-bankruptcy year. Table 8 outlines which countries specifically differ from each other in case of all ratio changes. None of the countries are overwhelmingly causing the difference in the median ratio changes, although Czech Republic and Belgium are somewhat less represented than others.Thus, in case of Hypothesis 1, failure processes reflected through the values of pre-failure financial ratios are very different through countries, i.e. there is at least one among the set of countries viewed, which differs considerably from others. The dynamics reflected by ratio changes have remarkable similarities through different environments. Thus, it can be summarized that firms in different countries can differ considerably before failure (in terms of values of financial ratios), but on some occasions they can follow a very similar decline path (regarding changes of financial ratios). So, the static aspect in Hypothesis 1 finds solid proof, but in case of the dynamic aspect, there is more evidence in the current study design to reject it.
|
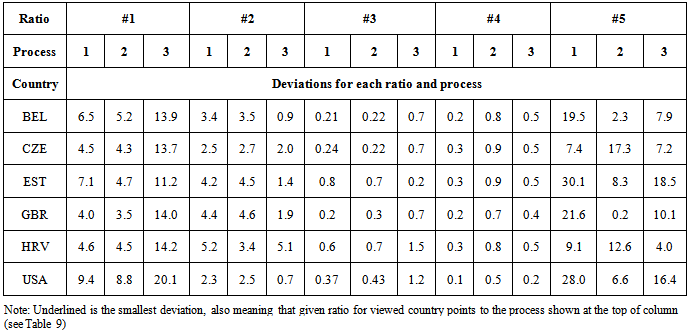
4.8. Comparison with Laitinen’s (1991) Taxonomy
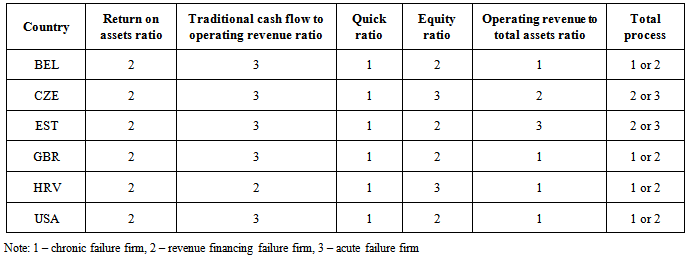
- The correspondence of single ratios and the whole set of ratios to different processes in Laitinen’ study [7] has been shown in Table 9. It can be seen that in highly developed economies chronic failure firm or revenue financing failure firm are the most common failing firm types. The same tendency is followed in Croatia. In two of the less developed economies (Czech Republic and Estonia), revenue financing failure firm or acute failure firm are the most common types. According to return on assets ratio, firms in all countries belong to revenue financing failure group and for quick ratio they all are in chronic failure group. The traditional cash flow to operating revenue ratio puts all firms except Croatia in acute failure group. Thus, based on only three before mentioned ratios it would be impossible to classify most of the firms to any failure process, as they all offer controversial evidence. The final grouping is determined by two remaining ratios, namely by equity ratio and operating revenue to total assets ratio, which both vary more through countries. Equity ratio classifies two countries to acute failure group and four to revenue financing failure group. Operating revenue to assets ratio shows more mixed evidence of processes, as all three are present, but still the dominant one is chronic failure firm.
|
|
5. Conclusions
- This paper focused on a novel topic of comparing firm failure processes through different countries. There is a scant amount of previous studies considering failure processes of firms, and empirical proof is even more modest. Numerous available bankruptcy prediction studies would suggest that firms in different environments are characterized by different predictors of default, bringing to the assumption that this phenomenon could be caused by different dominant failure processes. Several taxonomies of different failure processes have been created, of which the most elaborate based on only financial variables was found to be Laitinen’s (1991) approach.The current study examined the behaviour of financial ratios and their changes of bankrupted firms in six countries (US, UK, Belgium, Estonia, Czech Republic, Croatia), some of which are very different from one another, to study whether failure processes in given countries are similar or different. The analysis revealed that pre-failure profitability and cash flow ratios in different countries vary remarkably, but their changes are similar through countries almost for the whole failure process. Quick ratio also follows similar tendency as the two above ratios, but equity ratio and its changes are very different through countries. Similarly, efficiency ratio shows very different levels through countries, but a few of its changes from farther years to bankruptcy are in turn very similar.The available dataset was also applied to study which failure processes from Laitinen’s (1991) study are most common through different environments. It was found that in highly developed economies (i.e. US, UK and Belgium), chronic failure firm or revenue financing failure firm are the most common failing firm types. Thus, in those countries, probably due to the fact that median failed firm is larger, firms go through a lengthy failure process. The failure process of studied US firms could be compared with the downward spiral process of Hambrick and D’Aveni (1988). Interestingly, the same tendency as for firms from Western countries is followed by Croatian firms, but in two other less developed economies (Czech Republic and Estonia) revenue financing failure firm or acute failure firm are the most common failure processes.This seminal study about the differences of firm failure processes through various countries can be elaborated in several ways. For instance, connections between different ratios and their changes can be studied, but also distinct failure processes mined for each of the studied countries. Managers and entrepreneurs involved in international business can benefit from the study, as it offers insight into how the failure of firms in different environments can vary.
ACKNOWLEDGEMENTS
- The authors acknowledge financial support from Jenny & Antti Wihuri Foundation in Finland, Foundation for Economic Education in Finland and Estonian Science Foundation grant number ETF8546 “Internationalization processes: a typology, frequency and impact factors”.