-
Paper Information
- Next Paper
- Previous Paper
- Paper Submission
-
Journal Information
- About This Journal
- Editorial Board
- Current Issue
- Archive
- Author Guidelines
- Contact Us
International Journal of Finance and Accounting
p-ISSN: 2168-4812 e-ISSN: 2168-4820
2014; 3(2): 112-121
doi:10.5923/j.ijfa.20140302.08
The Impact of Firm's Size, and Firm's Debts Level on the Debt and Profitability Relationship of the Industrial Listed Companies in the Palestine Exchange
 Abstract
 Reference
 Full-Text PDF
 Full-text HTML
Zahran "Mohammad Ali" Daraghma
Associate Professor of Accounting, Chairman of Accounting Department, Faculty of Administrative and Financial Sciences, Department of Accountancy, Arab American University, Jenin, P.O. BOX 240, Palestine
Correspondence to: Zahran "Mohammad Ali" Daraghma, Associate Professor of Accounting, Chairman of Accounting Department, Faculty of Administrative and Financial Sciences, Department of Accountancy, Arab American University, Jenin, P.O. BOX 240, Palestine.
| Email: |  |
Copyright © 2014 Scientific & Academic Publishing. All Rights Reserved.
This paper aims to examine the impact of the debts on the accounting performance of the listed industrial companies in the Palestine Exchange; PEX and this is the first objective. The second objective aims to examine the influence of the firm's contextual factors (firm's size and firm's debts level) on the debt-performance relationship. The influence of the contextual factors is examined by classifying the data into two portfolios according to the firm's size and firm's debts level. In order to achieve the previous objectives, this paper has a sample of the accounting information that is taken from the industrial listed firms in the PEX for the period 2005-2012. This study employs a number of statistical tests (descriptive statistics, Pearson's correlation, the ordinary least squares, and pairwise Granger causality tests). Besides, 11 industrial listed Palestinian corporations were selected to examine the hypotheses [88 firm-year]. The findings of this paper state that the industrial listed corporations in the PEX rely on the equity financing where 75% represents equity financing. Furthermore, the debts financing enhances the profitability of the industrial listed firms in the PEX where there is a positive impact of debts on the performance. The second result shows that there is a positive impact of the debts on the profitability for both low size firms and high size firms while high size firms can exploit their debts in a feasible way better than the low size firms. The third conclusion shows that the debts have no role in explaining the profitability for the low debts level firms. Additionally, there is a positive influence of the debts on the financial performance for high debts level firms. The aforementioned result comes with a rule. The rule states that the high debts level firms have opportunity to maximize the wealth more than the low debts level firms. At last but not least, this paper recommends the stakeholders in Palestine to consider the debts for interpreting the profitability. It highly recommends the PEX to allow the listed corporations to issue restricted number of bonds.
Keywords: Industrial Sector, Contextual Factors, Profitability, Palestine Exchange [PEX], Optimal Capital Structure, Firm’s Size, and Debts Level
Cite this paper: Zahran "Mohammad Ali" Daraghma, The Impact of Firm's Size, and Firm's Debts Level on the Debt and Profitability Relationship of the Industrial Listed Companies in the Palestine Exchange, International Journal of Finance and Accounting , Vol. 3 No. 2, 2014, pp. 112-121. doi: 10.5923/j.ijfa.20140302.08.
Article Outline
1. Introduction
- The financial society recognizes that the high level risk could lead to high level of performance. In 1959 Markowitz shows that investor is basically risk-averse because investors should be given superior returns so as to accept higher risk. Many authors measure the risk using the financial leverage and Beta indicators such as [1], [10], [11], and [26]. The main target of any corporation is to maximize its value. This point of view is interpreted by the Modigliani and Miller [11]. They stated an important theory. The theory states that when an optimal capital structure is recognized, a corporation would be able to maximize earnings to its stockholders and these earnings would be higher than earnings obtained from a firm whose capital is only made up of equity. Another prove is the paper of [27] which explains that debt-financing reduces the agency costs related to equity financing such as the costs of stockholder dividends.The aforementioned analysis proves that there is a positive relationship between a specific level of risk and the financial performance. The studies of [22] and [33] show that a profit maximization process is influenced by picking an optimal capital structure. Moreover, many literatures show that the nature of the relationship between stock returns and the risk varies according to the contextual factors of a firm as in [30]. The most eminent contextual factors are firm size, industry, debts size and dividends. In contrast, other studies conclude that there is a negative relationship between risk and profit. This conclusion refers to the fact that states an optimal capital structure leads to a positive impact as in [37], [40], and [42]. However, the negative relationship comes as a result of the capital misuse. The previous discussion indicates a mix of findings about the relationship between the financial performance and debts. Other studies conclude that the sign of the relationship varies when the firms' characteristics are considered. The following are explanations of the firm’s size effect and the optimal capital effect on the sign of the relationship between the financial performance and debts. On the first hand, a large firm exploits the debts in the correct way. This assumption supposes a positive relationship between the profit and risk. On the second hand, the optimal capital structure leads to a positive relationship between profit and debts as in [2], [6], [9], [13], [17], [20], [21], [25], [29], [35], and [41].In Palestine, the paper of [39] is the only paper that examines the impact of capital structure on the performance of the banking sector. Their study does not examine the effect of the firm's contextual factors on the debts financing and financial performance association. Thus, this paper comes to provide additional evidence from the industrial listed companies in the PEX regarding the debts and financial performance relationship. Also, it comes to examine the impact of the firm's contextual factors (firm's size and debts level) on the relationship between the debts and the financial performance for the industrial listed companies in the Palatine exchange.The Palestine Exchange, for instance, established sixteen years ago, but the PEX is still an emerging market. Thus, there is insufficient evidence regarding the impact of debts on the firm’s performance and that is when the firm's contextual factors are considered. This reality encourages to investigate this matter from the environment of the industrial listed firms in the PEX. The findings of this paper provides a live evidence from Palestine regarding the topic of the paper and this is the first advantage. The second advantage is that the decision makers will be able to take the right decision regarding holding or selling the stocks and that is when the results of this paper are taken in account. The third advantage aims at investigating to which extent are the contextual factors of a firm (firm size and debts level) have an influence on the performance-debts relationship. However, in order to achieve the previous purposes, this paper depends on concrete methodology and follows the previous literatures. The methodology relies on the descriptive statistics, Pearson's correlation, the ordinary least squares, and pairwise Granger causality tests. Thus, this paper is divided into six sections. Section one is the introduction. Section 2 displays the previous research; section 3 presents the hypotheses of the study; section 4 reports the data and research method; section 5 displays the results of hypotheses testing, and section 6 indicates the conclusion remarks.
2. Literature Review
- Various previous studies examine the impact of debts and their composition on the performance of the corporations. Modigliani and Miller, (1958) [11] are the pioneers to landmark the topic of capital structure. They argued that capital structure was irrelevant in determining the firm’s value and its future performance. Also, Modigliani and Miller (1963) [12] showed that their model is no more effective if the tax was taken into consideration since tax subsidies on debt interest payments will cause a rise in firm value when equity is traded for debt. In 1976, the study of Jensen and Meckling [28] improved that the debts will increase the performance of a firm.Other studies provide a mixed evidence of debt structure. The studies of [16], [27], [34], and [38], for example, developed a model in which debt financing is shown to mitigate overinvestment problems but aggravate the underinvestment problem. Their model predicts that debt can have both a positive and a negative effect on firm performance and presumably both effects are present in all firms. Another example is the study of [23], which explains that the common element in the models of Myers, Jensen and Stulz focused on the link between the firm’s investment opportunity set and the effects of debt on the value of the firm. Thus, a reasonable conjecture will be that for firms with few growth opportunities, the positive effect of debt on firm performance will be more dominant whereas the opposite effect will apply for firms with high growth opportunities. In other words, the study of [23] points out that the relationship between ownership structure and firm performance will differ between low- and high-growth firms. Their conjecture is that ownership is likely to be more important for low-growth than for high-growth firms.Various studies have confirmed that firms with a high performance have a high debt to equity ratio, and explained a direct association between debts and firm performance as in [3], [4], [5], [6], [9], [13], [14], [19], [21], [24], [30], and [35]. Also, the study of Jensen [27] argues that debt is an efficient means by which to reduce the agency costs associated with equity. Moreover, the study of Kraus and Litzenberger [3] shows that with tax advantages of debt, optimal capital structure includes debt financing. In addition, the authors of [18] and [36] argue that debt can be valuable as a device for signaling firm value. In Jordan, the study of [33] investigates the impact of capital structure on corporate performance using a panel data sample representing 167 Jordanian companies during 1989-2003. The results showed that a firm’s capital structure had a significantly negative impact on the firm’s performance measures, in both the accounting and market’s measures. In addition, the paper of [33] found that the short-term debt to total assets has a significantly positive effect on the market performance measure. In the Kuwait, the study of [31] examined the impact of financing decisions, capital structure, capital budgeting techniques, and dividend policy on the financial performance using the panel data of 80 listed companies in Kuwait Stock Exchange [KSE]. The results of [31] suggest that, contrary to the trade-off theory of capital structure, there is a negative association between the level of debt and financial performance. These findings can be attributed to the high cost of borrowing and the underdeveloped nature of the debt market in Kuwait. Given the unique tax environment in Kuwait, using debt does not seem to be sufficient to outweigh the costs of using debt, including the high interest cost. The empirical findings also show that short-term debt has a significant and negative relationship with the accounting measures of performance (Return on Assets; ROA), while there is no impact of long-term debts. Because there is an inactive and an underdeveloped bond market, firms tend to involve more short-term loans than long-term loans. In Jordan the paper of [4] indicates that there is a negative relationship between the accounting performance and financial leverage. Additionally, in Sri Lanka, the paper of [32] indicates that the relationship between the capital structure and financial performance has a negative association.In Palestine, the study of [39] examines the relationship between the financial performance and capital structure of Palestinian financial institutions (banks). The study found a model to measure the effect of capital structure on the bank performance measured by Return on Equity; ROE, Return on Assets; ROA, total deposit to assets, total loans to assets and total loans to deposits. The results of [39] indicated that leverage has a negative impact on bank profitability. Also, the paper of [39] tests the effect of leverage on bank performance using Tobin's Q. It was also found that leverage has a negative effect on the Tobin's Q of the Palestinian banks.In Thailand the study of [7] examines the impact of the firm's size on the relation between the financial leverage and operating performance during 2007–2009. From a data set of 496,430 firm-year observations of a sample of 170,013 firms, the study finds that after controlling the firm's size, a negative relationship between the leverage and financial performance exists. In addition, the study shows that operating performance is strongly related to leverage change for medium-sized firms, but this relationship does not exist among very small and very large firms.
3. The Hypotheses
- This paper aims to examine the impact of the firm's contextual factors (firm's size and firm's debts level) of the industrial listed companies in the PEX on the relationship between debts and performance. Then, this paper comes to investigate the following hypotheses:H1o: The debts have no impact on the industrial listed companies’ performance.H2o: The firm's size has no impact on the debts and financial performance relationship for the industrial companies. H3o: The firm's debts level has no impact on the debts and financial performance relationship for the industrial companies.
4. The Methodology
- This section describes the research approach, data, econometric techniques, study variables, and econometric models and hypotheses testing. Presented below are the clarifications of the abovementioned elements.
4.1. Research Approach
- This paper depends on the empirical approach (positive theory) to examine the hypotheses by using the historical accounting data that published by the listed industrial companies in the Palestine Exchange. The positive accounting approach provides empirical evidence from the practice. And this approach assists to compare the outcomes with the theory of accounting. However, the theory of accounting and finance failed to provide clear evidence regarding the sign of the relationship between the debts and financial performance as explained in section (2). Accordingly, this paper will provide evidence from the industrial listed firms in the PEX. The next section (4.2.) displays the sample and data collection.
4.2. Data
- The sample of this paper includes the industrial listed corporations in the Palestine Exchange (PEX) for an 8-year period from 2005-2012. This sample is selected according to the following conditions: a- Company should be listed in the Palestine Exchange. b- Company must be an industrial firm. c- Company's stock is traded. d- Company should be listed before January 1, 2012. Therefore, 11 industrial corporations meet the previous conditions. These corporations are selected to match the purposes of this paper by using the econometric models. What is more, the accounting data was gathered from the website of the PEX [www.p-s-e.com], companies guide, and the financial reports of the industrial corporations.
4.3. Econometric Techniques
- In order to achieve the objectives of this paper, the econometric techniques should be taken in account. Previous studies test the impact of the debts on the accounting performance by employing the following tests (Pearson's correlation, the ordinary least squares, and the Granger causality tests). The Granger causality is a statistical hypothesis test for determining whether one variable is valuable in explaining another as in [8]. The causality between the debts and the accounting profit is expressed as the following:1. Debts does not Granger cause the accounting profit.2. The accounting profit does not Granger cause debts.The ordinary least squares relies on the assumption that supposes a linear relationship between the accounting profit (the dependent variable) and the debts (the independent variable). On the other hand, the impact of the firm's contextual factors are examined by dividing the sample into two portfolios according to the firm's size and firm's debts level. The adjusted R squared is used for examining the impact of contextual factors.
4.4. Study Variables
- The hypotheses of this paper state that the firm's contextual factors (firm's size and firm's debts level) have an effect on the relationship between the firm's profit and debts. Accordingly, this paper utilizes the variables that are used in the econometric models. Below are the definitions of the study variables.The first variable: The dependent variable represents the firm profit. In this paper, the Earnings Per Share is used to measure the performance. The Earnings Per Share is computed using the following equation:
 Where:EPSit: The Earnings Per Share of firm I for year t.NPit: Net operating income after tax of firm I for period t.PSDit: Dividends on preferred stocks of firm I for period t.NIOSit: Average issued and outstanding common shares of firm I for year t.The second variable: The independent variable is the debt ratio. This ratio is calculated using the debt/ total assets which is similar to the recent studies of [2], [15], [20], [25], and [43]. Mathematically, the debt ratio is calculated as follows:
 Where:LRit: The debt ratio of firm I for year t.TDit: Total debts of firm I for period t.TAit: Total assets of firm I for period t.The third variable: In this paper, the mediating variables are used to test hypothesis number 2 and 3. Hypothesis number 2 states that "There is no impact of the firm's size on the debts-performance relationship for the industrial companies" [the null hypothesis]. Also, the firm's size is measured by using the natural logarithm of the net sales. Mathematically, the firm's size is calculated as follows:
 Where:FSit: The size of firm I for year t.SLit: Total sales of firm I for period t.Log: The natural logarithm.The second hypothesis of this paper provides an evidence regarding the impact of the firm's size on the debts-performance relationship for the industrial companies. This could be achieved by classifying the companies into two portfolios (high size portfolio, and low size firms). Moreover, this paper compares the relationship sign of the two sub-samples by relying on the value of adjusted R squared. The third hypothesis states that "There is no impact of firm's debts level on the debts-performance relationship for the industrial companies." [the null hypothesis]. The firm's debts level is measured by using the total debts/ total assets. Mathematically, the debt level is calculated as follows:
 Where:LRit: The debts level of firm I for year t.TDit: Total debts of firm I for year t.TAit: Total assets of firm I for year t.The third hypothesis of this paper provides an evidence regarding the impact of firm's debts level on the debts-performance relationship for the industrial companies. This hypothesis could be examined by classifying the companies into two portfolios (high debts level firms, and low debts level firms). This paper compares the relationship sign of the two sub-samples by relying on the value of adjusted R squared.
 4.5. Econometric Models and Hypotheses Testing
- This section comes to design econometric models for testing the hypotheses of this paper. Hereinafter is a description of the mechanisms that used for testing each hypothesis:
4.5.1. An Econometric Model for Testing the First Hypothesis
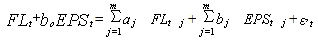
- The ordinary least squares and Granger causality models are used for examining the first hypothesis. Presented below is the simple linear equation:
 Where:EPSit: The Earnings Per Share of firm I for year t.LRit: The debt ratio of firm I for year t.α0: The constant.α1: The debt ratio response coefficient. This coefficient explains the role of debts in explaining the profitability of firm I for year t.
4.5.2. Econometric Model for Testing the Second Hypothesis
- This paper examines the impact of a firm's size on the debts-performance relationship by dividing the sample into two portfolios (high size firms and low size firms). The adjusted R square is used for testing the impact of firm's size. For instance, the firm's size is measured by using the natural logarithm of the net sales. And the sample is classified according to the mean of firm's size. The outliers were excluded from the sub-samples. Presented below are the definitions of high size firms and low size firms:Firstly: The values above the mean represent high size firms.Secondly: The values below the mean represent low size firms.The simple linear regression is implemented two times. The first run is for high size firms portfolio. The second run is for low size firms portfolio.
4.5.3. An Econometric Model for Testing the Third Hypothesis
- The third hypothesis is tested by classifying the sample into two portfolios (high debts level firms and low debts level firms). The impact of debts level on the debts-performance relationship is examined by using the adjusted R square. For instance, the firm's debts level is measured by using the debt ratio. And the sample is classified according to the mean of firm's debts level. Also, the outliers were excluded from the sub-samples. Presented below are the definitions of the high debts level firms and low debts level firms:Firstly: The values above the mean represent high debts level firms.Secondly: The values below the mean represent low debts level firms.The simple regression is implemented two times. The first run is for high debts level firms portfolio. And the second run is for low debts level firms portfolio.
5. The Results
- This section shows both the descriptive statistics and hypotheses testing results by exploiting the econometric methods that used by other researchers like [2], [3], [5], [6], [9], [13], [14], [19], [20], [21], [24], [25], [30], [35], [41], and [43]. Presented below are the findings of this paper.
5.1. The Descriptive Statistics
- Table 1 displays the descriptive statistics of Earnings Per Share; EPS for the annual and pooled data of 11 industrial listed corporations in the Palestine Exchange (PEX) from 2005-2012, 88 firm-year. As well, the average of the EPS is positive for the annual and pooled data. The mean of pooled data is 0.236. What’s more, this paper concludes that in average the industrial listed companies achieve profit.
|

|

|

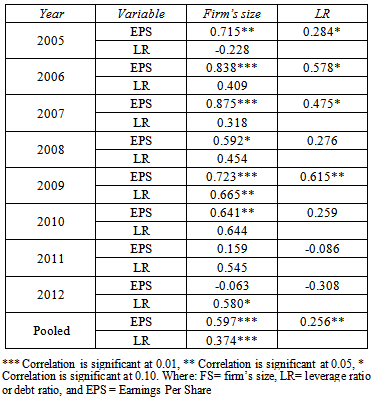
5.2. The Correlation Matrix
- Table 4 illustrates the outcomes of Pearson correlation statistic for the annual and pooled time series of the firm’s size, debt ratio, and the Earnings Per Share. The correlation test demonstrates the following findings.
|
5.3. The Findings
- This part comes to investigate the three hypotheses of this paper. This part establishes concrete conclusion from the environment of the industrial listed firms in the PEX regarding the impact of firm’s size and firm’s debts level on the financial performance and the financial leverage relationship. Besides, this section provides a model to determine the sign of the relationship between the risk and profitability. Presented below are the outcomes of the three hypotheses of this paper.
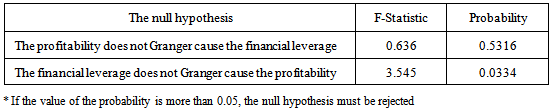
5.3.1. Findings of Hypothesis Number One
|

 | (1) |
 | (2) |
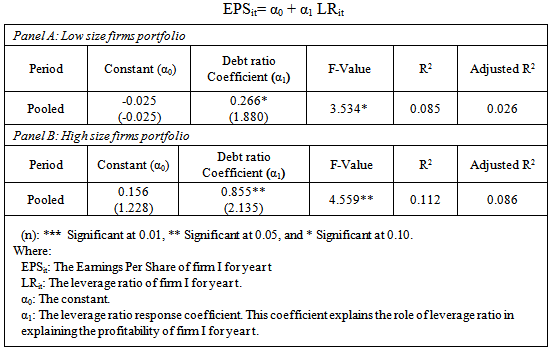
5.3.2. Findings of Hypothesis Number Two
- This section comes to examine the impact of firm’s size on the relationship between the financial performance and the financial leverage regarding the industrial listed corporations in the PEX. Table 6 consists of two panels, where panel [A] tests the financial performance and financial leverage relationship for low size firms. Panel [B] tests the financial performance and financial leverage relationship for high size firms.
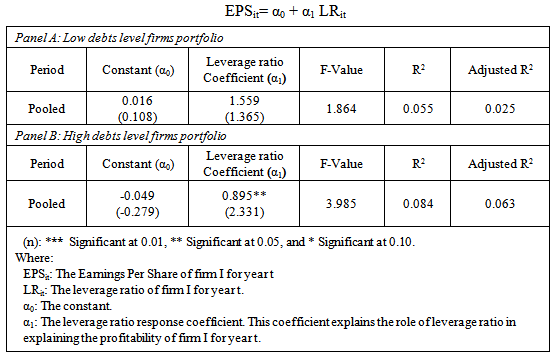
5.3.3. Findings of Hypothesis Number Three
- This part comes to investigate the influence of firm’s debts level on the relationship between the financial performance and the financial leverage regarding the industrial listed corporations in the PEX. Table 7 comprises of two panels where panel [A] examines the earnings and the financial leverage connection for low debts level firms. Panel [B] examines the financial performance and financial leverage relationship for high debts level firms. Panel [A] shows that there is no role of debts in explaining the profitability of low debts level. Also, the value of adjusted R squared 0.025 and the model is statistically insignificant. Additionally, Panel [B] demonstrates that there is positive influence of the debt ratio on the financial performance for high debts level firms. The value of adjusted R squared 0.063 and the model is statistically significant. The value of adjusted R squared shows that the debt ratio interpret 6.3% of the performance for the high debts level firms. The previous discussion concludes a rule. The rule states that the high debts level firms have opportunity to maximize the wealth more than the low debts level firms in the Palestinian environment.
|
|
6. Conclusions
- This paper add to the dispute about the profitability-financial leverage relationship of the industrial listed companies in the Palestine Exchange; PEX. It also examines the influence of the firm's contextual factors (firm's size and the firm's debts level) on the profitability-financial leverage relationship by dividing the data into two portfolios and that is according to the firm's size and firm's debt level. The achievement of the previous objectives requires obtaining financial data from the industrial listed corporations in the PEX for the years 2005-2012. In addition, the study utilizes a number of econometric tests (descriptive statistics, Pearson's correlation, the ordinary least squares, and pairwise Granger causality tests). 11 industrial listed corporations in the PEX are selected to examine the hypotheses [88 firm-year]. However, this paper comes with three important findings. Firstly, the industrial listed corporations in the PEX rely on the equity by 75%. In addition, the analysis shows a positive impact of debts on the financial performance. Secondly, the financial leverage has a positive impact on the profitability for low size firms and for high size firms while the high size firms can exploit their debts in feasible way better than low size firms. Thirdly, there is no role of debts in explaining the profitability for the low debts level firms. Also, there is a positive influence of the debts on the financial performance for the high debts level firms. However, the previous result concludes a rule. The rule states that the high debts level firms have opportunity to maximize the wealth more than the low debts level firms. Finally, this paper recommends the stakeholders in Palestine to consider the debts for interpreting the profitability. It highly recommends the PEX to allow the listed corporations to issue restricted number of bonds.
References
| [1] | Afkar Bhatti, Kamran Majeed, Ijaz-Ur-Rehman, and Waqas Khan. (2010). Affect of Leverage on Risk and Stock Returns: Evidence from Pakistani Companies. International Research Journal of Finance and Economics. Issue 58. PP 32 -49. |
| [2] | Akinmulegun Ojo. (2012). The Effect of Financial Leverage on Corporate Performance of Some Selected Companies in Nigeria. Canadian Social Science. Vol. 8, no. 1. PP. 85-9. |
| [3] | Alan Kraus, and Robert Litzenberger. (1973). A State Preference Model of Optimal financial Leverage. Journal of Finance. Vol. 28, no. 4. PP 911–922. |
| [4] | Anas AL-Qudah, and Mahmoud Laham. (2013). The Effect of Financial Leverage and Systematic Risk on Stock Returns in the Amman Stock Exchange (Analytical Study – Industrial Sector). Research Journal of Finance and Accounting. Vol. 4, no. 6. PP 136 – 145. |
| [5] | Andrei Shleifer and Robert Vishny. (1986). Large Shareholders and Corporate Control. Journal of Political Economy. Vol. 94, no. 3. PP 461-488. |
| [6] | Armen Hovakimian, Tim Opler, and Sheridan Titman. (2001). The Debt-Equity Choice. Journal of Financial and Quantitative Analysis. Vol. 36, no. 1. PP 1-24. |
| [7] | Chaiporn Vithessonthi and Jittima Tongurai. (2013). The Effect of Firm Size on the Leverage-Performance Relationship during the Financial Crisis of 2007–2009 Available at SSRN: http://ssrn.com/abstract=2285980 2285980. |
| [8] | Clive Granger. (1969). Investigating Causal Relations by Econometric Models and Cross-spectral Methods. Econometrica. Vol. 37, no 3. PP 424-438. |
| [9] | Eric Gedajlovic, and Daniel Shapiro. (1998). Management and Ownership Effects: Evidence from Five Countries. Strategic Management Journal. Vol. 19, no. 6. PP 533-553. |
| [10] | Eugene Fama and Kenneth French. (1992). The Cross-Section of Expected Stock Returns. Journal of Finance. Vol. 47, no 2. PP 427-465. |
| [11] | Franco Modigliani, and Merton Miller. (1958). The Cost of Capital, Corporation Finance and the Theory of Investment. American Economic Review. Vol. 48, no. 3. PP 261-297. |
| [12] | Franco Modigliani, and Merton Miller. (1963). Corporate income taxes and the cost of capital: A correction. American economic Review. Vol. 53, no. 3. PP 433-443. |
| [13] | Frijns, B., A. Gilbert and P. Reumers. (2008). Corporate Ownership Structure and Firm Performance: Evidence from the Netherlands. Journal of Corporate Ownership and Control. Vol. 6. PP 382-392. |
| [14] | Gary Gorton and Frank Schmidc. (2000). Universal Banking and the Performance of German Firms. Journal of Financial Economics. Vol. 58, no 1. PP 29-80. |
| [15] | Harry Markowitz and Artur Raviv. (1991). The Theory of Capital Structure. Journal of Finance. Vol. 46, no. 1. PP 297-355. |
| [16] | Harry Markowitz. (1959). Portfolio Selection. Journal of Finance. Vol. 7, no. 1. PP 77- 91. |
| [17] | Harry Markowitz. (1959). Portfolio selection. Wiley & Sons, Inc., New York. |
| [18] | Hayne Leland, and David Pyle. (1977). Informational Asymmetries, Financial Structure and financial Intermediation. Journal of Finance. Vol. 32, no. 2. PP 371-387. |
| [19] | Helen Short. (1994). Ownership, Control, Financial Structure and the Performance of Firms. Journal of Economic Surveys. Vol. 8, no 3. PP 203-249. |
| [20] | Jamie Alcock, Andrew Baum, Nicholas Colley, and Eva Steiner. (2013). The Role of Financial Leverage in the Performance of Private Equity Real Estate Funds. The Journal of Portfolio Management. Vol. 39, no. 5. PP 99-110. |
| [21] | Jan Mahrt-Smith. (2005). The Interaction of Capital Structure and Ownership Structure. The Journal of Business Vol. 78, no. 3. PP 787-816. |
| [22] | John Graham. (2000). How Big Are the Taxes Benefits of Debt. The Journal of Finance. Vol. 55, no. 5. PP 1901-1942. |
| [23] | John J. McConnell and Henri Servaes. (1995). Equity Ownership and the Two Faces of Debt. Journal of Financial Economics. Vol. 39, no. 1. PP 131-157. |
| [24] | Jun-Koo Kang and Anil Shivdasani. (1995). Firm Performance, Corporate Governance, and Top Executive Turnover in Japan. Journal of Financial Economics. Vol. 38, no. 1. PP 29-58. |
| [25] | Kym Ardison, Antonio Martinez, and Fernando Galdi. (2012). The Effect of Leverage on Earnings Management in Brazil. Advances in Scientific and Applied Accounting. Vol. 5, no. 3. PP 305-324. |
| [26] | Laxmi Bhandari. (1988). Debt/Equity Ratio and Expected Common Stock Returns: Empirical Evidence. Journal of Finance. Vol. 43, no. 2. PP 507-528. |
| [27] | Michael C. Jensen. (1986). Agency Costs of Free Cash Flow, Corporate Finance, and Takeovers. American Economic Review. Vol. 76, no. 2. PP 323-329. |
| [28] | Michael Jensen and William Meckling. (1976). Theory of the Firm: Managerial Behavior, Agency Costs and Capital Structure. Journal of Financial Economics. Vol. 3, no. 4. PP 305–360. |
| [29] | Michael Lubatkin and Sayan Chatterjee. (1994). Extending Modern Portfolio Theory into the Domain of Corporate Diversification: Does it Apply?. Academy of Management Journal. Vol. 37, no. 1. PP 109-136. |
| [30] | Milton Harris and Artur Raviv. (1990). Capital Structure and the Informational Role of Debt. Journal of Finance. Vol. 45, no. 2. PP 321–350. |
| [31] | Mohammad Al Mutairi and Helen Hasan. (2010). The Effect of Corporate Governance, Corporate Financing Decision and Ownership Structure on Firm Performance: A Panel Data Approach from Kuwait Stock Exchange. Available at SSRN: http://ssrn.com/abstract=1716051. |
| [32] | Puwanenthiren Pratheepkanth. (2011). Capital Structure and Financial Performance: Evidence from Selected Business Companies in Colombo Stock Exchange. Journal of Arts, Science & Commerce. Vol. 2, no. 2. PP 171-183. |
| [33] | Rami Zeitun and Gary Tian. (2007). Capital Structure and Corporate Performance: Evidence from Jordan. Australasian Accounting Business and Finance Journal. Vol. 1, no. 4. PP 40 – 61. |
| [34] | Rene Stulz. (1990). Managerial Discretion and Optimal Financing Policies. Journal of Financial Economics. Vol. 26, no 1. PP 3-27. |
| [35] | Steen Thomsen and Torben Pedersen. (2000). Ownership Structure and Economic Performance in the Largest European Companies. Strategic Management Journal. Vol. 21, no. 6. PP 689-705. |
| [36] | Stephen A. Ross. (1977). The Determination of Financial Structure: The Incentive-signaling Approach. The Bell Journal of Economics. Vol. 8, no. 1. PP 23–40. |
| [37] | Stephenh Penman, Scott Richardson, and Irem Tuna. (2007). The Book-to-Price Effect in Stock Returns: Accounting for Leverage. Journal of Accounting Research. Vol. 45, no. 2. PP 427-467. |
| [38] | Stewart Myers. (1977). Determinants of Corporate Borrowing. Journal of Financial Economics. Vol. 5, no. 2. PP 147-175. |
| [39] | Suleiman Abbadi and Nour Abu-Rub. (2012) . The Effect of Capital Structure on the Performance of Palestinian Financial Institutions. British Journal of Economics, Finance and Management Sciences. Vol. 3, no 2. PP 92-101. |
| [40] | Thomas George and Chuan-Yang Hwang. (2009). A Resolution of the Distress Risk and Leverage Puzzles in the Cross Section of Stock Returns. Journal of Financial Economics. Vol. 96, no. 1. PP 56-79. |
| [41] | Torben Pedersen and Steen Thomsen. (2003). Ownership Structure and Value of the Largest European Firms: The Importance of Owner Identity. Journal of Management and Governance. Vol. 7, no. 1. PP 27-55. |
| [42] | Valentin Dimitrov and Prem Jain. (2008). The Value Relevance of Changes in Financial Leverage Beyond Growth in Assets and GAAP Earnings. Journal of Accounting, Auditing and Finance. Vol. 23, no. 2. PP 191-222. |
| [43] | Zeynab Radchobeh, Shaer Biyabani, and Hashem Nikoumaram. (2012). Evaluation on the Relation between Earning Response Coefficient (ERC) and Financial Leverage. Journal of Life Science and Biomedicine. Vol. 3, no1. PP 83-87. |