-
Paper Information
- Next Paper
- Previous Paper
- Paper Submission
-
Journal Information
- About This Journal
- Editorial Board
- Current Issue
- Archive
- Author Guidelines
- Contact Us
International Journal of Finance and Accounting
p-ISSN: 2168-4812 e-ISSN: 2168-4820
2014; 3(2): 102-111
doi:10.5923/j.ijfa.20140302.07
Volume Determinants of Cash Segments of the Indian Stock Market - A Critical Assessment
 Abstract
 Reference
 Full-Text PDF
 Full-text HTML
Ranjan Dasgupta
Institute of Engineering & Management (IEM), Kolkata 117, Dum Dum Park, Flat No. 4, 2nd Floor, Spandan Apartment, Kolkata, 700055, West Bengal, India
Correspondence to: Ranjan Dasgupta, Institute of Engineering & Management (IEM), Kolkata 117, Dum Dum Park, Flat No. 4, 2nd Floor, Spandan Apartment, Kolkata, 700055, West Bengal, India.
| Email: |  |
Copyright © 2014 Scientific & Academic Publishing. All Rights Reserved.
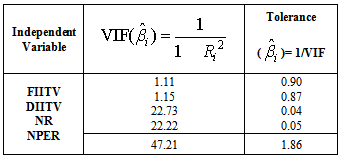
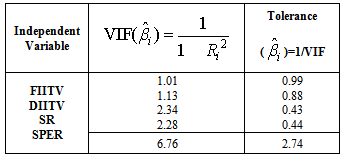
Post-September, 1992 surge of Foreign Institutional Investors flows and pouring money by Domestic Institutional Investors have been continuously raising the volume in Cash Segments of Indian stock market, i.e., the National Stock Exchange (NSE) and Bombay Stock Exchange (BSE). They critically consider Price/Earnings Ratios and Index returns for investment decisions. This study aims at finding out the most critical determinant of volume in cash segments. It has undertaken five years (2007-08-2011-12) monthly data of all those determinants to find out the most critical one to drive the volume in Cash Segments of NSE and BSE. It has used Augmented Dickey-Fuller (ADF) tests for judging stationarity of the data series. Based on the above results this study forms two multiple regression equations to get the empirical results. To make this study more reliable some tabular facts are also presented and multicollinearity of the data series is checked by Variance inflation factor (VIF) and tolerance limits. This study has found that the data series are stationary at level [i.e., I(0)]. The subsequent multiple regression results show that DIIs total trading value is the most critical driver in driving the volume in Cash Segments of the Indian stock market. However, it is in contradiction of the tabular facts which show FIIs total trading value as the major driver. Another critical observation is that multicollinearity is high in NSE data set, but not so in the BSE data set. Overall, this study has pointed out that total trading value of Indian stock market’s Cash Segments which is an evidence of market liquidity and size has been significantly influenced by DIIs total trading value, BSE SENSEX and CNX Nifty P/E Ratio, etc. in that order.
Keywords: Indian stock market, Total trading value, Critical driver, ADF tests, Multiple regression equations, FIIs, DIIs, Multicollinearity
Cite this paper: Ranjan Dasgupta, Volume Determinants of Cash Segments of the Indian Stock Market - A Critical Assessment, International Journal of Finance and Accounting , Vol. 3 No. 2, 2014, pp. 102-111. doi: 10.5923/j.ijfa.20140302.07.
Article Outline
1. Introduction
- The miraculous economic growth during the past two decades in most of the emerging economies including India had been stimulated by cross-border capital inflows from developed countries. The period post-1990s witnessed sharp rise in flows of foreign private capital and traditional modes of finance lost its predominance. Most of the developing countries opened their capital markets to Foreign Institutional Investors (FIIs) either because of inflationary pressures, widening current account deficits, exchange rate depreciation, and increase in foreign debt or as a result of liberal economic policy. There was a surge in capital inflows into India post-September, 1992 when the purchase of domestic securities by the FIIs was first allowed as a part of the liberalization process that followed the debt crisis in late 1980s and the Balance of Payments (BOPs) crisis in 1990-91. The immediate impact of Indian stock market’s opening up to the FIIs was the surge in trading volume and capital inflows to those markets including the National Stock Exchange (NSE) and the Bombay [now Mumbai] Stock Exchange (BSE), result of which is the boom in S&P CNX Nifty’s and SENSEX’s prices overall and rise in prices of Indian blue chip stocks.Since the introduction of the reform process in early 1990s, India has witnessed a significant increase in international capital flows, a trend that represents a clear break from the past decades post-independence. The impact of FIIs on Indian stock market all these years has been enormous as the figure has shown that FIIs net investment has risen from Rs.2,595.10 crores in 1993 to Rs.11,07,399 crores till March, 2012 [SEBI (2012: 330)]. The number of FIIs registered with SEBI has also increased from 18 in 1993 to 1757 by March, 2012 (Source: BSE Website). The development of Indian breed of institutional investors, i.e., the Domestic Institutional Investors (DIIs) has also pushed the trading volume of Indian stock markets represented by the NSE and BSE. Strong and positive net investment flows (i.e., gross purchases − gross sales) by the FIIs and DIIs to Indian stock market in the recent past has fuelled by the improvement in GDP numbers, better corporate performance, positive investment climate, strong long-term view on India as an investment destination by all, favourable liquidity conditions and falling interest rates in the global market. Also, enormous enthusiasm of the FIIs in Indian capital market may be on account of a well structured, regulated and matured capital market, low risk and evidence of basic fundamental factors. The capital market in India could be able to face financial crises effectively (as evident during sub-prime crisis days, Satyam scam and many more) with the help of ever-vigilant regulatory authorities. Macro-economic factors like a strong currency, key reforms in the banking, power and telecommunications sector, increased consumer spending and stable policies are expected to play a critical role in attracting more investors (both FIIs and DIIs) to Indian stock markets in the coming years.So, this present empirical study is a timely introspect in Indian stock market (represented by the S&P CNX Nifty from NSE and the SENSEX from BSE) to find out the most critical determinant of volume in cash segments. This study would be of immense help to the policy-makers, domestic and foreign investors – especially to all retail investors, and to future researchers as it would provide a deep insight to an under-researched issue of Indian stock market.
2. The FIIs and DIIs
- Post-September, 1992 India received portfolio investment from the FIIs in all the securities traded on the primary and secondary markets, including shares, debentures and warrants issued by companies which were listed or were to be listed on the stock exchanges in India and in the schemes floated by domestic Mutual Funds (MFs). The DIIs including banks, Development Finance Institutions (DFIs), insurance companies, New Pension Scheme (NPS), MF industries, etc. also started pouring money in Indian stock market from early 2000s. The opening up of Indian stock market to the FIIs resulted in a number of positive effects. First, the stock exchanges were forced to improve the quality of their trading and settlement procedures in accordance with the best practices of the world. Second, the information environment in India improved with the advent of major international FIIs in India. On the negative side one needs to consider potential destabilization as a result of the trading activity of the FIIs. This is especially important in an emerging economy like India that has embarked upon reforms to open up its capital market. However, Ahmed, Ashraf and Ahmed (2005: 21-33) confirmed that there has been very little destabilizing effect of the FIIs flows on individual equity returns of the firms during their period of study.Schedule 2 of the Regulation 5(2) of Notification No. 20/RB-2000 dated 3rd May 2003 deals with the provisions relating to portfolio investment by the FIIs. An FII has been defined as an Institution organized outside of India for the purpose of making investments into the Indian stock market under the regulations prescribed by the Securities & Exchange Board of India (SEBI). ‘FIIs’ include “Overseas pension funds, mutual funds, investment trust, asset management company, nominee company, bank, institutional portfolio manager, university funds, endowments, foundations, charitable trusts, charitable societies, a trustee or power of attorney holder incorporated or established outside India proposing to make proprietary investments or investments on behalf of a broad-based fund”. The ceiling for overall investment for the FIIs is 24 per cent of the paid up capital (PUC) of any Indian company. The ceiling of 24 per cent for FIIs’ investment could be raised up to sectoral cap/statutory ceiling as prescribed by the Government of India (GOI)/Reserve Bank of India (RBI), subject to the approval of the Board and the general body of the company passing a special resolution to that effect.In recent years, the FIIs have displayed a strong appetite for Indian equities (especially in the Cash Segments) along with the DIIs as shown in Table 1. The FIIs registered with SEBI come from as many as 28 countries (including money management companies operating in India on behalf of foreign investors).In comparison to FIIs, Indian DIIs tend to be conservative in their investment decisions, with a general preference for safe returns and capital preservation. As for large DIIs, such as, banks, DFIs, pension funds and insurance companies, their investment style has largely been the result of regulation by respective authorities. Portfolio allocation decisions by the insurance and pension fund sectors remain strictly regulated, requiring each to invest between 25 to 50 percent of total funds in Government bonds or Government-approved securities. For example, just over 85 percent of the LIC’s total investments are in public securities - most of which are of long-term maturities - and about 15 percent in private securities. However, the MF companies have no such regulation for their strategic asset allocation. So, amidst this situations, the role and importance of the DIIs in comparison to their foreign counterparts, i.e., the FIIs is very relevant and critical to be studied.
3. The NSE, BSE, S&P CNX Nifty Index and SENSEX
- Established in 1875, BSE is not only the oldest stock exchange in India, but is also the oldest in Asia. It accounts for over one-third of the total trading volume in the country. BSE, in 1986, came out with a Stock Index - SENSEX - that subsequently became the barometer of the Indian stock market. BSE SENSEX is a basket of 30 constituent stocks representing a sample of large, well-established, financially sound, liquid and representative companies across key sectors. The base year of SENSEX is 1978-79 and the base value is 100. The aggregate market capitalization (MC) of BSE was around Rs.62,149.41 billion and that of BSE SENSEX was around Rs.14,591.41 billion (as on 31st March 2012). The Index is widely reported in both domestic and international markets through print as well as electronic media. The stocks in this Index are the ones in which the FIIs are most likely to invest in.NSE, a more recent establishment which came into existence in 1992, is the largest and most advanced stock market in India. It is also the third biggest stock exchange in Asia in terms of trading volume (or total trading value). On 22nd April 1996, NSE launched a new Equity Index ‘The NSE-50’ (better known as Nifty-50). The base period for the Index is the close of prices on 3rd November 1995 which makes one year of completion of operation of NSE’s Capital Market (CM) Segment. The base value of the Index was set at 1000. The new Index, which replaces the existing NSE-100 Index, was expected to serve as an appropriate Index for the new Segment of Futures & Options (F&O). S&P CNX Nifty is now a well diversified 50 stock Index accounting for 23 sectors of the Indian economy with an aggregate MC of around Rs.60,965.18 billion (as on 31st March 2012) from Rs.1,700 billion in 1996. The S&P CNX Nifty’s aggregate MC was around Rs.16, 320.58 (as on 31st March 2012). It is used for a variety of purposes such as benchmarking fund portfolios, index based derivatives and index funds.
4. Literature Review
- Many studies have been conducted on Indian stock market regarding investments. Most of these studies studied the impact of the FIIs on Indian stock market in terms of return and volatility and came out with diverse views. Prior literature had also investigated implications of portfolio theory on trading volume. However, less attention was given to determine the relation of FIIs investments with other microeconomic variables, such as, market capitalisation, total trading volume/value and P/E Ratio of stock market, etc.Mazumdar (2004: 5-20) found that FIIs flows have enhanced liquidity in Indian stock market. Kumar (2006: 43-49) found a positive relation between FIIs investments with both market capitalisation and total trading value. However, Tripathy (2007: 60-68) found no significant relation between FIIs with market capitalisation. A number of empirical studies had documented a positive correlation between trading volume and absolute price changes (Gallant and Tauchen 1994: 199-242; Karpoff 1987: 109-126; Schwert 1989: 1115-1155). J (1993: 249-282) and Llorente and Wang (2002: 1005-1047) analyzed the dynamic relation between volume and returns in the cross-section. However, the scope of all these studies were limited as time period was too short (generally three to five years’ monthly data were taken) and the number of variables used for the analysis purpose was also less.Khan and Ikram (2010: 373-379) observed that there is a relation between the movement of BSE and NSE with the FIIs. The study concluded that the FII’s investment has significant impact on Indian capital market. Kumar (2001: 36-44) found that there is causality from FIIs to SENSEX. This is in contradiction to Rai and Bhanumurthy’s (2004: 479-493) results using similar data but for a larger period. A study by Panda (2005: 53-61) also showed that the FIIs investments do not affect SENSEX. No clear causality was found between the FIIs and S&P CNX Nifty. FIIs are found to follow positive feedback strategy and to have return clustering tendency.FII flows have been routinely depicted as a major driver of Indian stock market returns in the financial press. All the existing studies have found that equity return has a significant and positive impact on the FIIs (Agarwal 1997: 217-229; Chakrabarti 2001: 34-44; Trivedi and Nair 2003). But given the huge volume of investments, foreign investors could play the role of market makers and book their profits, i.e., they could buy financial assets when the prices are declining, thereby jacking-up the asset prices and sell when the asset prices are increasing (Gordon and Gupta 2003). Hence, there is a possibility of a bidirectional relationship between the FIIs and equity returns. However, research seems to suggest they are more of an effect than a cause of stock market performance (Chakrabarti 2001: 34-44; Mukherjee, Bose and Coondoo 2002: 54-83).In the Indian context too, studies prior to the present voluminous inflows have shown mixed results. Analyzing monthly data from May 1993 to December 1999, Chakrabarti (2001: 34-44) found that FII net inflows were more likely the effect than the cause of equity market returns, with the FIIs not having informational disadvantages compared to DIIs. Exploring the relationship between January 1999 and May 2002, Mukherjee, Bose and Coondoo (2002: 54-83) found that FIIs activities has a strong demonstration effect and was driving the domestic market suggesting that the FII flows tend to be caused by return in the domestic market. Griffin, Nardari and Stulz (2004: 641-657) also found that foreign flows are significant predictors of stock market returns for India, indicating that foreign investors are buying before market index increases. They also found that contemporaneous flows are positive and highly significant in India. Batra (2003), using both daily and monthly data tried to understand the trading behaviour of the FIIs and returns in Indian equity market. He found strong evidence of FIIs chasing trends and adopting positive feedback and herding investing strategies. Kumar (2001: 36-44) inferred that FII flows do not respond to short-term changes or technical position of the market rather they are more driven by fundamentals. Batra (2003) had not found FIIs having any destabilizing impact on the Indian equity market. All these studies have indicated the strong impact of the FIIs’ investment in Indian stock market based on fundamental analysis.Although many studies found different results about the FIIs flows into the Indian stock market, but their total trading volume (or value) in comparison to that of the DIIs have not been studied at all. Total trading volume in Cash Segments of the Indian stock market has also never looked into. This study has also undertaken two equity return-related variables, namely indices (i.e., of SENSEX and S&P CNX Nifty) return and respective P/E Ratio. So, for all these reasons this empirical study is of pioneering nature on the Indian stock market.
5. Objectives of the Study
- This present study has undertaken a very important question for the Indian stock market, i.e., what is the most influential factor in driving up the cash volume of the Indian stock market represented by the NSE and BSE. More specifically, the objectives of the present study are as follows:Ø To find out whether the NSE and BSE is developing in terms of market size and liquidity.Ø To find out the most critical determinant/driver of total trading value/volume (TV) in Cash Segment of NSE [i.e., NSETV] among FIIs total trading value (FIITV), DIIs total trading value (DIITV), S&P CNX Nifty’s returns (NR) and S&P CNX Nifty’s P/E Ratio (NPER) or a combination of some of the above factors.Ø To find out the most critical determinant/driver of TV in Cash Segment of BSE [i.e., BSETV] among FIITV, DIITV, SENSEX’s returns (SR) and SENSEX’s P/E Ratio (SPER) or a combination of some of the above factors. Ø To make a comparative evaluation of the above empirical results and comment on the most critical determinant in Cash Segments of the Indian stock market on an overall basis.
6. Data and Methodology
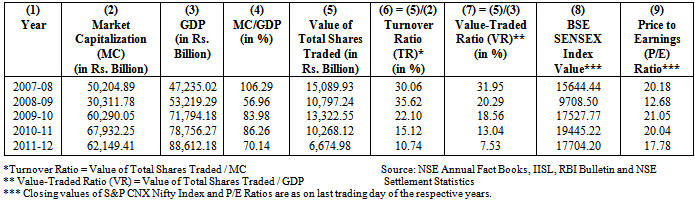
- This study has covered a time period of five years from April, 2007 to March, 2012 so as to find the development trend of the NSE and BSE (in some respects) in medium-term to eliminate the criticism of short-duration in some above mentioned empirical studies. Monthly data on NSETV, BSETV, FIITV, DIITV, NR, SR, NPER and SPER was collected under this study from different published sources, such as, SEBI Annual Reports, NSE Fact Books, India Index Services and Products Ltd. (IISL), BSE Statistics and RBI Bulletin to measure the dependency of TV of Cash Segments of the NSE and BSE on the critical driving factors - FIITV, DIITV, NR/SR and NPER/SPER. After such collection, to avoid any likely spurious results which are so common in case of this kind of time series data due to non-stationarity problems, this study has undertaken the Augmented Dickey-Fuller (ADF) tests (Dickey and Fuller, 1979: 427-481; 1981: 1057-1072).The method of estimation of the standard regression model is based on the assumption that the means and variances of these variables being tested are constant over the time. Variables whose means and variances change over time are known as non-stationary or unit root variables. Therefore, incorporating non-stationary or unit root variables in estimating the regression equations give misleading inferences. Instead, if variables are non-stationary, the estimation of long-run relationship between those variables should be based on the co-integration method. Since the testing of the unit roots of a series is a precondition to the existence of co-integration relationship, originally, the ADF (1979) test was widely used to test for stationarity. In statistics, the Dickey-Fuller (DF) Test tests whether a unit root is present in an autoregressive model. The extension of the DF Test is called the Augmented Dickey-Fuller Test (ADF), which removes all the structural effects (autocorrelation) in the time series, and then tests using the same procedure. The ADF Test statistic, used in the test, is a negative number. The more negative it is, the stronger the rejection of the hypothesis that there is a unit roots at some level of confidence. If the series is non-stationary and the first difference of the series is stationary, the series contains a unit root. In order to test for unit root through ADF tests, the following equation is used:
 In the above equation, this study has tested the null hypothesis of λ = 0 against the alternative hypothesis of λ < 0. So, the null hypothesis of non-stationarity would be rejected if λ is negative and significantly different from zero. Based on the ADF tests results [i.e., I(0) for all variables], the multiple regression equations have been formed with TV of NSE (Cash Segment) and TV of BSE (Cash Segment) as the outcome (i.e., dependent) variable and FIITV, DIITV, NR/SR and NPER/SPER as the predictors (i.e., independent variables). The output variable and predictors of this study (as stated above) is represented by the multiple regression equations as given below:
 | (1) |
 | (2) |
7. Findings and Results
7.1. Descriptive
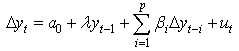
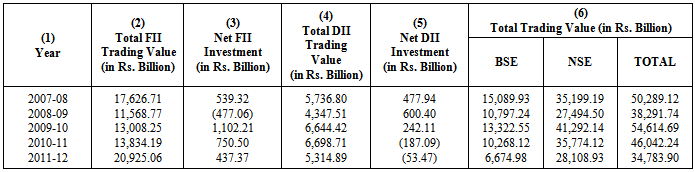
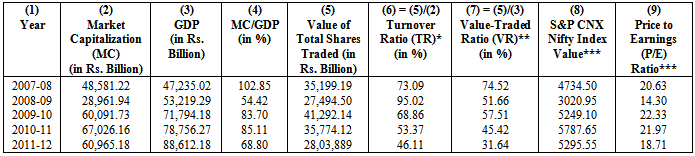
- The development and effectiveness of stock market is a complex and multifaceted concept. There are various indicators of judging stock market development and effectiveness. One commonly used measure is Value-Traded Ratio (VR), which is the value of total shares traded on a country’s stock exchanges (in this study, the NSE and BSE Cash Segments) as a percent of Gross Domestic Product (GDP). The second measure is the value of total shares traded as a percentage of market capitalization (MC). This Turnover Ratio (TR) measures the total trading value relative to the size of the stock market. The third indicator - Market-Capitalization Ratio (MR), is the market capitalization of listed shares in a stock exchange as a percentage of GDP, measures the size and expansion of the market. VR and TR are considered as the indicators of liquidity.Turnover/Trading value on stock exchanges reflects the transaction activities of the market players (buyers and sellers) in the stock market. The turnover figures demonstrate not only change in price of shares but also variation in volume/value traded. It is also a sign of size of market and liquidity. The level of trading volume is frequently used in the literature as a proxy for liquidity (Amihud and Mendelson 1986: 43-48; Chordia and Subrahmanyam 2001: 501-530). The liquidity allows investors to alter their portfolios and cheaply makes investment less risky. Thus, it is very significant in judging the efficiency and effectiveness of the stock markets. It has been observed (see Table 1) that FIITV leads to improvement or decline in TV of S&P CNX Nifty (i.e., Nifty-50) and BSE SENSEX and their market capitalization in the long-term and on a sustained basis as FIIs (and also DIIs) intend to invest on the basis of well-researched strategies and realistic fundamental stock valuation.FIIs have been contributing significantly in TV of the Indian stock market (especially NSE Cash Segment) in comparison to DIIs total trading value (DIITV) (see Table 1). It has also been observed from Table 1 that except 2008-09, in all other years the net FII investment was positive and generally in an up-move. But, the net DII investment has been showing a declining trend from 2009-10. It has also been observed that FIITV and DIITV have been contributing handsomely in TV of NSE and BSE Cash Segments. The institutional investors (both FIIs and DIIs) dependence on realistic fundamental stock valuation raises the question that whether the Price to Earnings (P/E) Ratio of S&P CNX Nifty and BSE SENSEX in any way have motivated them or otherwise to increase/decrease the net investment in the said Indices. Generally, P/E Ratio is the most common fundamental tool used by all investors and financial analysts to ascertain how expensive or how cheap a stock or market is.It has been observed combinedly from Table 1, Table 2A and Table 2B that whenever S&P CNX Nifty Index value or SENSEX value was low (i.e., cheap P/E Ratio), e.g., in 2008-09, the Nifty-50 Index value was 3020.95 (representing a P/E Ratio of 14.30) and SENSEX value was 9708.50 (representing a P/E Ratio of 12.68) - net FII investment was enhanced (especially in case of S&P CNX Nifty). It indicates enhanced liquidity and expansion of Indian stock markets’ size in terms of total trading value/volume which has a positive impact on GDP of India.
|
|
|
7.2. Empirical
7.2.1. ADF Tests Results
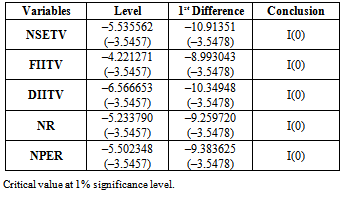
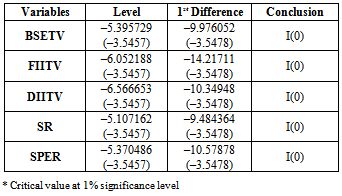
- In order to check the unit roots in the above data series, the ADF tests has been applied at levels and first difference. Table 3 has indicated the results of ADF tests, i.e., stationary level of all non-stationery variables with intercept and no trend. We know that, all non-stationary variables should have the same level of integrating order [i.e., I(0)] for multiple regression analysis. According to the empirical results, all variables of this study have that level.
|
|
7.2.2. Multiple Regression Results
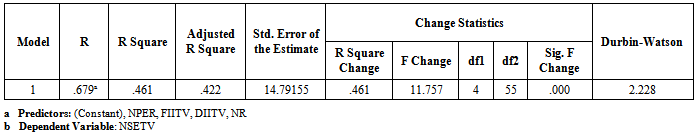
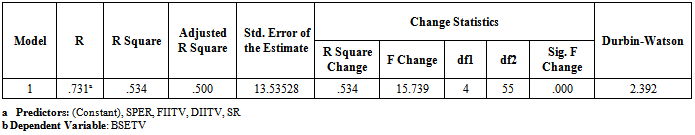
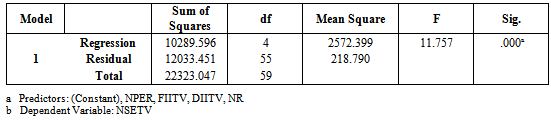
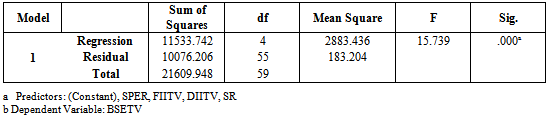
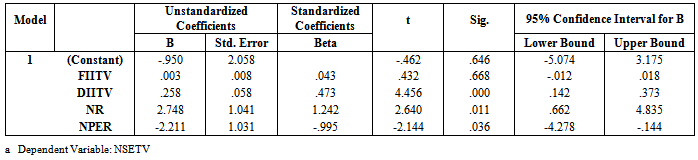
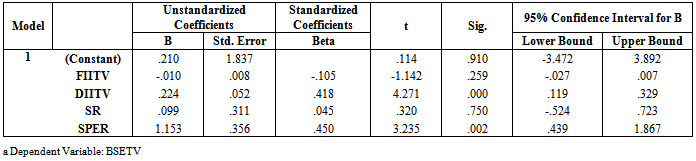
- The multiple regression equations as formed are (see the values in Table 7A and Table 7B):
 | (1.1) |
 | (2.1) |
|
|
|
|
|
|
|
|
|
|
8. Conclusions
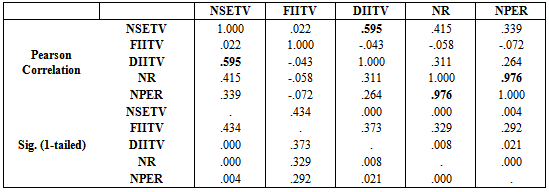
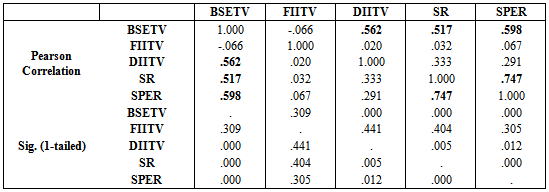
- This study has tried to find out the most critical determinant/driver of total trading value of the Indian stock market (represented by the NSE and BSE Cash Segments) out of many probable influencing factors. It has been a limitation of this study that many of such factors, such as, domestic interest rates, inflation rates, foreign exchange rates, natural and political factors, international factors, etc. have not been considered under this study. Initially (see Table 1), it has been observed that FIIs total trading value is much more significant than that of DIIs total trading value. However, the empirical results have proved that DIIs total trading value is a much more critical driver than FIIs total trading value in improving or decreasing total trading value of both NSE and BSE Cash Segments. Also, it has been found that in case of BSE and NSE Cash Segments, the P/E Ratio of S&P CNX Nifty Index (NPER) and BSE SENSEX Index (SPER) are also very critical in improving or decreasing the total trading value. So, a combination of DIIs total trading value and indices returns should be the ideal combination of drivers in driving up or pushing down the Indian stock market. This study has also proved that the FIIs are not taking the most critical role in the surge or decline of Indian stock market and its indices.Though in the existing relevant literature (as mentioned above) there has been mixed results in relating to FIIs total trading value with S&P CNX Nifty Index returns, but, this study has found that FIIs total trading value has very little correlation with S&P CNX Nifty Index returns (see Table 4A). S&P CNX Nifty Index returns have also no impact on total trading value of NSE Cash Segment as resulted in this study. Similar kind of results have also been found in between BSE SENSEX Index returns with that of FIIs total trading value.FIIs total trading value has also negative correlation with S&P CNX Nifty P/E Ratio (see Table 4A) and significantly low positive correlation with BSE SENSEX P/E Ratio (see Table 4B) and the empirical results have also pointed out that S&P CNX Nifty P/E Ratio has minor significance in the improvement or decline of total trading value of NSE Cash Segment. One of the limitations of this study is that all monthly data has been taken from Cash Segments of NSE and BSE. The NSE and BSE Debt Segment data and F&O data have been excluded from this study. Inclusion of those data could provide a more concrete result and a new dimension on the above subject in the future studies. Not only that, daily data could also provide more accurate and authentic results. Time and resource constraints also have made this study less exhaustive. Each of the above critical drivers could be studied separately in a detailed manner to measure their precise impact on the total trading value of NSE and BSE Cash Segments. The interrelationships between all these drivers could also be studied in-depth. Short and long-run relationships and interdependence with advanced statistical methods would be another domain the future researchers could look into.The future researchers would also be interested to investigate the probable causes of contradictory results of multicollinearity in regard to the NSE and BSE data sets. In conclusion, it could be pointed out that total trading value of Indian stock market’s Cash Segments which is an evidence of market liquidity and size has been significantly influenced by DIIs total trading value, BSE SENSEX and CNX Nifty P/E Ratio, etc. in that order.