-
Paper Information
- Paper Submission
-
Journal Information
- About This Journal
- Editorial Board
- Current Issue
- Archive
- Author Guidelines
- Contact Us
International Journal of Finance and Accounting
p-ISSN: 2168-4812 e-ISSN: 2168-4820
2014; 3(1): 37-48
doi:10.5923/j.ijfa.20140301.05
Forecasting Bank Failure in Nigeria: An Application of Enhanced Discriminant Model
 Abstract
 Reference
 Full-Text PDF
 Full-text HTML
P. O. Adeyeye1, J. A. Oloyede2
1Rufus Giwa Polytechnic, Owo, Ondo State, Nigeria
2Ekiti State University, Ado-Ekiti, Nigeria
Correspondence to: P. O. Adeyeye, Rufus Giwa Polytechnic, Owo, Ondo State, Nigeria.
| Email: |  |
Copyright © 2012 Scientific & Academic Publishing. All Rights Reserved.
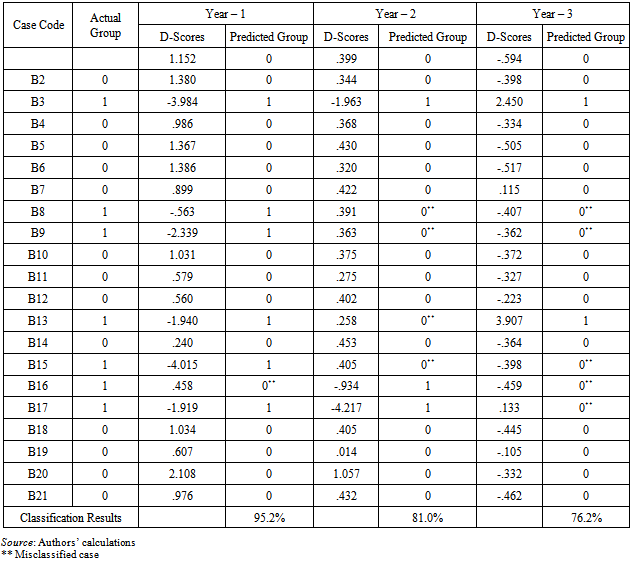
This study provides a test of early warning model using an enhanced linear discriminant model to forecast the rate of bank failure in Nigeria. The study combines principal component analysis (CPA) with discriminant analysis (DA) to carry out the estimation. The data set of the analysis contains 11 bank-specific variables of 21 banks out of the 24 banks operating as deposit money banks in Nigeria between 2007 and 2009, a period during which some of the banks were nationalised and some others engaged in merger and acquisition and their identities became subsumed in their respective preferred investors. The empirical analysis reveals that the warning signal so developed produces a robust result yielding overall classification accuracy of 95.2 per cent. The discriminant model can correctly predict the financial status of about 20 banks out of 21 sampled banks respectively. In fact, the model accurately predicted the status of 6 banks out of 7 failed banks included in the model. Even the one not correctly predicted was appropriately identified as misclassified. The implication of this is that discriminant analysis is a good predictor of a bank’s failure and employing the model will enable an early detection of problems that could engender remedial actions to prevent a bank from failing. This is a very promising result as it indicates its invaluable usefulness for regulators in assessing the health status of banks of interest.
Keywords: Bank failure, Discriminant model, Factor analysis, Principal component analysis, Early warning signal
Cite this paper: P. O. Adeyeye, J. A. Oloyede, Forecasting Bank Failure in Nigeria: An Application of Enhanced Discriminant Model, International Journal of Finance and Accounting , Vol. 3 No. 1, 2014, pp. 37-48. doi: 10.5923/j.ijfa.20140301.05.
Article Outline
1. Introduction
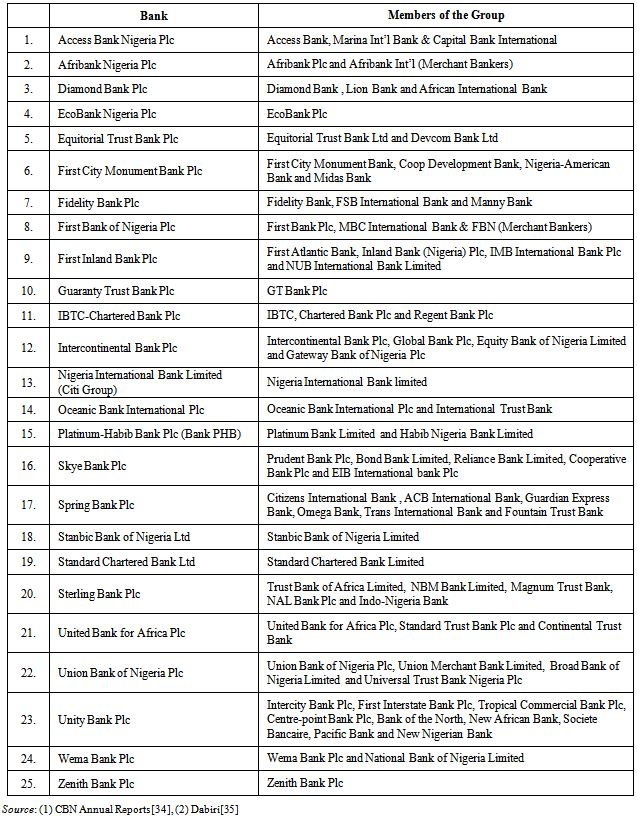
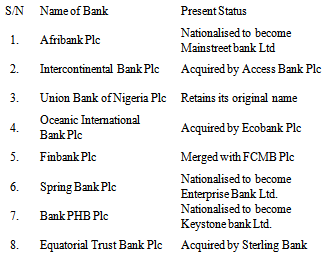
- A critical examination of the Nigerian economy in the recent past reveals that there has been a dramatic change in the banking environment from the time Structural Adjustment Programme (SAP) was introduced in 1986 till the present time than any other sector of the economy. Since the commencement of the deregulation, there was tremendous growth in the number of banks operating in the country as a result of the increased ease of entry into the field of banking under deregulation. This brought radical changes especially as ownership and control of financial institutions are concerned (Bello[1]). However, according to Sobodu and Akiode sighted in CBN[2], the banking environment that emerged from the reform was inefficient, riskier, illiquid and generated lower return on assets relative to the pre-reform period. Besides, banking institutions were been subjected to one squeeze or the other by the introduction of some measures to sanitize their operations which adversely affected some of them. The adoption of such measures like prudential guidelines, statement of accounting standards and the use of stabilization securities to mop up excess liquidity in the system, though sometimes imperative, exposed many weak banks and threatened them with insolvency. Some banks which had earlier posted fat profits started to mop up excess liquidity which also pushed some marginal banks to illiquidity. In extreme cases of illiquidity, there was near panic as some of the banks were unable to meet depositors’ demand. Consequently, the banks embarked upon distress borrowing in the interbank market at exorbitant rates (Imala[3], CBN [2]).According to Adeyeye, Fajembola, Olopete and Adedeji [4], all the foregoing combined to create a challenging and precarious financial environment as the financial conditions of many banks worsened significantly, which compelled the authorities to take decisive steps to resolve public confidence in the financial system and ensure efficient payments system. Indeed, between 1991 and 2004, the banking system witnessed series of systemic distress occasioned by the sudden increase in the number of banks, their sizes and the noticeable weakness in their operations as well as the poor state of the Nigerian economy, which resulted in liquidation of many banks. During the period, the number of banks classified as distressed were about 52. Specifically, the CBN revoked the licenses of 31 banks: 4 in 1994, 1 in 1995 and 26 in 1996 (CBN[5], NDIC[6], NDIC[7], Sanusi[8], Toby[9]). Mindful of the deteriorating condition of the industry, the CBN decided to streamline the regulatory framework and strengthen its supervisory capacity in order to forestall the re-emergence of systemic distress and facilitate the attainment of strong, competitive and reliable financial markets that meet international best practices. To this end, according to Adeyeye[10], the CBN took some decisive actions aiming at successful consolidation of the banking industry in Nigeria. The emerging consolidation initiative of the CBN with its attendant mergers and acquisition unprecedented in the history of Nigerian banking system ended up reducing the number of banks from 89 to 25 banks (see Appendix A1). Furthermore, by October 2009, another set of 8 out of the surviving 24 banks (see Appendix A3) had their respective chief executives and executive directors sacked for what the CBN called “undue exposure to toxic assets, general weakness in risk management and corporate governance”, which definitely are signs of systemic failure of the banks concerned (CBN[11]). While three of them were completely liquidated and their assets and liabilities taken over by the CBN and ultimately transferred to other new outfits as ‘bridge banks’, five others engaged in merger and acquisition syndrome whereby their identities were subsumed in their respective preferred investors. For instance, the nationalised Spring Bank Plc had its name changed to Enterprise Bank Ltd, Bank PHB Plc became Keystone Bank Ltd while Afribank Plc became Mainstreet Bank Ltd. On the other hand, Intercontinental Bank Plc was taken over by Access Bank, Oceanic Bank Plc was taken over by Ecobank Bank Plc, Equitorial Trust Bank Plc was acquired by Sterling Bank while Finbank Plc was merged with FCMB Plc (CBN[11], Adeyeye, Ayorinde and Ajinaja [12], Adeyeye[10]).The foregoing is no doubt a gory picture of a system that is expected to be significantly germane to the economic development of a nation. It can then be clearly seen why the banks are highly regulated and supervised by the regulatory authorities in order to minimize the risks and costs of bank failure and equally ensure a safe and sound banking system. It is against this background that this study seeks to use a combination of factor analysis and linear discriminant framework to test the probability of bank failure in Nigeria.
1.1. Motivation for the Study
- Prediction of bank failure is important to financial regulators including the Central Bank of Nigeria (CBN) and National Deposit Insurance Corporation (NDIC). The collapse and failure of a bank could have devastating consequences on the entire banking system and a widespread repercussion on the whole economy at large. Very often, bank failures do not occur spontaneously but are usually due to prolonged period of financial distress. Hence, it is desirable to have an early warning system that identifies potential failing or high-risk banks going through financial distress.Furthermore, as noted above, 8 of the existing 24 banks operating as money deposit banks in Nigeria were sanctioned in one way or the other due to the triple problem of huge concentrations in their exposure to certain sectors of the economy, a general weakness in risk management and poor corporate governance (CBN[11]). This development generated mixed reactions from the general public. Hence, this study seeks to adopt a veritable hybrid early warning model that is capable of predicting the level of performance of a bank with a view to using it to empirically justify (or debunk) the 2009 decision of CBN. According to Adeyeye[10], the potential advantages of such an early warning model include, but not limited to, the following:(i) The early warning model could contribute significantly to strengthening the process of on-going banking supervision by the regulatory authorities, and that supervisors are likely to work towards refining the systems further in order to improve their accuracy and predictive power. (ii) It could definitely assist regulators/supervisory authorities to best achieve their mandate as timely identification of problem banks and appropriate intervention may result in fewer bank failures, smaller losses to depositors and less disruption to the payment mechanism.(iii) It could assist in making various government macroeconomic policies to be better focused to achieve desirable results through the banking system.(iv) It could equally constitute a basis for critical self-assessment by banks so that they could take remedial action in good time to arrest the problem.
1.2. Research Question
- Following the above discussion, the following research questions require further investigation, which will form the basis for this study.(i) What is the impact of bank-specific attributes on the probability that a bank would fail or survive?(ii) To what extent do economic factors impact on a bank’s probability of failure?
1.3. Objectives and Hypothesis of the Study
- The primary purpose of this study is to use an enhanced discriminant model to test, given publicly available financial data, the probability of bank failure in Nigeria. In achieving this objective, we intend to:(i) examine the impact of both economic factors and peculiar bank characteristics on the probability that a bank would fail or survive.(ii) adapt and modify the existing discriminant model to classify the financial status of banks in Nigeria.(iii) use the predictive ability of the model to forecast the possibility of bank failure in Nigeria.In the light of the foregoing set objectives, it is hereby hypothesised that:H0: The probability that a bank would fail or survive is not significantly dependent on some bank-specific characteristics and economic factors.
2. Empirical Literature
- Numerous empirical studies have been published in an attempt to measure bank performance and hence predict the probability of its failure. For instance, Altman[13] used multiple discriminant analysis (MDA) technique to estimate a bankruptcy prediction model. The MDA is a statistical technique used to classify a categorical dependent variable having more than two categories, and using it as predictors for a number of independent variables. Beaver[14] used the MDA to construct a predictive algorithm based on five key financial ratios. These include: working capital to total assets, retained earnings to total assets, earnings before interest and taxes to total assets, market value equity to book value of total debt and sales to total assets. He further used these ratios to calculate Z-score, which formed one of the first statistical off-site models for predicting bankruptcies. However, according to Vilen[15], the Z-score model has been disputed greatly. For example, Boritz[16] found as many as 65 different financial ratios used as predictors in bankruptcy studies. Moreover, while Hamer[17] argued that ratios selected for the analysis do not have notable effect on the model’s ability to predict failure, Karels and Prakash[18] suggested quite opposite, encouraging researchers to carefully select the financial ratios to include to the model, in order to improve prediction accuracy. Furthermore, Hol, Sjur and Nico[19] criticised the Z-score model for “searching” for right variables to establish the model. They also argued that in the absence of a strong conceptual model scarce bankruptcy information was statistically “used up” by searching procedures.Among the statistical techniques analysing and predicting bank failures, discriminant analysis (DA) was the leading technique for many years (Karels and Prakash[18], Haslem, Scheraga and Bedingfield[20]. There are three sub-categories of DA: linear, multivariate, and quadratic. One drawback of DA is that it requires a normal distribution of regressors. When regressors are not normally distributed, maximum likelihood methods, such as Logit, can be used (Martin[21]; Ohlson[22], Kolari, Glennon, Shin and Caputo[23] and Demyanyk[24]. DA is a tool for analysing cross-sectional data. If one needs to analyse time series data on bank firm, or loan defaults, hazard or duration analysis models can be used instead of DA models (Cole and Gunther [25], Lane, Looney and Wansley[26] and Molina[27]). Blums[28] developed a D-score model using forward selection process in a relaxed Gambler’s ruin and Merton model context. It took advantage of the most recent financial data for middle market publicly traded firms and used multi-year observations per firm. But, he opined that comparison between the results of various previous researchers is fruitless.Tam and Kiang[29] compared the power of linear discriminant analysis (LDA), Logit, K-nearest neighbour, interactive dichotomizer 3(ID3) feed forward neural network on bank failure prediction problems. They find that DA outperforms the others for a two-years-prior training sample.
3. Model Specification
- This study adapts the linear discriminant analysis (LDA) method used in a recent study by Adeyeye et al[4]. Linear discriminant analysis is a conventional method for discriminant feature extraction. The main idea is to find a feature transformation which maximises the covariance of feature metrics between classes, while minimising the covariance of feature metrics within each class (Gao, Ding and Wu[30], Xu and Wang[31]). In the discriminant analysis it is considered that any bank a is characterized by a vector of elements that are measurements of the independent variables (11 in this study). For two populations (failed and non-failed banks) it is assumed that the independent variables are distributed within each group according to multivariate normal distribution with different means but equal dispersion matrices.The objective of this method is to obtain the linear combination of the independent variables that maximizes the variances between the populations relative to within-group variance. Technically, the use of the discrimination function corresponds to the way that the regression line is used in regression analysis, the only difference lying in the fact that the discriminant line helps in the estimation of whether the dependent variable possesses one or another non-metric characteristic (i.e. failed banks taking on the value of 1 and non-failed banks taking on the value of 0 in our present study). Hence, the discriminant function is hereby specified:
 | (1) |
 = intercept
 = coefficient vectors of parameters to be estimated, j = 1, 2, 3, ..., k µi = error term For the discriminant model, the classification of the banks under study into the failed or non-failed group is based on the optimum cut-off score (C), which is calculated as stated in Equation (2) below.
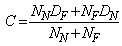 | (2) |
3.1. Estimation Technique
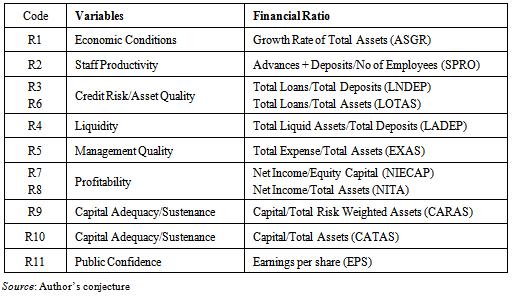
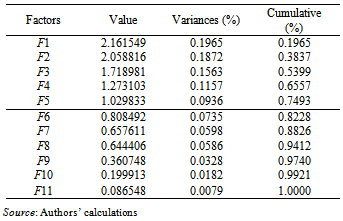
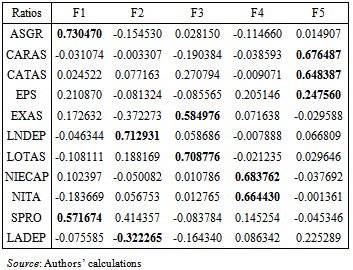
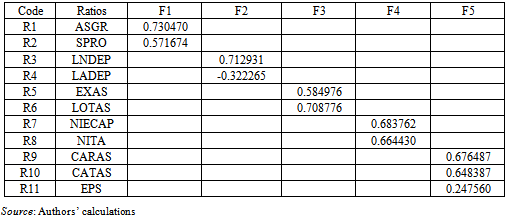
- The objective of our analysis is not only prediction but also reliable estimation of the parameters in which case serious multicollinearity could pose a problem because it is capable of generating large standard errors of the estimators. To solve the problem, we employed factor analysis. Specifically, to run the factor analysis, we used principal component analysis (PCA) method.The PCA helps us to explore and understand the underlying patterns of relationship between the financial ratios used in the study, while the purpose of factor analysis is to categorise variables (financial ratios) into subgroups sharing common characteristics. By applying the PCA to the financial data, the important financial factors (5 in the present study), which can significantly explain the changes in financial conditions of the banks, were determined. Factor scores were estimated for each of the bank with respect to the five factors determined and these scores were used as independent variables in estimating the discriminant model. The five factors extracted are: factor F1 represents economic conditions and productivity; factor F2 represents credit risk and liquidity structure; factor F3 represents management competence and asset quality, while factor F4 represents productivity structure and factor F5 represents capital adequacy and earnings structure respectively.The other objective of the PCA is to calculate factor scores for each of the banks according to the five factors determined. In PCA, all financial ratios are standardized, with a mean of 0 and the standard deviation of 1 according to Equation (3):
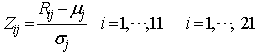 | (3) |
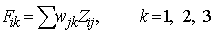 | (4) |
3.2. Data Sources
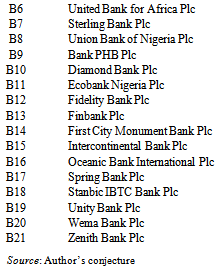
- The sample set of the study covers the periods 2007, 2008 and 2009 respectively and contains financial ratios of 21 banks (see Appendix A3) out of the total 24 that were operating as Money Deposit Banks (MDBs) in Nigeria during the period. The reason is not far-fetched. One, Societe Generale Bank, which is one of the 25 surviving banks after the consolidation exercise is yet to start full banking operation even up till now. Two, the data for the remaining three banks (i.e. Equitorial Trust Bank Plc, Nigerian International Bank Ltd. and Standard Chartered Bank Ltd were not included in the study because there were too many omitted variables in their available data. All the 21 banks under review are listed on the Nigerian Stock Exchange (NSE). 11 financial ratios for both the failed and non-failed banks were computed using data collected from annual financial reports of individual banks. For reliability and consistency, the data were compared with the ones contained in the NSE’s Factbook.
4. Empirical Results
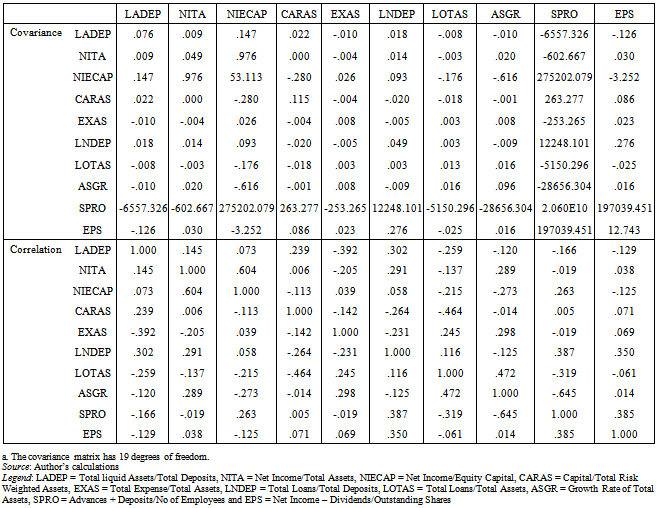
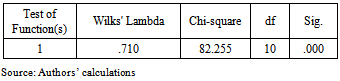
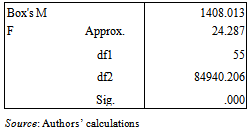
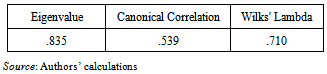
- Some of the diagnostic tests conducted include the means and standard deviations of the financial ratios for the two groups (failed and non-failed banks), significance tests for the equality of group means for each ratio and F statistics and their observed significance levels. Of the parameters for the 11 variables, only 3 are significant at 5% level and 1 is significant at 10% level while the remaining 7 are insignificant. In other words, the significant level is relatively small for only four of the eleven ratios under consideration, namely: capital-to-total risk-weighted assets (CARAS), total loans-to-total deposits (LNDEP), total loans-to-total assets (LOTAS), and earnings per share (EPS) respectively. Hence, the null hypothesis that two group means are equal is rejected at 5% significant level for these ratios.The other test statistics calculated in Table 1 is Wilk’s Lamda (λ) which is the ratio of the within-groups sum of squares to the total sum of squares.
|
|
|
|
4.1. The Discriminant Model
- As earlier stated, the objective of this method is to obtain the linear combination of the independent variables that maximizes the variances between the populations relative to within-group variance. Table A5 in Appendix A shows both pooled within-groups correlations between discriminating variables and standardized canonical discriminating functions. The linear combination of the factors scores provide for each bank a discriminant score (D-score), according to the estimated canonical discriminant model shown in the following equation:
 | (5) |
|
|
|
5. Summary and Conclusions
- In this study we coupled principal component analysis with D-score model to predict the probability of bank failure in Nigeria. Our empirical analysis reveals that this combination produces a robust result with high prediction accuracy. This is a very promising result as it indicates its invaluable usefulness for regulators in assessing the health status of banks of interest.All variables identified in the study have the expected signs. Twenty per cent of the significant predictive variables measure the credit risk of the banks under study. This makes sense as credit risk is by far the most significant source of risk in the banking industry. Another forty per cent of the variables measures profitability of the banks. This may not be unconnected with the fact that unprofitable banks have higher risk of running into financial difficulties. Furthermore, twenty per cent of the important explanatory variables measure bank characteristics related to capital adequacy. Most interestingly, variables for management quality and other bank characteristics like economic conditions and staff productivity are potentially not important predictors of financial problems for the entire population of banks but might make a difference for the group of banks that are facing difficulties. Banks with effective and efficient management quality have a higher probability of surviving periods of financial crisis.The analysis of the D-score model so far indicates that the measures of profitability, liquidity, credit risk and capital adequacy are the key predictive financial ratios. In other words, differences in profitability, liquidity, credit risk (asset quality) and capital adequacy (sustenance) are found to be the major distinguishing characteristics between the non-failed and failed banks.
6. Suggestions for Further Studies
- Applying the research methodology employed in this study to a more comprehensive data set that actually enables the estimation of default prediction models for operational banks could potentially reveal additional insights into the processes that force financial distress of banks.Also, the research methodology used in this study may equally apply to other financial and non-financial sectors of the economy.