-
Paper Information
- Next Paper
- Previous Paper
- Paper Submission
-
Journal Information
- About This Journal
- Editorial Board
- Current Issue
- Archive
- Author Guidelines
- Contact Us
International Journal of Finance and Accounting
p-ISSN: 2168-4812 e-ISSN: 2168-4820
2013; 2(8): 465-471
doi:10.5923/j.ijfa.20130208.10
Corporate Governacne and Pay-Performance Sensitivity
 Abstract
 Reference
 Full-Text PDF
 Full-text HTML
Subba Reddy Yarram
UNE Business School, University of New England
Correspondence to: Subba Reddy Yarram, UNE Business School, University of New England.
| Email: |  |
Copyright © 2012 Scientific & Academic Publishing. All Rights Reserved.
The present study focuses on the performance sensitivity of CEO wealth for a sample of Australian firms for the period 2005 to 2011. For a sample of 2153 non-financial firm-years, the study analyses the influences of economic determinants, governance and ownership factors on the performance sensitivity of CEO wealth for the pre-GFC, post-GFC sub-periods. Employing pooled OLS and panel random effects (RE) regressions, the study finds that firm size, performance and growth opportunities have a significant positive influence on the performance sensitivity of CEO wealth. Board size, CEO duality, average director tenure and board interlocking have a negative significant influence on the performance sensitivity of CEO wealth while CEO tenure and managerial ownership have a significant positive influence.
Keywords: Corporate Governance, Ownership Structure, Executive Pay, Global Financial Crisis, Australia
Cite this paper: Subba Reddy Yarram, Corporate Governacne and Pay-Performance Sensitivity, International Journal of Finance and Accounting , Vol. 2 No. 8, 2013, pp. 465-471. doi: 10.5923/j.ijfa.20130208.10.
Article Outline
1. Introduction
- Executive pay levels are a focus of the popular press, politicians and general public each year as the corporate firms release their annual financial reports and disclosure information on the executive pay and perquisites. According to Jensen and Murphy[1], popular debate instead of focusing on pay performance relationship is overwhelmingly concentrated on excessive pay levels. Jensen and Murphy in their original article 23 years ago pointed out the nature of (chief executive officer) CEO pay as that of bureaucrats. CEO pay and wealth has largely been unrelated to performance and the compensation systems are immune to the concerns of shareholders with regard to performance. Subsequent research focused on the role of CEO pay in resolving the conflicts of interests between managers and shareholders. Optimal contracting theory contends that executive incentives are designed based on skills set of managers and the size and complexity of corporate firms as market for managerial labour is competitive. Chalmers et, al[2] find evidence of optimal contracting theory for Australian firms in relation to setting fixed salary and award of shares. The second approach is the managerial power approach which suggests that CEOs play a larger role in setting their own pay levels as they often appoint and cultivate boards that do not question the authority of CEOs. Murphy[3] in his 2013 book chapter suggests that both of these approaches are relevant in explaining executive compensation. Most of the earlier studies confine to the US and other OECD economies. Matolcsy and Wright[4] find that there are significant differences in the compensation contracts of CEOs in Australia and the US. Prior research in Australia is focused mainly on CEO pay levels and the influence of economic and governance variables on cross-sectional variance of CEO pay with the exception of a few studies such as Merhebi et al. [5] and Izan et, al[6]. Starting 2004, corporate firms in Australia are mandated to provide additional disclosures relating to executive pay. In addition, corporate firms in Australia are also expected to adhere to the Principles of Good Corporate Governance and Best Practice Recommendations issued by the ASX. Unlike the earlier studies, the present study focuses on CEO wealth rather than CEO pay as increasingly CEOs and other executives either own shares or awarded shares or options based on their performance. The present study therefore focuses on the performance sensitivity of CEO wealth for the period 2005 to 2011. Matolcsy[7] and Rankin[8] finds that the economic downturns have an impact on executive pay in Australia. Given the Global Financial Crisis (GFC) in 2008, this study examines if governance and ownership factors have a varying impact on performance sensitivity of CEO pay before and after the GFC. The rest of the paper is organized as follows. In Section 2, a brief review of literature relating to executive compensation is provided along with hypothesis development, followed by the description of the sample in Section 3. Section 4 explains the methodological approach and presents results relating to empirical analysis. Finally, Section 5 concludes the study.
2. Development of Hypotheses
- Prior literature identifies four major economic determinants of CEO pay[9]. These include size and complexity of operations, growth and investment opportunities, performance and risks faced by the firm. Matolcsy and Wright[10] highlight the importance of economic determinants in optimal compensation contracts. Large firms with growing revenues and expanding operations require CEOs with the right skills and energy. Growing firms that undertake new investments may require that the CEOs have adaptable skills. Large and growing firms place more demands on CEO time and skills and therefore other things beings similar, may pay higher compensation. Importance of firm size in performance sensitivity is highlighted by Cichello[11] and Lee[12]. Performance considerations also require that CEOs are skilful in navigating their businesses not only in favourable business conditions, but also when the tide turns or when faced with rough seas. Performance and risk are therefore likely to influence the compensation paid to CEOs. Agency theory contends that to align the interests of shareholders and managers, appropriate incentive structures need to be designed. The economic determinants of CEO pay are also likely to influence the performance sensitivity of CEO wealth. It is therefore hypothesized that size has a positive influence on the performance sensitivity of CEO wealth. Similarly, growth opportunities are hypothesized to have a positive influence on the performance sensitivity of CEO wealth. Performance is also hypothesized to have a positive influence on the sensitivity of CEO wealth. Risk measures on the other hand may have a positive or negative influence on the performance sensitivity of CEO wealth when the risk-averseness of CEOs is factored-in in addition to the risks borne by companies. Aggarwal and Samwick[13] show that risk has a significant bearing on the pay-performance sensitivity while Cichello[11] shows that when controlled for size the effects of risk on pay performance sensitivities are low. Apart from economic determinants governance and ownership factors may also influence the CEO pay levels as well as the performance sensitivity of CEO wealth. Board size, independence, CEO duality, board interlocking, average tenure of directors, CEO tenure and turnover, structure and activity of remuneration committee are relevant board factors that are likely to influence performance sensitivity of CEO wealth. Similarly, managerial ownership and ownership held by substantial shareholders may also influence performance sensitivity of CEO wealth. Larger boards often represent conflicting interests and may lead to loss of cohesion thus exerting a negative influence on the performance sensitivity of CEO wealth. It is therefore hypothesized that board size has a negative influence on the performance sensitivity of CEO wealth. Board independence on the other hand, may have a positive or negative influence on the performance sensitivity of CEO wealth. Outside directors who may or may not have the required skills, knowledge as well as motivation are likely to have less influence on the design of incentives[14]. CEOs who also assume the role of a chairperson, may act to protect their interests and therefore CEO duality is hypothesised to have a negative influence on the performance sensitivity of CEO wealth. Less sensitivity of CEO wealth is an indication of entrenchment of the CEO. Longer tenures of directors may help directors gain the necessary experience and knowledge relating to the business sector while at the same time, may create social ties with the CEO and hence may denote a weak governance scenario. Interlocked boards may again help directors gain exposure to workings of different businesses or sectors may also create opportunities for close contacts with CEOs. It is therefore hypothesized that boards that are characterized by longer tenures of board members and interlocked directorships have a negative influence on performance sensitivity of CEO wealth. Remuneration committee structure and activity may have a positive influence on the performance sensitivity of CEO wealth, if these committees are effective. However, often remuneration committees are filled with outside directors and often set incentives based on the recommendations of remuneration consultants who are in turn appointed at the behest of the CEO. Taking all factors into account remuneration committee activity and structure may or may not influence the performance sensitivity of CEO wealth. CEO tenure and turnover may also influence the performance sensitivity of CEO wealth. CEOs with longer service have a reputation to protect as well as acquire more share ownership over a period of time. It is therefore hypothesized that CEO tenure and turnover have a positive influence on performance sensitivity of CEO wealth. Ownership structure is likely to influence the performance sensitivity of CEO pay. Increased managerial ownership may lead to better alignment of interests of shareholders and managers and therefore it is hypothesized that managerial ownership has a positive influence on the performance sensitivity of CEO wealth. Similarly, substantial shareholders may act to discipline the actions of managers and therefore it is hypothesised that substantial shareholding has a positive influence on the performance sensitivity of CEO wealth.
3. Sample Description
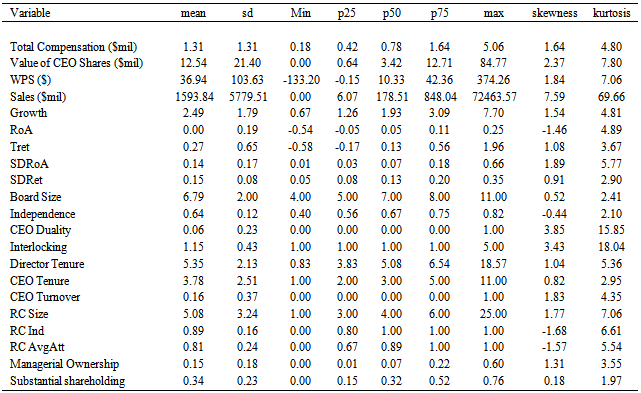
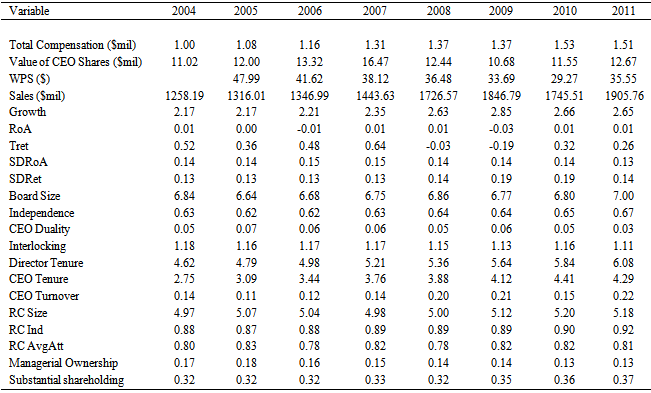
- The initial sample consists of all constituents of All Ordinaries Index at the end of 2011. All non-financial firms are excluded from the study as these firms are highly regulated. Firms with missing data on remuneration or information relating to other variables employed in the study are excluded from the study. Remuneration information is collected from the Corporate Governance module of the Sirca. Financial information is collected from Datastream databse. The study period comprises of 2005 to 2011 with information on sales and other lagged variables are included from 2004. The period of 2005 to 2011 is chosen as this period represents a distinct corporate governance and remuneration framework in Australia. ASX Principles of Good Corporate Governance and Best Practice Recommendations were adopted in 2004 and the Corporate Law Economic Reform Program (Audit Reform and Corporate Disclosure) Act 2004 (CLERP 9) was adopted from 2004. Consequent to CLERP 9, disclosures relating to executive remuneration have improved in Australia. This period also represents a change in financial reporting with the adoption of Australian International Financial Reporting Standards (A-IFRS) in 2004. The final sample consists of 2153 firm-years for the period 2004 to 2011. Sample firms are represented in all non-financial sectors with 34 per cent of firm-years from basic materials, 21 per cent from consumer cyclical and non-cyclical sectors, 15 per cent from energy, 16 per cent of firm-years from industrials and the remaining from healthcare, technology, telecommunication services and utilities.
|
|
4. Empirical Analysis and Findings
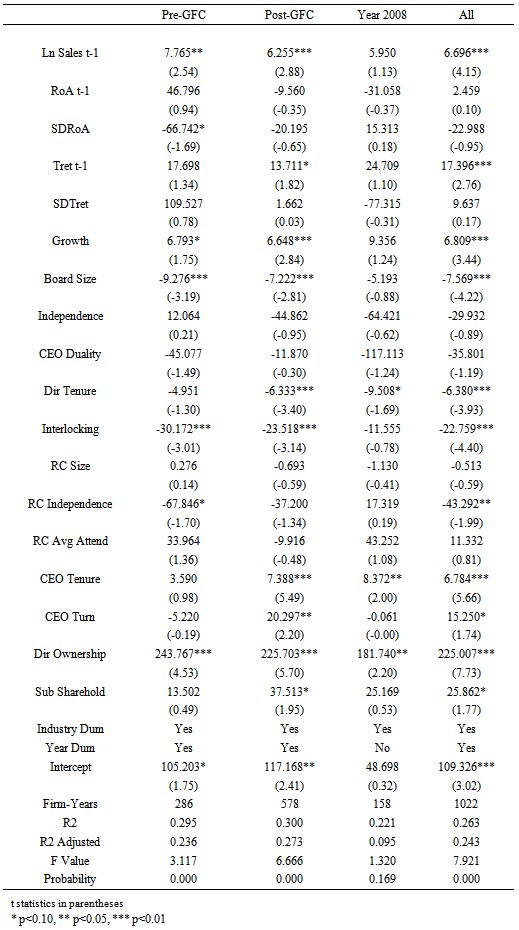
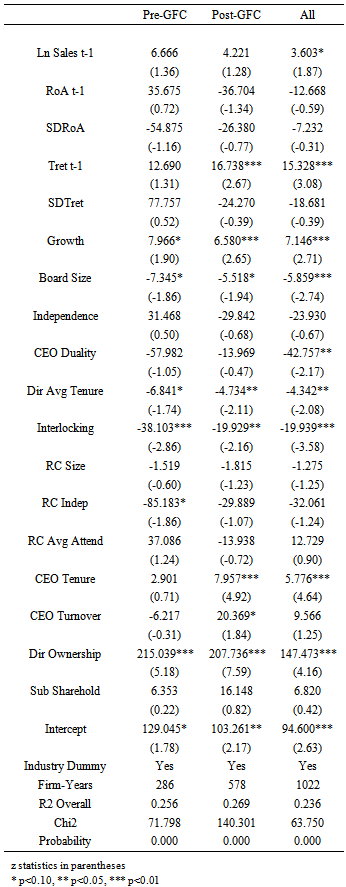
- The empirical analysis is undertaken in two stages. In the first stage, pooled ordinary least squares (OLS) regressions are employed with WPS as a dependent variable and a set of economic determinants and governance variables as independent variables. OLS analysis suffers from several shortcomings such as unobserved heterogeneity, endogeneity and simultaneity. To incorporate unobserved, heterogeneity, the present study considers panel data methods. Based on Hausman test, random effects (RE) panel methods are employed in the second stage. To account for the changes in macroeconomic environment, the study period is classified into 3 distinct sub-periods. The first period consists of 2005 to 2007 which is the pre-GFC period. The second sub-period is the post-GFC period of 2009 to 2011. For the purpose of comparisons, the present study also considers the year 2008 separately in the OLs regressions. Finally, influence of economic determinants, governance variables and control variables on WPS is examined for all years employing both OLS and RE regressions. Lagged sales revenue has a significant positive influence on CEO wealth performance sensitivity as shown in the OLS results and the RE results (Tables 3 and 4). This result is consistent with the findings of Cichello[11]. OLS results also show that lagged sales revenue has a positive influence in both pre and post GFC periods while it has no significant influence during the GFC. The overall effect of lagged sales revenue is confirmed in the RE results but its impact in each sub-period is not statistically significant. Lagged market-based performance measure has a significant positive influence on the WPS during the study period as shown in both OLS and RE results. However, performance has no significant influence in the pre-GFC period, while it has a significant positive influence in the post-GFC period. Accounting-based performance measure, on the other hand, has no significant influence on performance. This finding is consistent with Doucouliagos et, al[15]. While the risk measures predominantly show a negative influence on WPS, their impact is not statistically significant. Growth opportunities have a significant positive influence on the performance sensitivity of CEO wealth during the pre and post-GFC periods. This finding is consistent with Walker[16].Board size has a significant negative influence on the performance sensitivity of CEO wealth during the pre and post-GFC periods while it has no influence during the GFC. The negative influence of board size on performance sensitivity of CEO wealth indicates that governance and CEO compensation policies are substitutes rather than complements.
|
|
5. Conclusions
- Executive compensation continues to attract the attention of many all around the world. While the popular debate often focuses on levels of top executive compensation this study focuses on the performance sensitivity of CEO wealth for a sample of Australian firms for the period 2005 to 2011. For a sample of 2153 non-financial firm-years, the study analyses the influences of economic determinants, governance and ownership factors on the performance sensitivity of CEO wealth. Employing pooled OLS and panel random effects (RE) regressions, the study finds that firm size, performance and growth opportunities have a significant positive influence on the performance sensitivity of CEO wealth. Board size, CEO duality, average director tenure and board interlocking have a negative significant influence on the performance sensitivity of CEO wealth while CEO tenure and managerial ownership have a significant positive influence. These findings have implications for governance and compensation policies. Firms with weak governance structures fail to design incentive structures that link CEO wealth with performance. Longer tenure for CEOs as well as increased managerial ownership helps in aligning the interests of shareholders and managers.