-
Paper Information
- Previous Paper
- Paper Submission
-
Journal Information
- About This Journal
- Editorial Board
- Current Issue
- Archive
- Author Guidelines
- Contact Us
International Journal of Finance and Accounting
p-ISSN: 2168-4812 e-ISSN: 2168-4820
2013; 2(8): 428-438
doi:10.5923/j.ijfa.20130208.05
The Determinants of Capital Structure Choice: Evidence from Italian Family Firms
 Abstract
 Reference
 Full-Text PDF
 Full-text HTML
Oscar Domenichelli
Department of Management, Università Politecnica delle Marche, Piazzale R. Martelli, 8 – 60121 Ancona, Italy
Correspondence to: Oscar Domenichelli, Department of Management, Università Politecnica delle Marche, Piazzale R. Martelli, 8 – 60121 Ancona, Italy.
| Email: |  |
Copyright © 2012 Scientific & Academic Publishing. All Rights Reserved.
This paper analyses the financing choices of Italian family firms by employing a dynamic linear panel data model. The debt-to-equity ratio of Italian family firms is clearly influenced by its previous dynamics. Italian family-owned firms trade off the costs of financial distress against the tax benefits of debt financing. They also try to take advantage of their current profitability. Italian family firms may also accumulate earnings and may need to invest available cash in tangible fixed assets over time, while they use more debt when the ownership concentration is higher, as blockholders can more easily extract wealth from creditors. The empirical findings may also imply greater difficulties for women in accessing debt finance compared to men, even if the results are not robust. Furthermore, the explanatory variables, influencing the debt-to-equity ratio of Italian family firms in general, play a very similar role in the four categories of Italian family firms - small, large, manufacturing and services. However, the results for Italian family firms in general, and for those in the small and services categories in particular, appear to be more robust in terms of statistical tests, compared to those of the other two groups of enterprises.
Keywords: Capital Structure, Family Firms, Ownership Concentration, Asymmetric Information Costs, Gender Issue, Dynamic Panel Data
Cite this paper: Oscar Domenichelli, The Determinants of Capital Structure Choice: Evidence from Italian Family Firms, International Journal of Finance and Accounting , Vol. 2 No. 8, 2013, pp. 428-438. doi: 10.5923/j.ijfa.20130208.05.
Article Outline
1. Introduction
- The field of family businesses has been of academic interest since the late 1980s[1]. However, despite their worldwide importance in terms of number of enterprises, gross domestic product and employment1, the research on family firms has become relevant only recently (among others:[10, 11, 12, 13, 14, 15, 16]).If we look at the factors affecting the capital structure decisions2 of family firms, prior studies have shown evidence of the role played by the tax benefits and bankruptcy costs of debt[18], pecking order[19], agency costs of equity[20, 19] and debt[21], firm size[22] and gender differences[23, 24], as further discussed in paragraph 2. However, to the best of my knowledge, no empirical research has been carried out for Italian family firms by simultaneously addressing these specific issues and using a dynamic panel data model and thus, the aim of the paper is to improve understanding of the determinants of capital structure choice among Italian family firms. Specifically, the research questions concern the role and importance of the past dynamics of the capital structure, effective tax rate, non-debt tax shields, default risk, tangible fixed assets, profitability, firm age, ownership concentration, size, and female ownership in shaping the capital structure of Italian family-owned businesses.Hence, I assess direction and significance of the relationships existing among the lagged values over two periods of the debt-to-equity ratio, effective tax rate, non-debt tax shields, default risk, tangible fixed assets, profitability, firm age, ownership concentration, size, and female ownership representing the independent variables, and the debt-to-equity ratio representing the dependent variable. To this end, I examine a sample of 1,366 Italian family firms selected from AIDA - the Italian provider of Bureau Van Dijk European Databases - and analysed over the period from 2006 to 2010. I employ a dynamic linear panel data model through the use of the two-step generalized method of moments system estimator, developed by[25]. In the present study I firstly enhance the research on the capital structure of family firms by integrating different streams of literature, that is, trade-off, pecking order and agency conflicts, to verify the major determinants of leverage among Italian family firms. Secondly, I expand the discussion in order to include the role of gender in influencing the leverage of Italian family firms. Thirdly, I extend the basic models of econometric analysis through the application of a dynamic linear panel data model, which allows for the adjustment towards a target debt-to-equity ratio. Thus, the paper contributes to the debate on the financial choices of family firms.The remainder of this article is organized as follows. In the next section I provide a review of the relevant literature and some testable hypotheses. I discuss methodology and empirical results in section 3. Section 4 concludes my article with the main research, managerial and policy implications of my results.
2. Literature Review and Hypotheses
2.1. Tax, Bankruptcy Costs and Financial Risk
- In a context of perfect markets and perfect competition any modification of a firm’s capital structure does not change its value or its shareholders’ wealth[26]. However, when specific market imperfections, mainly taxes, bankruptcy costs, agency conflicts and asymmetric information are taken into account, capital structure does influence a firm’s value. As interest payments are deductible from corporate income, firms try to increase the level of debt to reduce company tax and enhance their value[27, 28]. Therefore, the first hypothesis is:H1 Effective tax rate is positively related to debt-to-equity ratio.As pointed out by[29], non-debt tax shields, such as accelerated depreciation or investment tax credits, further contribute to decreasing income tax[30]. As a result of this, non-debt tax shields diminish the benefits of raising debt, since non-debt tax shields play the same role as interest payments. The next hypothesis is:H2 Non-debt tax shields are negatively related to debt-to-equity ratio.There are also offsetting financial distress costs associated with indebtedness, both direct and indirect, which prevent firms from reaching excessive debt levels, as bankruptcy becomes more probable. Hence, according to the trade-off theory[31], there exists an optimal leverage which is the result of a trade-off between the tax benefits and the bankruptcy costs of debt. In particular,[18] document the fact that family firms strive to attain an optimal debt level by trading off tax benefits against costs of financial distress associated with debt financing. These costs are higher when a firm’s operating profit is more volatile, since the likelihood of its insolvency is greater[32]. Accordingly, if default risk increases, family firms find it more difficult to get debt financing. Thus the next hypothesis is:H3 Default risk is negatively related to debt-to-equity ratio.
2.2. Asymmetric Information Costs
- Asymmetric information costs are caused by the fact that borrowers own a greater amount of information than lenders do, with reference to the real value of existing assets or future opportunities of growth of their firms. Thus, the latter face an adverse selection problem[33], which may cause a loss of return and wealth invested in the firms they finance. Furthermore, because lenders often have no control over how the funds provided will be invested, they are also affected by a moral hazard problem. Consequently, lenders may compensate for the risk they bear by requiring guarantees[34], therefore a positive relationship is expected between availability of fixed tangible assets which are easy to collateralize or liquidate and leverage. A further hypothesis is:H4 Tangible fixed assets are positively related to debt-to-equity ratio.An alternative approach to asymmetric information costs is the pecking order theory, conceived by[35]. Specifically, [35] draws on the work of[36] on agency theory, of[37] on information asymmetry and of[38] on signalling theory. He argues that the capital structure of a firm depends on the need to avoid the disadvantages of the adverse selection problem between managers, acting in the interest of current shareholders (no agency costs of equity[36]), and potential investors that do not know the real value of either existing assets or new investing opportunities (asymmetric information). In fact, this problem of adverse selection may determine a wealth reduction for existing shareholders, through a decrease of stock prices when a new issue of shares is announced. Consequently, firms prefer internal funds, that is to say, retained profits, and when external finance is required, they will issue debt, then hybrid forms of securities, such as convertible bonds, and will ultimately issue equity. Therefore, the higher the profits are, the lower the need to obtain debt is, thus the next hypothesis is:H5 Profitability is negatively related to debt-to-equity ratio.Another reason why the capital structure decisions in family firms may follow a pecking order framework is that family members strongly wish to keep the control of their companies within their families[39, 40]. Hence, when external resources are needed to finance new investments, family businesses acquire debt and use equity as a last resort[19].
2.3. Agency Costs
- According to some researchers[41, 42, 43], family firms should not be affected by agency costs of (external) equity, as studied by[36], thanks to the negligible separation among the functions of property, control and management[44] and to their intra-familial altruistic linkages[45]. As pointed out by[20], the reason why the agency costs of equity are insignificant in family firms has to do with their three dominant propensities, that is: parsimony in the use the family’s personal wealth; personalism, deriving from the unification of ownership and control in the person of an owner–manager or family; and particularism, implying the use of both rational-calculative decision criteria and other “particularistic” criteria. Moreover,[19] introduce a dynamic view of the agency costs of equity in family businesses. In fact, they contend that, in first-generation family firms, agency costs are low for two main reasons. Firstly, there is coincidence between ownership and management, as both are normally in the hands of the founder and his nuclear family. Secondly, the relationships within a nuclear family are closed, strong and characterized by altruism and that enhances the firm’s value across successive generations. However, as the successors take their place in the business, agency costs tend to grow. In fact, a more dispersed ownership and management increase the conflicts of interest and information asymmetries between owners and managers. Moreover, these managers are often chosen from among family members, irrespective of their merits or abilities[46, 47]. They may draw excessive salaries and perks, shirk their duties and make risk-avoidant and opportunistic decisions which in turn, reduce the company’s value and hinder its survival. It is thus likely that older family enterprises employ more debt than younger ones to lower agency costs of equity[48], hence, an additional hypothesis is:H6 Firm age is positively related to debt-to-equity ratio.Agency conflicts of debt[36], especially in the form of conflicts between owners-managers and creditors, are deemed to be higher in smaller firms and thus, in the majority of family firms which are often small. On the one hand, the owner-manager of a small firm is likely to put his own and his venture’s interest first, especially in the most problematic early years, and, on the other, the level of asymmetric information is more significant when smaller businesses are considered, as they are not usually required to relinquish much information[49]. Accordingly, potential creditors try to compensate for the possibility of selfish behaviours of shareholders, including asset substitution, underinvestment and withdrawal of cash, by paying less for a firm’s debt and asking for higher interest rates, developing monitoring activities and requiring bonding activities[36] or simply by avoiding the offer of debt.[21] also contend that a blockholder may employ the same means used to expropriate minority shareholders, such as pyramidal structures and non-voting shares, to expropriate wealth from creditors. Moreover, agency costs of debt are likely to be significant when a family firm has a concentrated ownership. In fact, this allows a blockholder to more easily select a risk-oriented management compared to family firms with a diluted ownership, where single shareholders have less control over the appointment of managers who could be less disposed to undertake risky projects[50]. Thus, a concentrated ownership leads family firms to raise debt finance, as blockholders can extract considerable wealth from creditors. Hence the next hypothesis is:H7 Ownership concentration is positively related to debt-to-equity ratio.
2.4. Firm Size and Gender
- Size influences the typology of the financial mix of family firms. Firstly, smaller firms may find it relatively more expensive to solve informational asymmetries with creditors, as previously discussed, and this makes it difficult for smaller firms to acquire debt financing or low-cost debt financing. Consequently, they are not able or tend to avoid using external finance[32]. Furthermore, on the basis of the trade-off theory, bigger firms should reach higher debt levels as they bear lower costs of bankruptcy, since they can offer greater collateral and are less risky, being more diversified [51].[22] show that larger family businesses tend to be related to more financial institutions and employ differentiated financial products for their financing. The explanation is that when family firms grow they increase their investments which, evidently, have to be financed. In addition, most financial institutions tend to operate with firms reaching a significant size. The previous discussion highlights the fact that smaller family firms may encounter more problems in financing their growth, whereas once they have grown, they are able to attract more and less costly debt financing, since they are perceived as less risky. As a result, the next hypothesis is:H8 Firm size is positively related to debt-to-equity ratio.Some papers deal with the issue of gender differences in accessing financial resources. Compared to men, women may be more prudent, on the one hand, but on the other, women may be less self-confident as they may believe that they do not possess the required education to approach financial intermediaries[23].[52] also contend that women report stronger anxiety and fear than men do in anticipation of negative outcomes. All these reasons lead woman-owned businesses to rely less on debt finance.Another explanation for low debt use by female-owned firms is that they could be affected by supply-side discrimination. The assessment made by banks is different when they consider loan applications submitted by women, as banks favour men despite the fact that both male- and female-owned businesses are similar in terms of solvency and creditworthiness[24]. Consequently, women tend to either use their personal savings or borrow money from relatives (rather than banks) when they start their own business[53]. For this reason, I put forward the last hypothesis:H9 Female ownership is negatively related to debt-to- equity ratio.
3. Methodology and Empirical Results
3.1. Sample and Model Characteristics
- My research sample is composed of family firms. There is still no common widespread definition of a family firm in literature. The point is that what characterizes a family business is the significant impact of family in it, but the nature and extent of the family involvement are indeed variable[54]. Some authors use several definitions of family firms (for example,[9, 55]), while some others employ scales to typify family participation[56] or utilize family firm typologies[57]. Furthermore, according to some, a single definition of a family firm could even be ambiguous, as it would not be able to take into account the fundamental distinctions existing in various legal and institutional frameworks[20, 58]. As further described below, I apply the following definition of a family firm for the purpose of this work: a firm in which at least 50% of the equity, representing a significant proportion, is held jointly by persons or families and which has at least 50 employees. The adopted definition is similar to that of[18], who considered businesses with a shareholder (single or family) owning more than 50% and having between 50 and 250 employees.I drew all the sample data from AIDA, which is the Italian provider of Bureau Van Dijk European Databases and contains comprehensive financial and ownership information concerning Italian companies. The initial sample comprised all active Italian family companies included in the database with one or more named individuals or families owning together at least 50% of the equity and having at least 50 employees for all the years of the survey, which amounts to 4,470 firms. I chose family businesses of this size in order to obtain more reliable financial information and make the research easier to compare as most of the studies on family firms deal with relatively large companies[18]. This also allowed me to take into account the issue of size variability. However, to enter the final sample, useful data had to be available for all the variables, considered in the regression model presented below, for the period 2006-2010. In fact, as emphasised by[59], a dynamic model of estimation requires at least three consecutive annual observations and at least five consecutive observations for diagnostics to be robust. Therefore, at the end of the preliminary work, I excluded several companies from the initial sample because they showed data for a shorter period of time or negative debt-over-equity ratios or negative effective tax rates, so that the final sample includes 1,366 family firms. All the values of the variables are book values.I use the two-step generalized method of moments system estimator, developed by[25], to assess direction and significance of the relationships existing among debt-to-equity ratio representing the dependent variable, and its lagged values over two periods (to take into account the persistence degree of the debt-to-equity ratio), effective tax rate, non-debt tax shield, default risk, tangible fixed assets, profitability, firm age, ownership concentration, size and female ownership representing the explanatory variables, as specified below.The regression can be formulated by employing the following model:DTERi,t = β0 + β1DTERi,t-1 + β2DTERi,t-2 + β3ETRi,t + β4NDTSi,t + β5DRi,t + β6TFAi,t + β7PROFi,t + β8AGEi,t + β9OCi,t + β10SIi,t + β11FEMOi,t + εi,twhere:DTERi,t = debt-to-equity ratio: total debt over equity for firm i at time t;β0 = constant;DTERi,t-1 = lagged debt-to-equity ratio 1: lagged total debt over equity for firm i at time t-1;DTERi,t-2 = lagged debt-to-equity ratio 2: lagged total debt over equity for firm i at time t-2;ETRi,t = effective tax rate: tax paid over earnings before tax for firm i at time t;NDTSi,t = non-debt tax shields: depreciation and amortisation over total assets for firm i at time t;DRi,t = default risk: absolute deviation of percentage of operating income over total assets in each period t-1 (ROAt-1), t (ROAt) over absolute value of percentage of operating income over total assets at time t-1 (ROAt-1) for firm i, that is: (│ROAt-1 - ROAt│)/│ROAt-1│;TFAi,t = tangible fixed assets: tangible fixed assets over total assets for firm i at time t;PROFi,t = profitability: percentage of operating income over total assets for firm i at time t;AGEi,t = firm age: number of years since the foundation for firm i at time t;OCi,t = ownership concentration: percentage of shares held by the largest shareholder for firm i at time t;SIi,t = size: natural log of total assets for firm i at time t;FEMOi,t = female ownership for firm i at time t (dummy variable taking the value 1 if one or more women own more than 50% of shares, 0 otherwise), determined by considering the equity proportion held by persons with a female name;εi,t = the error term.As stressed by[60], panel data methodology blends the inter-individual differences and intra-individual dynamics, giving it several advantages over cross-sectional or time-series data methodology. Specifically, when it comes to the subject of capital structure, here expressed as debt-to-equity ratio, panel data methodology offers three major advantages over the cross-sectional one. Firstly, it can capture the unobservable individual effects of a unit (firm), which is assumed to be different for each unit (firm) and constant over time. Secondly, it enables the researcher to take into account the variability of the dependent variable (capital structure) and the explanatory variables of each unit (firm) over the period of time analysed and thus, produces better estimators than the ordinary least squares. Thirdly, it allows for the dynamic nature of a firm’s capital structure decisions. Nonetheless, the fixed or random effect models may give biased and inconsistent estimators, since the error term may be correlated with the lagged variable. To deal with this problem, instrumental variables can be adopted, providing the additional advantage of solving problems of static models, that is, the simultaneity bias between the measure of capital structure and the explanatory variables, and the measurement error issue[61].[59] cite[62] who propose employing an instrumental variables (IV) technique whose estimators, though, might not be efficient as it does not use all available moment conditions. Alternatively,[63] suggest employing the generalized method of moments specification of the first differences - by instrumenting the dependent variable and the predetermined variables with lagged levels, and instrumenting the strictly exogenous variables with differences - as this enables researchers to deal with endogeneity and simultaneity biases[64]. However, as noted by[59],[25] document the fact that the extended generalized method of moments system estimator of[65] gains significantly in efficiency when compared to the generalized method of moments specification of the first differences, for example when the empirical study is characterized by short sample periods and persistent data.Hence, I employ the generalized method of moments system estimator in this investigation, by using both instruments in first differences for equations in levels and instruments in levels for equations in first differences. In particular, I apply the two-step generalized method of moments system estimator as its estimates are deemed to be more efficient than those in the first-step method. Moreover, I consider a few statistical tests to ascertain the consistency of the two-step generalized method of moments system procedure. Firstly, I run the[63] test on autocorrelation to find out if the error term exhibits any serial correlation. Secondly, I use the[66] statistics to test the overall validity of the instruments. Finally, I conduct the Wald test for the joint significance of the estimated coefficients.
3.2. Descriptive Statistics
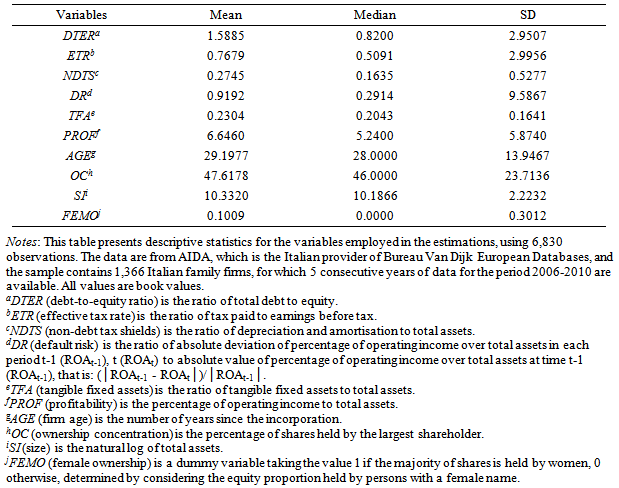
- I discuss below some interesting results shown in Table 1. On average, the debt-to-equity ratio is 1.5885 and this means that the sample firms have a significant debt dependence. The default risk, firm age and ownership concentration are characterized by the greatest variability (their standard deviations are greater than 9), while the standard deviations of the non-debt tax shield, tangible fixed assets and female ownership indicate a very small variability (their values are less than 1). The mean value of the effective tax rate is 0.7679 and this underlines the heavy weight of the tax burden borne, on average, by the firms surveyed. This result can be seen as quite surprising. Unlike the situation in other European countries, in Italy, however, a regional tax on productive activities is in force; it is the IRAP (Imposta regionale sulle attività produttive), which is calculated not on earnings before tax, but on the difference between operating revenues and costs before interest and labour costs, hence the IRAP is paid on these kinds of costs too. As a consequence, the IRAP is also payable in the event of a loss being reported and this justifies the high, mean effective tax rate. Furthermore, the considerable mean non-debt tax shield of the firms in the sample, which is 0.2745, indicates the relevance of depreciation and amortisation as non-debt tax shields. The significant variability of the default risk, that is 9.5867, denotes that the sample firms bear a very different risk of financial distress, while their tangible fixed assets are relatively low as the sample mean is 0.2304. The mean profitability is 6.6460%, whereas the mean age is quite high (greater than 29) and this is partly caused by the choice of a five-year period of analysis which obviously excludes the youngest enterprises. The ownership concentration is very significant, as its sample mean is 47.6178. This implies that the largest shareholders generally have strong power over manager appointment and firm policies. The standard deviation of the size is fairly low (around 2), meaning that there is not a high dimension variability of the firms observed. Moreover, this is not unexpected, as the vast majority of Italian (family) firms is represented by small- and medium-sized companies. Lastly, the mean female ownership, which is a dummy variable, is 0.1009.
|
3.3. Regression Analysis
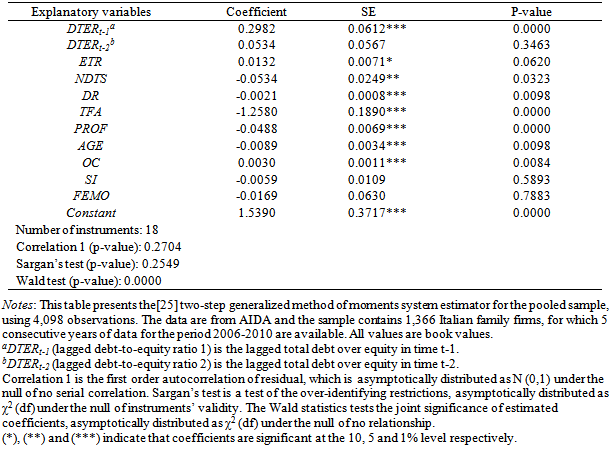
- The parameter estimates as well as some statistical tests are displayed in Table 2. The[63] test on autocorrelation supports the overall validity of the model, by providing evidence of the absence of first order correlation. Furthermore, the[66] test of the over-identifying restrictions confirms the validity of the instrumental variables being used, while the Wald test indicates the joint significance of the estimated coefficients.The positive coefficients of the lagged debt-to-equity ratio 1 and the lagged debt-to-equity ratio 2 show the importance of including these effects, as the debt-to-equity ratio depends considerably on its past dynamics. More precisely, the first lagged value of the dependent variable is the main explicative variable and the second one has a non negligible influence, even if only the coefficient of the lagged debt-to-equity ratio 1 is statistically significant (at level 0.01). The signs of the coefficients concerning the effective tax rate and the non-debt tax shields are as expected and the coefficients are significant (at 0.1 and 0.05, respectively). Therefore, the positive relationship between the effective tax rate and the debt-to-equity ratio implies an incentive for Italian family firms to use more debt to reduce company tax and increase firm value. Furthermore, the negative relationship between the non-debt tax shields and the debt-to-equity ratio consistently emphasizes a reduced need for debt when stronger non-debt tax shields are at work in Italian family firms. As hypothesized, the default risk is negatively related to the debt-to-equity ratio and this relationship is significant (at level 0.01). That supports the applicability of the trade-off theory to Italian family firms, since a growing default risk increases direct and indirect financial distress costs, thus preventing them from reaching high debt levels.The tangible fixed assets should be positively related to debt-to-equity ratio because, if tangible fixed assets, which are easy to collateralize or liquidate, are available, Italian family firms can easily increase their debt level, but the results show a negative and significant (at level 0.01) relationship. These findings can be interpreted based on the theory of financial slack[67], whereby Italian family firms with good development prospects, try to minimize debt capital to improve their flexibility in management decisions. Thus, they may invest available cash in tangible fixed assets over time so that a negative linkage between the tangible fixed assets and the debt-to-equity ratio may actually be found. Interestingly enough, this negative relationship is also by no means in contrast with the pecking order framework, according to which low asymmetric information, associated with tangible assets, could make equity issuances less costly. Consequently, leverage ratios should be lower when Italian family firms have higher tangible assets[68].The negative relationship between the profitability and the debt-to-equity ratio proves the validity of the hypothesis concerning the two variables. This is also significant (at level 0.01), thus clearly supporting the pecking order theory, since more profitable Italian family firms employ less debt because they can use higher amounts of internal funds.The regression results also show a negative relationship between the age and the debt-to-equity ratio, which is significant (at level 0.01). A contrary hypothesis is formulated though, as it is supposed that older Italian family enterprises employ, over time, a higher debt level to lower the agency costs of equity. Therefore, this negative relationship may instead mean a decreasing importance of debt in the maturity stage of Italian family firms, as they have eventually accumulated retained profits[69, 70]. This inverse relationship may also show a preference for internal over external finance, i.e. a financial behaviour based on the pecking order theory.The regression results concerning the ownership concentration and the debt-to-equity ratio supports the hypothesis involving the two variables, since a positive relationship between them is expected and this relationship is significant (at level 0.01). This means that a more concentrated ownership allows blockholders to more easily extract wealth from creditors, thus family firms with concentrated ownership have an incentive to use more debt. The results concerning the size of the firm do not support the assumption that it facilitates the acquisition of debt finance, as it is negatively related to the debt-to-equity ratio. These findings, however, are in line with those of[51, 71, 72, 73], who conclude that larger firms may have more accumulated internal finance than smaller ones and hence, may rely less on debt. Accordingly, this may also substantiate a hierarchical financial behaviour. However, the coefficient of the firm size is not statistically significant.As expected, female ownership is negatively related to the debt-to-equity ratio, even if the relationship is not significant. This can lead to the contention that women may be more risk-averse and less self-confident in raising debt capital compared to men[23]. Anxiety and fear in anticipation of a negative outcome[52] as well as banks’ tendency to finance female-owned businesses less often[24], could also play a crucial role in determining a negative relationship between the two variables analysed.
|
3.4. Tests of Robustness
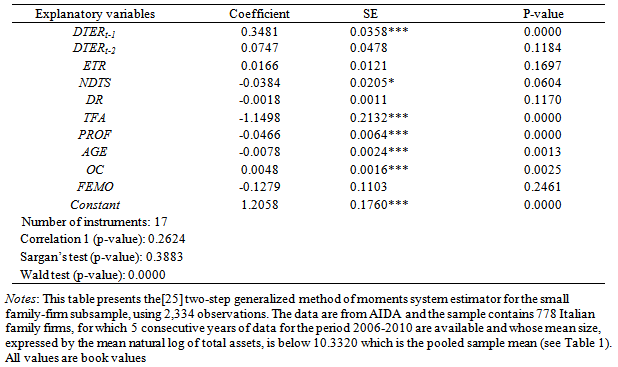
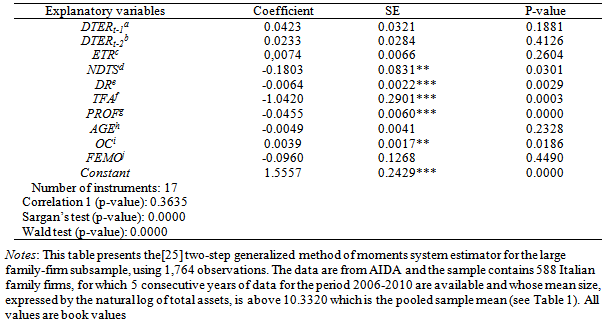
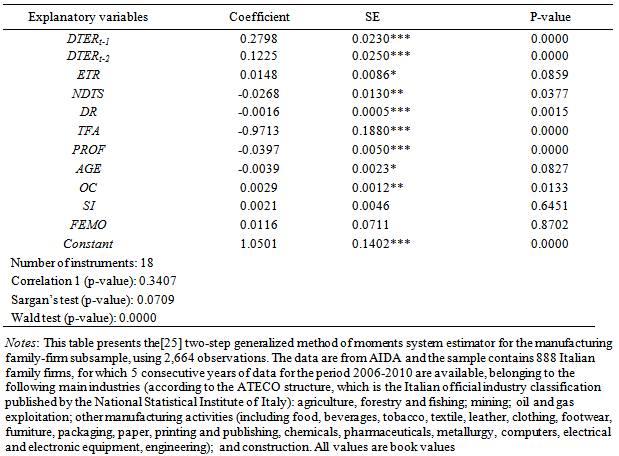
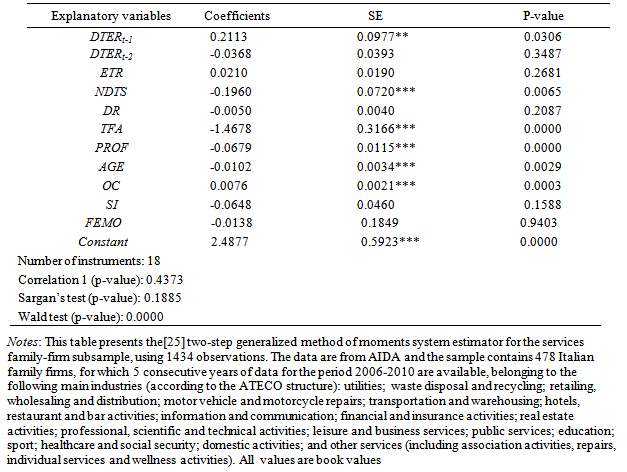
- I re-estimate the equation shown above, by splitting the pooled sample of Italian family firms according to the following two criteria: firm size and industry. The purpose of these tests of robustness is twofold. Firstly they ascertain the extent to which the results concerning Italian family firms as a whole can be generalised and thus applied to Italian family-owned enterprises of different sizes or belonging to different industries. Furthermore, they document the thesis that there are dissimilarities in the capital structure decisions of Italian family businesses displaying different characteristics. As far as the size criterion is concerned, I divide the Italian family firms surveyed into two groups - small and large firms, as specified in Tables 3 and 4 - and the results are presented in the same Tables 3 (small Italian family firms) and 4 (large Italian family firms). The analysis essentially confirms the signs and significance of the relationships, as well as the persistence effect concerning the debt-to-equity ratio, for both small and large Italian family firms. In fact, the only exceptions are the coefficients of the effective tax rate and the default risk which are not significant for small Italian family firms, and those of the lagged debt-to-equity ratio 1, the effective tax rate and the age which are not significant for large Italian family firms. Thus, essentially, the impact of the independent variables for Italian family firms in general is analogous for both small and large Italian family firms. Moreover, the tests conducted for the small firms, i.e., the[63] test on autocorrelation, the[66] test of the over-identifying restrictions and the Wald test for the joint significance of the estimated coefficients, indicate the overall validity of the two-step generalized method of moments system estimator being employed. Similarly, for the large firms there is a statistical absence of the first order autocorrelation of residual and joint significance of estimated coefficients. However, for this group of enterprises, the null hypothesis of the validity of all instruments is rejected, according to the[66] test.
|
|
|
|
4. Conclusions and Areas for Future Research
- The aim of this article is to provide further evidence on the debate concerning the financial choices of family-owned businesses, by examining the key empirical determinants of the capital structure of Italian family firms.A significant contribution of this work is that it integrates several approaches to capital structure, that is, the trade-off, pecking order, agency conflicts and gender-related issue, to emphasize the major determinants of the capital structure among Italian family firms. I also extend the discussion on the capital structure of family firms by employing a dynamic linear panel data model which allows for the adjustment towards a target debt ratio. In fact, financing decisions are dynamic by nature and imply the need for appropriate steps to reach an optimal leverage.Specifically, I assess direction and significance of the relationships existing among the lagged values over two periods of the debt-to-equity ratio, effective tax rate, non-debt tax shields, default risk, tangible fixed assets, profitability, firm age, ownership concentration, firm size and female ownership representing the independent variables, and the debt-to-equity ratio representing the dependent variable.The main findings show that the debt-to-equity ratio of Italian family firms is clearly influenced by its previous dynamics and thus by the earlier financial behaviour of these businesses. Furthermore, the empirical results concerning the firms surveyed indicate a long-term optimal debt level, towards which they converge, to trade off the costs of financial distress against the tax benefits associated with debt financing. In doing so, they also try to take advantage of their current profitability, thus probably and temporarily diverging form their long-term optimal debt level, in line with the results obtained by[74]. Moreover, the fact that Italian family firms may accumulate earnings (as stressed by[69, 70]) and may need to invest available cash over time (as pointed out by[67]) helps explain the negative and significant coefficients, respectively, of the firm’s age and its tangible fixed assets. Furthermore, I find that Italian family firms use more debt when the ownership concentration is higher, since blockholders can more easily extract wealth from creditors.I also document the thesis that there is an inverse, albeit not significant, relationship between the female ownership of Italian family-owned businesses and the debt-to-equity ratio. This may imply greater difficulties for women in accessing debt finance compared to men. The reason for this may be twofold. On the one hand, women may be more risk-averse and less confident when they raise debt capital[23]. On the other hand, women-owned family firms may be perceived to be riskier by banks, even if they do not differ from man-owned family firms in terms of solvency and creditworthiness[24]. Lastly, I find that the explanatory variables have very similar effects on the debt-to-equity ratio of Italian family firms in general as well as those small, large, manufacturing and services ones, specifically. Nonetheless, the results concerning family firms in general, small and services family firms in Italy appear to be more robust in terms of statistical tests.The major research, managerial and policy implications of my empirical analysis are the following. Firstly, family firms often reach a high level of leverage to fully exploit the debt tax shield[27, 28] and retain family control of the business[21]. At the same time, they have become riskier. Now this, in a situation of negative economic prospects and “credit crunch”, further explains the difficulties that family firms may experience in accessing bank credit to finance their restructuring or development projects. Thus, a culture change regarding family firms together with public incentives are required to stimulate the opening up of family businesses to equity investors not belonging to the family. Secondly, appropriate policy measures should reduce the tax burden borne by family firms to help them overcome the economic crisis that they have experienced and enhance their competitiveness in international markets. Lastly, since woman-owned family firms may be more credit constrained than man-owned ones are, banking institutions’ assessment should concentrate more on business projects and company quality so as to reduce gender differences. However, women should acquire more confidence in their own abilities and competences and hence, rely more on debt financing for the development of their family businesses.Finally, I believe that my article could stimulate future empirical analysis. For instance, research could try to shed light on how and to what extent country-specific factors determine and affect the leverage choice of family firms around the world. Moreover, other agency conflicts (between majority and minority shareholders) and gender differences (between managers and/or members of boards of directors) could be further investigated to assess their impact on the capital structure decisions of family-owned businesses.
ACKNOWLEDGMENTS
- I am grateful to the editor-in-chief Dr. Marco Giuliani and two anonymous referees for their helpful comments and suggestions which greatly improved the quality of the work. I also thank Prof. Alberto Manelli for having read several versions of the paper and Dr. Amedeo De Cesari for his precious observations. In addition, I am indebted to Prof. Riccardo Lucchetti who helped me structure the econometric model and Dr. Martina Vallesi who assisted me in collecting data. The usual disclaimer applies.
Notes
- 1. See for example:[2, 3, 4, 5, 6, 7, 8, 9].2. For a thorough analysis of the theories on capital structure based on agency costs, asymmetric information, product/input market interactions and corporate control considerations (except for tax-based theories), see the widely cited article of[17].