-
Paper Information
- Next Paper
- Previous Paper
- Paper Submission
-
Journal Information
- About This Journal
- Editorial Board
- Current Issue
- Archive
- Author Guidelines
- Contact Us
International Journal of Finance and Accounting
p-ISSN: 2168-4812 e-ISSN: 2168-4820
2013; 2(8): 417-421
doi:10.5923/j.ijfa.20130208.03
Calendar Anomalies in Treasury Bills Rate in Ghana
 Abstract
 Reference
 Full-Text PDF
 Full-text HTML
Luguterah Albert, Lugobayom Anuwoje Ida, Suleman Nasiru
Department of Statistics, University for Development Studies, Navrongo, Ghana, West Africa
Correspondence to: Lugobayom Anuwoje Ida, Department of Statistics, University for Development Studies, Navrongo, Ghana, West Africa.
| Email: |  |
Copyright © 2012 Scientific & Academic Publishing. All Rights Reserved.
A monthly effect has been reported in several financial market items such as the stock returns, inflation etc. in the Ghanaian economy but none has concentrated on studying calendar effect in the Treasury bill rate in Ghana. Our paper used regression on periodic dummies to investigate the existence of month-of-the-year effects in the Ghanaian Treasury bill rate and their significance by considering the 91-day and 182-day bills rate. The results revealed that there exists a pronounced month-of-the-year effects in both the 91-day and 182-day Treasury bills rate. It was also realized that, the month of July averagely had the highest rate within the period 1998 to 2012. However, the seasonal changes in Treasury bills rate were not a reflection of the effect of celebrative periods.
Keywords: Month-of-the-year, Calendar Effects, Significance Test, Treasury Bills
Cite this paper: Luguterah Albert, Lugobayom Anuwoje Ida, Suleman Nasiru, Calendar Anomalies in Treasury Bills Rate in Ghana, International Journal of Finance and Accounting , Vol. 2 No. 8, 2013, pp. 417-421. doi: 10.5923/j.ijfa.20130208.03.
Article Outline
1. Introduction
- The seasonal patterns in the behavior of prices of various securities have been researched for more than 75 years and have become a well documented phenomenon. These “calendar effects” are not only a subject for study by scientists, but can also be used by agents in the financial markets. Calendar effects can be described as an unusually high or low average return that depends on the date. They are anomalies in rates that relate to the calendar, such as the day-of-the-week, the month-of-the-year, or holidays, and well-known examples are the Monday effect and the January effect. The fact that these effects exist for such a long period of time is in itself an anomaly as according to the efficient market hypothesis all these effects should disappear once they are studied by researchers and explained to the traders. However, some recent studies show that these anomalies still exits[1], while other works[2] show that in the developed markets some of these effects are disappearing or losing power.A comprehensive study of day-of-the-week effect in financial futures on US Treasury securities is documented in the research by[3]. Their work analyses various securities; GNMA (bonds of Government National Mortgage Association), T-bonds, T-notes and Treasury bills futures. Two calendar effects were found for GNMA, T-bonds and T-note contracts, while Treasury bills (the paper with the smallest duration) exhibits no seasonal patterns. Similar to well-known Monday effect in stock returns, GNMA and T-bonds contracts follow negative Monday effect before the year 1982. At the same time, the evidence for positive Tuesday effect after the year 1984 for GNMA, T-note and T-bond contracts was found. These effects were concentrated in February and May respectively, bringing into evidence, a certain “delivery cycle” which affects not only the maturing issues but also other similar papers trading. In the eighties and nineties there was a burst of studies aimed at comparing the calendar effects on these markets[3, 4, 5].In Ghana, studies on calendar effects on financial market variables, includes work done by[6]. They studied the monthly effect on the volume of currency in circulation in Ghana. Their findings revealed that, there is a “New Year effect” in the volume of Currency in Circulation as the first three months of the year clearly indicates a decrease in the volume of Currency in Circulation. There are few works among the literature researching financial markets of the emerging countries, of which Ghana is not an exception. Also most of the existing works in this sphere deal with US bond market, leaving broad space for analysis of developing countries. In our study, we considered one possible calendar effect, which is the month-of-the-year effect. In contrast to the numerous studies on equity market, much less effort has been dedicated in Ghana to investigating calendar anomalies on the Treasury bill rate. Just by comparing volumes of the financial markets one can clearly see that Treasury bills are vital for every financial system. A study of the behavior of Treasury bills rates will give the opportunity to compare its calendar patterns with other items such as bonds, stocks etc. in the financial market and therefore helps in understanding the relationship among these phenomena. It will also give, investors in Treasury bills, an idea as to the best month(s) of investments for a better yield and, to the Bank of Ghana, to be in control of the rates for the various months. The main goal of this paper is to investigate the existence of the month-of-the year calendar effect on the Ghanaian Treasury bill rate. Although it is quite plausible that these effects and additional effects might have been analyzed in other countries or in unpublished studies, our choice to study the calendar effects on Ghana’s Treasury bill rate, which is most likely novel, will serve as a benchmark for additional relevant studies.
2. Issues Concerning Ghana’s Treasury Bills Market
- Before the establishment of the Ghana Stock Exchange (GSE), securities such as the Treasury bills and Bank of Ghana bills issued by Bank of Ghana were being traded in Ghana. In Ghana, T-bills are issued to finance government deficits. The Bank of Ghana sells T-Bills to mop up excess liquidity and buys Bank of Ghana Bills to inject liquidity in the system[7]. The securities that are currently being issued by the Government of Ghana are: the 91-day T-bill, 182-day T-bill, 1 year note, 2 year fixed rate bond, 3 year fixed rate bond, 2 year floating rate bond (interest rate spreads over 91-day T-bill), 3 year floating rate bond (interest rate spreads over 182-day T-bill) and 3 year Government of Ghana Index-Linked Bond, an instrument whose interest is linked with the rate of inflation.According to the State of Ghana’s economy (2008), the market share of the 91-day instrument tripled from 6.62% in 2007 to 18.6% of the securities market in 2008. The share of 182-day T-bill instrument also approximately increased threefold. Meanwhile the market shares of 1-year, 2-year, 3-year notes and 5-year Government of Ghana bond recorded a decline in shares. Also, the 5-year government bond fell from 7.25% to 5.9% in 2008. The long term stocks also fell in their market share by 5 percentage points: However the yield on the long term securities is higher than the short term securities. In the state of Ghana’s report (2008), it was also identified that changes in inflation had an impact on the Treasury bill rates. For instance, in 2002, when inflation fell, interest rates also declined accordingly compelling financial institutions and the public to invest in other sectors other than in government securities. Banks also responded by lowering their base rate to an average of about 35% from 50% at the beginning of 2002. Between November 2010 and January 2011, the 91-day T-bill rate declined from 12.32% to 12.15%; the 182-day T-bill also dropped from12.71% to 12.53%. The 1-year note and 2-year fixed rate also fell as well. The average inflation in 2000 for instance was 40.5% with the corresponding annual T-bill rate of 47.3%. When the average inflation rate reduced to 15.2% in 2002 and further to 10.9% in 2006, the corresponding T-bill rates also moved down from 23.68% to 9.41% during the same years. As yearly average inflation further rose to 18.1% in 2008, the T-bill had also increased to 14.87% accordingly.
3. Material and Methods of Analysis
3.1. Data Source
- This study used data on monthly Treasury bill interest rate from the database of the Bank of Ghana from the year 1998 to 2012.
3.2. Regression Analysis
- To investigate the effect of each month on the Treasury bill rate, a regression model was fitted using periodic dummies with autoregressive errors.The regression model is given by:
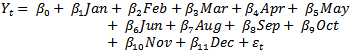 with
with  whereJan=January, Feb=February, Mar=March, Apr=April, May=May, Jun=June, Jul=July, Aug=August,Sep=September, Oct=October, Nov=November, Dec=December and
  is the autoregressive component. The month of July was used as a benchmark variable to avoid dummy variable trap.The regression coefficient of each month denoted by
 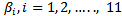 measures the incremental effect of each month. There exist seasonal effects when the coefficient of at least one dummy variable is statistically significant. A backwards elimination method was used to remove any insignificant autoregressive component in the model.
 3.3. Ljung Box Test
- The Ljung Box test was used to test jointly, whether or not the residuals of the regression model are free from serial correlations. The Ljung Box test is based on the assumption that several autocorrelations
 of the residuals of the regression model are zero.The Ljung Box statistic is given by:
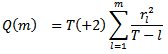 where
where  represents the residual autocorrelation at lagT is the number of residualsm is the number of time lags included in the testWe fail to reject
  and conclude at the 5% significance level that, there is no serial correlation when the p-value<0.05. When the p-value associated with the Q(m) statistics is large, the model is considered adequate else the whole estimation process has to start again in order to get the most adequate model.
4. Results and Discussion
4.1. Descriptive Statistics
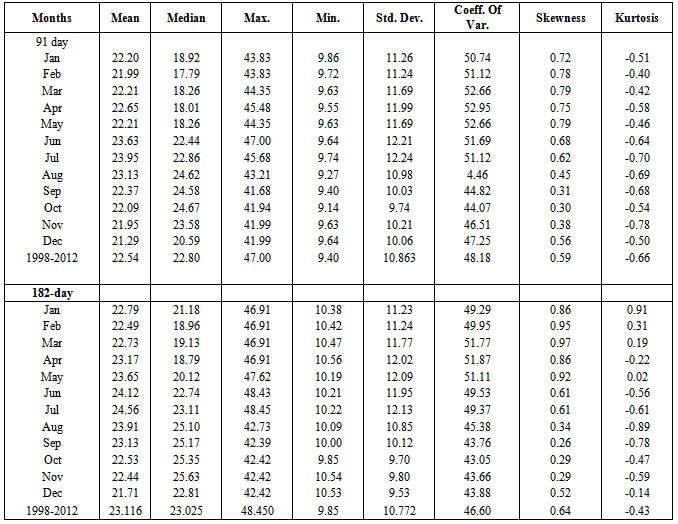
- Table 1 presents the descriptive statistics of each month for the entire period for the 91-day and 182-day Treasury bill rate. The maximum average rate occurred in the month of July for both rates and the minimum average rate occurred in the month of December for both rates. Also it was realized that, the rates for all the months of the 91-day and 182-day Treasury bills are positively skewed. This implies that majority of the rates cluster at the lower end of the distribution. For the 91-day Treasury bill rate, all the excess kurtosis are negative indicating that the rates are platykurtic in nature, which means the rates are widely distributed around the mean. But for the 182-day Treasury bill rate, the months of April, June, July, August, September, October, November, and December have platykurtic distribution whiles January, February, March and May are leptokurtic in nature. It was also seen that, for both interest rates, the month of April has the largest variability followed by March as shown by their coefficient of variations. Also, the 91-day interest rates series for the entire period showed a high dispersion than the 182-day Treasury rate. Again, it was realized that, both Treasury bill rates for the study period were platykurtic and positively skewed.
4.2. Test of Seasonality of the 91-day Treasury Bills Interest Rate Series
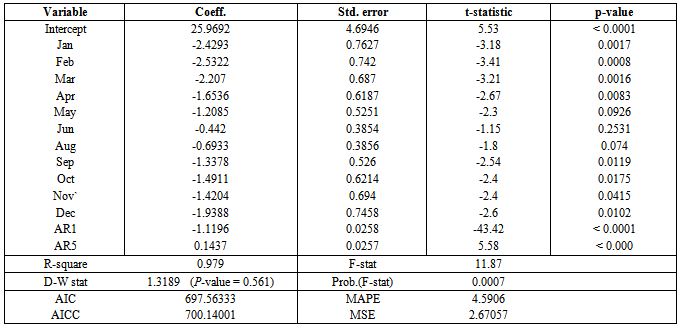
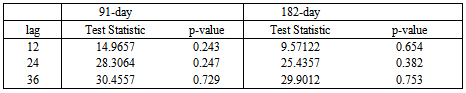
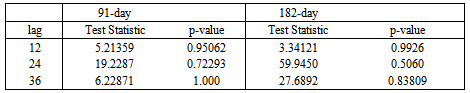
- To provide a better economic interpretation for the effects of each month on the 91-day Treasury bill interest rate, we regressed the series on a full set of periodic dummies. The month of July was used as a benchmark variable hence was not included in the model to avoid dummy variable trap. The results (Table 2) revealed that the regression model was significant with an F-statistic of 11.87 and p-value of 0.0007. This gives an indication that, there is a pronounced month of the year effect in the 91-day Treasury bill interest rate. This result contradicts findings by[3] who, using US Treasury securities showed that Treasury bills exhibited no seasonal patterns. An R-square value of 0.979 was also obtained, which showed that about 98% of the variation in the rates have been accounted for by the regression model. A Durbin-Watson statistic of 1.3189 with a p-value of 0.561 indicates that the model residuals were free from first order serial correlation. Also, the Durbin-Watson statistic of 1.3189 was greater than the R-square value of 0.979 indicating that the regression model fitted was not spurious. The results also showed that, the months of January, February, March, April, September, October, November and December were statistically significantly different from July at the 5% significance level, whiles May, June and August did not significantly differ in rates from the month of July. Also, the significant months have a negative coefficient estimate indicating negative seasonality; hence interest rates are generally lower for these months as compared to the month of July. Again, the estimated Ljung-Box statistic (Table 3) provides evidence that the residuals of the fitted model were uncorrelated, hence are white noise series, as the p-values of the test statistic at lags 12, 24, and 36 were all greater than 0.05. The ARCH-LM test statistic in table 4 was also insignificant at lags 12, 24 and 36 which shows that there is no ARCH effect in the model residuals hence the residuals have constant variance.
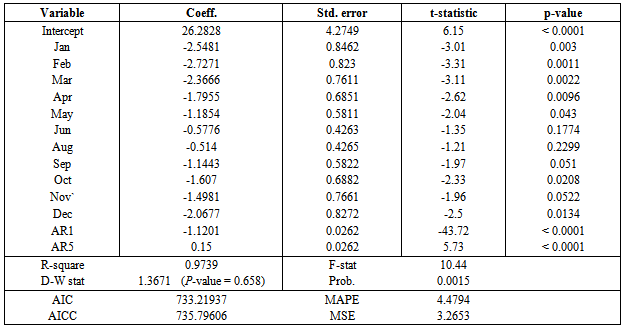
4.3. Test of Seasonality of the 182-day Treasury Bills Interest Rate Series
- In the 182-day Treasury bill rates, the month of July was also used as a benchmark variable. From table 5, it was realized that the regression model was significant with an F-statistic of 10.44 and a p-value of 0.0015, which also gives an indication of a month-of-the-year effect in the 182-day Treasury bill interest rate. Also, about 97% of the variability in the rates has been accounted for by the regression model as indicated by the R-square value. A Durbin-Watson statistic of 1.3671 with a p-value of 0.658 indicates that the model residuals were free from first order serial correlation. Also, the Durbin-Watson statistic of 1.3671 was greater than the R-square value of 0.9736 indicating that the regression model fitted was not spurious. The results in table 5 also showed that, the months of January, February, March, April, May, October and December were statistically significantly different from July at the 5% significance level whiles June, August, September and November are insignificant. The months of January, February, March, April, May, October, November and December have negative seasonality indicating lower interest rates when compared to the rates of July. Again, an insignificant Ljung-Box and ACRH-LM test at lags 12, 24 and 36 provides evidence that the residuals of the fitted model were not serially correlated and have a constant variance respectively. Therefore, the residuals are white noise and thus justifying the adequacy of the fitted model.
5. Conclusions
- In this study, we employed regression on periodic dummies to determine whether there exist a month-of-the-year effect on the 91-day and 182-day Treasury bills interest rates in Ghana. Our results revealed that, there exist a month-of-year effect on both the 91-day and 182-day Treasury bills interest rate. Apart from the months of May and September, both the 91-day and 182-day Treasury bills interest rates showed equivalent seasonal patterns. We realized, for the two Treasury bills, the month of July, averagely, had the highest interest rate. It was also seen that for both Treasury bills interest rates, June and August do not significantly differ in interest rates from that of July whiles the months of January, February, March, April, October, November and December generally have lower interest rates as compared to the month of July. While the interest rates for the month of May significantly differed from that of the month of July in the 182-day Treasury bills, these months did not differ in rates, for the 91-day Treasury bills. Similarly, while the average rates for the month of September did not significantly differ from the month of July in the 182-day Treasury bills rates, these months differed in rates in the 91-day Treasury bills. However, the findings revealed that most of the months in which there was a significant decrease in the interest rate were not months of festivities. It can therefore be inferred that the seasonal changes in Treasury bills rates is not a reflection of the effect of celebrative period. As a consequence of this study, investors may have opportunities to improve their returns by timing their investments.