Nageswari Perumal1, Murugesan Selvam1, Sankaran Venkateswar2
1Bharatidasan University, Tiruchirapalli, 620024, India
2Saint Mary’s College of California, 380 Moraga, 94556, CA
Correspondence to: Sankaran Venkateswar, Saint Mary’s College of California, 380 Moraga, 94556, CA.
| Email: |  |
Copyright © 2012 Scientific & Academic Publishing. All Rights Reserved.
Abstract
Calendar Anomalies in the stock market are those patterns that cannot be explained by traditional asset pricing models. Examples of such patterns include the January Effect, the Day-of-the-Week Effect, and the Week of the Month Effects. These anomalies allow investors to develop trading strategies to earn abnormal profits. Recent liberalization policies have led to significant capital flows from investors into India seeking to capitalize on promising and profitable business opportunities. The results of this study will be useful to such investors, traders, and arbitrageurs who can formulate profitable trading strategies to capitalize on calendar anomalies. The Securities and Exchange Board of India (SEBI) introduced the Compulsory Rolling Settlement System for stocks on January 02, 2002. This was expected to boost liquidity and thereby reduce the market risk of stocks to a considerable extent. The introduction of Rolling Settlement was also expected to lead to higher equity turnover and thereby potentially impact the anomalous behavior of stock prices. In this context, the study provides further evidence on the anomalous behavior of stocks in the Indian Stock Market during the Post Rolling Settlement Period from April 2002 to March 2010. The post rolling settlement testing period distinguishes this study from other contemporaneous studies on anomalous behavior of stocks in the Indian stock market that have overlapped both the pre and post rolling settlement period (7 & 16) and thereby provides a more robust basis for drawing conclusions.
Keywords:
BSE Sensex Index, Calendar Anomalies, Post Rolling Settlement Period, Weekday Effect, Month Effect, Holiday Effect
Cite this paper: Nageswari Perumal, Murugesan Selvam, Sankaran Venkateswar, Calendar Anomalies in BSE Sensex Index Returns in Post Rolling Settlement Period, International Journal of Finance and Accounting , Vol. 2 No. 8, 2013, pp. 406-416. doi: 10.5923/j.ijfa.20130208.02.
1. Introduction
Calendar Anomalies in the stock market are those patterns that cannot be explained by traditional asset pricing models. Examples of such patterns include the January Effect, the Day-of-the-Week Effect, and the Week of the Month Effects. Stock market anomalies allow investors to develop trading strategies to earn abnormal profits. Recent liberalization policies have led to significant capital flows into India seeking to capitalize on promising and profitable business opportunities. However, potential international investors are concerned with market efficiency, timing of investment, and market integration of the Indian stock market with other developed countries. The results of this study adds to the body of research that will be useful to domestic and foreign investors, traders, and arbitrageurs who can formulate profitable trading strategies to capitalize on any potential calendar anomalies.Studies on stock market anomalies in the Indian Stock Market are sparse[16]. Data availability has been a major constraint in conducting such studies in India. However, there have been a few recent studies documenting on some stock market anomalies in the Indian Stock Market. Chandra[7] confirmed turn-of-the-month and time-of-the month effect for the BSE Sensex index during the 1998-2007 time period. Patel[16] confirmed the months of November and December had the highest returns (month effect) during the 1999-2007 time period and the returns for the months for March-May were lower than the other nine months of the year. Bodla and Jindal[5] examined the month effect in the Indian stock market utilizing the S&P CNX Nifty Index for the period 1998-2005. However, they were unable to find any significant differences among individual monthsThe Securities and Exchange Board of India (SEBI) introduced the Compulsory Rolling Settlement System for stocks on January 02, 2002 and thereby also reduced the settlement period to T+3 days. Rolling Settlement is a mechanism whereby trading done on a stock exchange is settled in T+X days. T is defined as the Trade Day and, if "X" is 3, settlement will be done by the 3rd working day excluding the Trade day. Rolling Settlement was expected to boost liquidity and equity turnover and thereby reduce the market risk of stocks to a considerable extent. The introduction of Compulsory Rolling Settlement was also expected to lead to higher equity turnover and thereby potentially impact the anomalous behavior of stock prices[17]. In this context, this study provides further evidence on the anomalous behavior of stocks in the Indian Stock Market during the Post Compulsory Rolling Settlement Period from April 2002 to March 2010. The post compulsory rolling testing period distinguishes this study from other contemporaneous studies on anomalous behavior of stocks in the Indian stock market and thereby provides a more robust basis for drawing conclusions. The results of this study also contributes to the growing body of research on Indian stock markets that is necessary to attract long term capital inflows into India and propel the Indian economy to realize its full potential and seek its rightful place in the world economic order.The calendar anomalies that are the focus of this study include Day of the Week Effect, Month Effect, Semi-Month Effect, and the Holiday Effect. The most commonly studied day of the week effect is the Monday Effect, meaning that the Monday’s average returns are significantly lower than the other days’ average returns. January Effect is the most studied pattern of Month of the Year Effect. Many studies have found that stock returns in January are higher than that of other months of the year. The Semi-Month Effect postulates that the mean return for the first half of the month is higher than the second half of the month. Holiday Effect hypothesizes that stocks show abnormally high returns on days prior to holidays.The remainder of the paper is organized as follows. The next section discusses the methodology that includes development of the null hypotheses, sample selection, data sources, data variables, and the statistical models used for testing. We then discuss our empirical results and the concluding section summarizes the major findings of our paper.
2. Methodology
Hypothesis DevelopmentThe following Null Hypotheses are developed and tested in this study:NH1: There is no significant difference in mean daily returns between the trading days in a week.NH2: There is no significant difference in mean returns across all months of the year.NH3: There is no significant difference between the returns of first half month and rest of the days of the month.NH4: There is no significant difference in returns among the pre, post holidays, and weekdays. Sample SelectionIndian Stock Market is one of the most dynamic and efficient markets in Asia. The two national level exchanges operating in India are the National Stock Exchange (NSE) and the Bombay Stock Exchange (BSE). These exchanges are well equipped with Electronic Trading Platforms, and handle large volume of transactions on a daily basis.As on 30th September 2010, there were twenty-four indices in Bombay Stock Exchange (BSE). The most widely followed BSE Sensex index is the focus of this study. BSE Sensex, constituted in 1986, is the value-weighted index of the companies listed on the stock exchange and subsequently became the barometer of the Indian Stock Market.Data SourcesThe required data on closing prices were collected from PROWESS, a corporate database maintained by CMIE and website of BSE (www.bseindia.com). The other relevant information for this study was collected from different websites, journals, and books.Time PeriodThe Securities and Exchange Board of India (SEBI) introduced the Compulsory Rolling Settlement System for stocks on January 02, 2002. This was expected to enhance liquidity for investors through reduced settlement period and also lead to higher equity turnover. Studies on anomalous behavior of stock prices in India have focused on shorter testing periods. In order to generate more robust results covering a longer testing period, the study covers a period of 8 years from 1st April 2002 to 31st March 2010 (i.e. Post Rolling Settlement Period).Sample Variable: Index ReturnThe daily returns for the index series is computed as follows: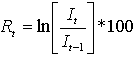 where:Rt = Daily return on the Index (I),ln = Natural log of underlying market series (I),It = Closing value of a given index (I) on a specific trading day (t), and It-1 = Closing value of the given index (I) on preceding trading day (t-1).Kruskall-Wallis Test for testing Equality of Mean ReturnsThe Kruskall-Wallis Test is used for testing the equality of mean returns for different days of the week and the equality of month wise mean returns. The entire set of observations are ranked (i.e. higher the value, higher the rank) and then re-arranged into a nj x 5 matrix where nj represent the rank of the return and columns represent the day-of-the-week — Monday through Friday. The same process is repeated for testing the equality of month wise mean returns. The Test Statistic ‘H’ is calculated as:
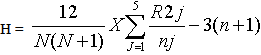 Where: Rj = Sum of the Ranks in the jth Columnnj = Number of Cases in the jth Column, andN= Sum of Observations in all the ColumnsCross-Correlation TestThe cross correlation for the index returns in testing various hypotheses is computed using the following model:
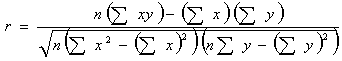 Where,N = Number of observations∑x = Dependent variable, and ∑y = Independent variableRegression Model for Hypothesis TestingThe following regression model is employed to test the Daily Returns Effect, Month-of-the-Year Effect, Semi& Turn-of-the Month Effect and Holiday Effect in stock market adjusted returns.
 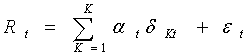 Where Rt is the logarithmic return of the market index: αt is the regression parameter;
  is an error term;
  is dummy variables for daily, monthly, Semi& Turn of the month and holiday effect. For daily effect, K is 5, which corresponds to 5 trading days in a week. In this case,
  =1 if day t is a Monday, 0 otherwise,
  =1 Tuesday and 0 otherwise and so on. For monthly effect, K is 12, which corresponds to 12 months in a year. In this case,
  =1 if month t is January and zero otherwise,
  =1 for February and 0 otherwise, and so on.
 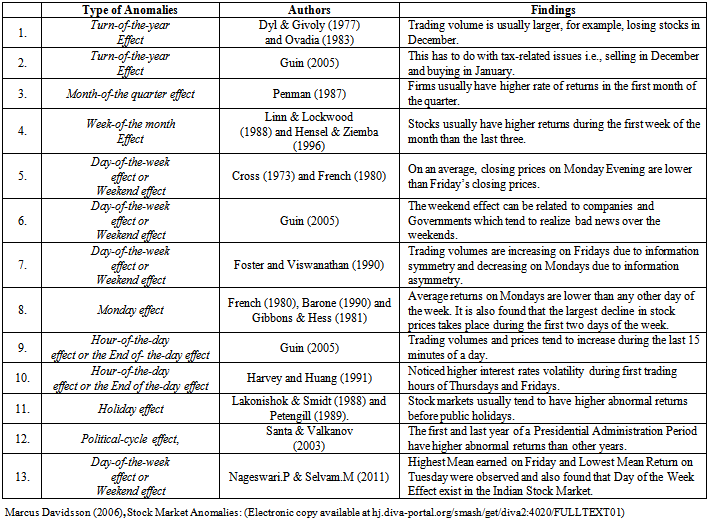 | Table 1. Calendar Anomalies |
3. Results
Analysis of BSE Sensex Daily ReturnsThe descriptive statistics for the daily data, for the study period from April 2002 to March 2010, is provided in Table 2. It shows that the mean daily returns of BSE Sensex Index were positive for all trading days, and were higher (0.1619) on Friday and lower (0.0169) on Monday. This seems to support the day of the week effect documented in other studies in that the returns are the lowest on Monday after the market digests all potential negative information released over the weekend. The Standard Deviation of Returns was the highest (2.0891) on Monday and the lowest (1.5495) on Thursday. Chart 1 describes the average daily returns of BSE Sensex Index for the period from April 2002 to March 2010. 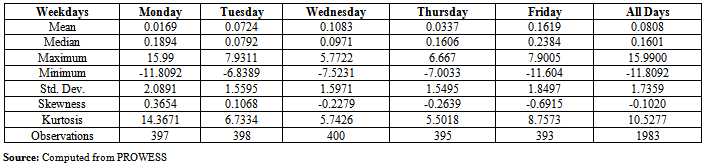 | Table 2. Descriptive Statistics for BSE Sensex Index Daily Returns: April 2002 - March 2010 |
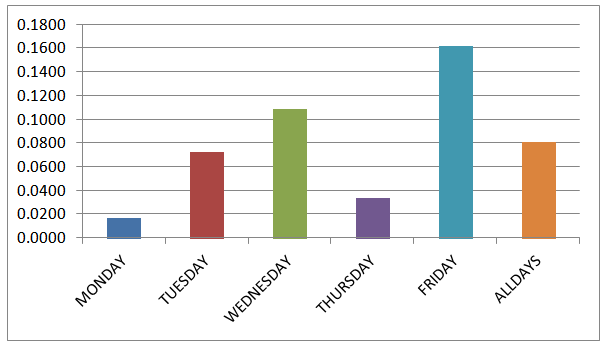 | Chart 1. BSE Sensex Index Daily Returns: April 2002 - March 2010 |
The Kruskall-Wallis test for BSE Sensex Index Daily Returns, for the period from April 2002 to March 2010, is given in Table 3. The Kruskall-Wallis statistics value of 9.8501 was higher than the table value of 9.49 at 5% level of significance only in 2003-04, indicating there was a significant difference between the returns of different trading days of the week only for that particular year. There was statistically no significant difference in mean daily returns for other years during the study period.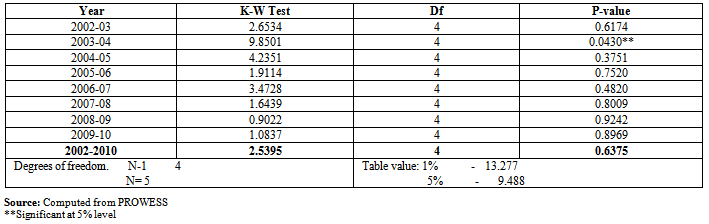 | Table 3. Kruskall-Wallis Test for BSE Sensex Index Daily Returns: April 2002 - March 2010 |
The results of Cross Correlation test for BSE Sensex Index Daily Returns, for the period from April 2002 to March 2010, are provided in Table 4. It is observed that during the trading days of the week, the Correlation Coefficient between Tuesday and Wednesday was -0.1705 and significant at 1% level. The results also show that there was negative correlation between Monday-Tuesday and Tuesday – Thursday and positive correlation between returns of other trading days of the week during the study period. 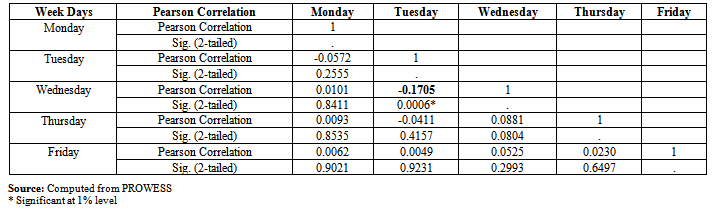 | Table 4. Cross Correlation Test for BSE Sensex Index Daily Returns: April 2002 - March 2010 |
The Regression Results of BSE Sensex Index Daily Returns, for the study period from April 2002 to March 2010, are presented in Table 5. It is noted that none of the coefficients are significant at 5% level for Day of the Week Effect in BSE Sensex Index Daily Returns during the study period. The value of the R2 was 0.0008. The F-statistic indicates that the overall fit of the model was poor. It is found that there was no statistically significant Day of the Week Pattern in stock returns during the study period. Therefore, the Null Hypothesis (NH1), “There is no significant difference among the returns of different trading days of the week,” cannot be rejected.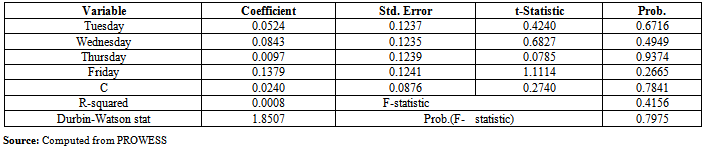 | Table 5. Regression Results for BSE Sensex Index Daily Returns: April 2002 - March 2010 |
Analysis of BSE Sensex Index (Month wise Daily Returns)The Descriptive Statistics for BSE Sensex Index month wise daily returns, for the study period from 1st April 2002 to31st March 2010, are presented in Table 6. The results show that the highest mean return (0.2718) was recorded in December with the lowest value (1.3443) for standard deviation. The months of January, February and October witnessed negative mean returns. This shows that the popular “January Effect” was not evident during the study period. The possible reason for the negative return in February could be that investors sell poorly performing stocks before the month of March for tax purposes and also raise money to settle their tax dues. However, the month of April witnessed positive returns and could be the result of the end of tax loss selling as the tax assessment period end on March 31 every year. It is also found that months of November and December recorded high returns. Most companies in India pay a bonus to employees in the months of November and December coinciding with major festivals such as Diwali, Ramzan, and Christmas and some of these bonuses are presumably invested in the stock market. These results are consistent with other recent studies (2 & 16). The average month wise returns for BSE Sensex Index during the study period from April 2002 to March 2010 are exhibited in Chart 2. 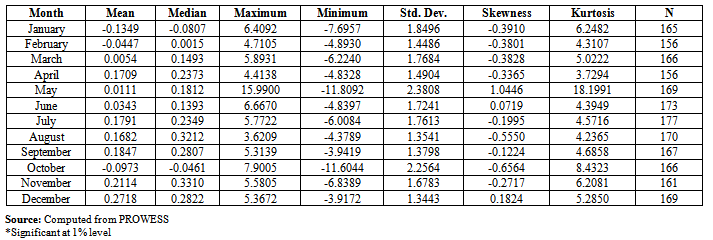 | Table 6. Descriptive Statistics for BSE Sensex Index Month wise Daily Returns: April 2002 - March 2010 |
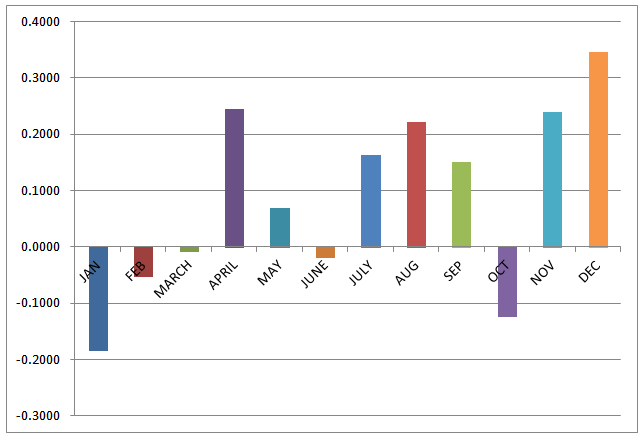 | Chart 2. Month Wise daily returns for BSE Sensex Index:April 2002 - March 2010 |
The results for the Kruskall-Wallis Test for BSE Sensex monthly returns are presented in Table 7. The Kruskall - Wallis test statistic value was lower than the table value of 19.67 at 5% level of significance. It indicates that there was no significant difference between the returns of different months of the year. In other words, the Monthly Effect did not exist for BSE Sensex Returns during the study period. 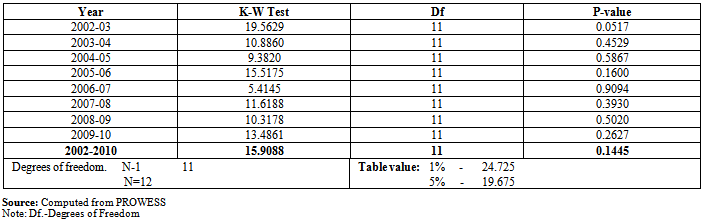 | Table 7. Kruskall-Wallis Test of BSE Sensex Index Month Wise Daily Returns: April 2002 - March 2010 |
The Results of Cross Correlation Test for BSE Sensex Index monthly returns are presented in Table 8. The correlation coefficient was highest in the months of July-October (0.3319), followed by February-December (0.2384), September-November (0.2353) and February - October (0.2184) and was significant at 1% level. The results also indicate that there was significant negative correlation between the returns of January-September and June–July at -0.1625, and -0.1921 respectively, and they were significant at the 5% level. 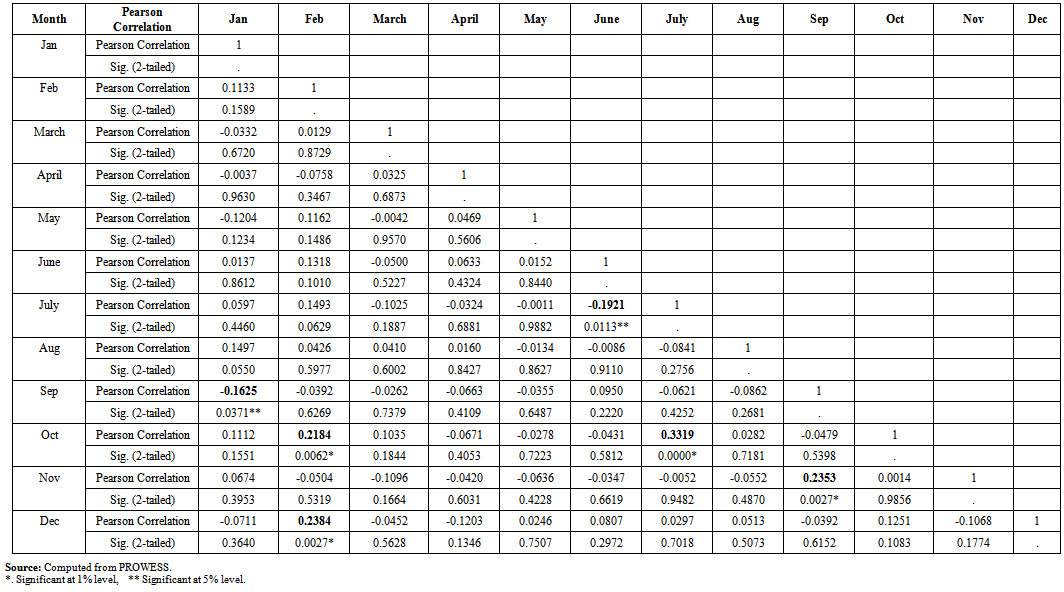 | Table 8. The Results of Cross Correlation Test for BSE Sensex Index Daily Returns - ‘Month wise’ from April 2002 to March 2010 |
The Regression results for the BSE Sensex index month wise returns are presented in Table 9. It is noted that the coefficient in December was positive and significant at 5% level. For other months, returns were not significant at 5% level. Based on the F-Statistic, the Null Hypothesis (NH3), “There is no significant difference among month wise returns,” cannot be rejected. 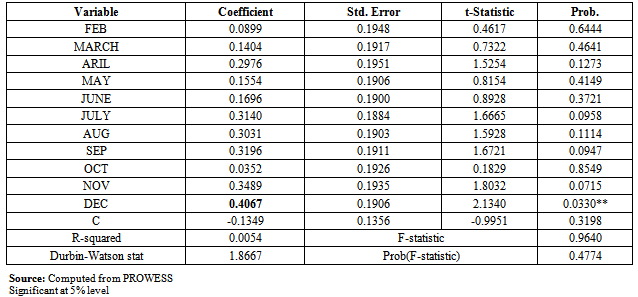 | Tables 9. Regression Results for BSE Sensex Index Month wise Daily Returns: April 2002 - March 2010 |
Analysis of Semi-Month Wise Daily Returns for BSE Sensex IndexThe descriptive statistics for semi-month wise BSE Sensex Index Daily Returns, from April 2002 to March 2010, are presented in Table 10. The results indicate that the highest mean return (0.1167) was recorded in the first half month. This could be as a result of the corporate sector announcing positive information during the first half month period. The average semi-month Returns for BSE Sensex Index Returns from 1st April 2002 to 31st March 2010 are presented in Chart 3. It is observed that the first half month recorded the highest mean return. The Regression Results of BSE Sensex index semi-month returns are presented in Table 11. The results reveal that the coefficient for the first half-month was significant at 1% level in 2003-04. In 2005-06, the coefficient was statistically significant at 5% level. The coefficient was negative in 2008-09, probably due to the impact of US financial crisis that affected global financial markets. 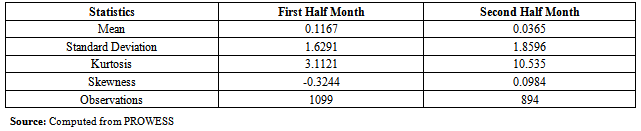 | Table 10. Descriptive Statistics for BSE Sensex semi-month wise Daily Returns: April 2002 - March 2010 |
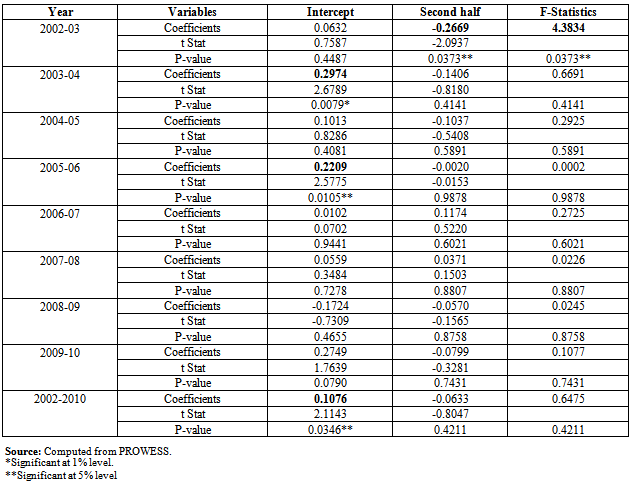 | Table 11. Regression Results for BSE Sensex semi-month wise Daily Returns: April 2002 - March 2010 |
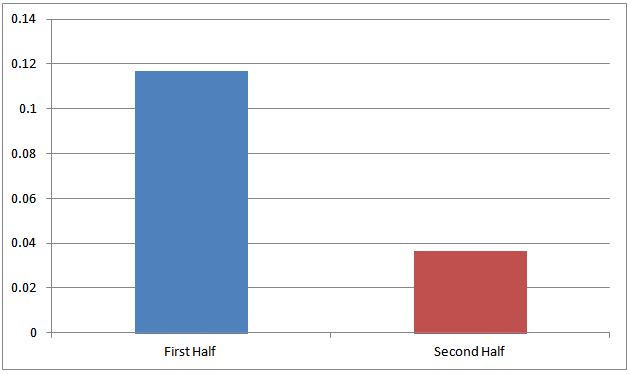 | Chart 3. Semi-Month returns for BSE Sensex Index: April 2002 - March 2010 |
The coefficient was negative for second-half of the month in all years, except 2006-07 and 2007-08. The coefficient for the second-half of the month was statistically significant at 5% level in 2002-03. The F-value also was significant at 5% level and it indicates that the mean daily return for the second half was significantly lower than that of the first half for only 2002-03. The coefficient was significant for the first-half of the month for only 2005-06. For the entire study period, from April 2002 to March 2010, the coefficient for the first-half month was positive and significant at the 5% level, and the second-half month coefficient was negative and insignificant. However, based on the F-statistic, the null hypothesis (NH4), “There is no significant difference between the returns of first-half month and rest of the days of the month,” cannot be rejected. Analysis of the Holiday EffectAccording to the Holiday Effect, stocks show abnormally high return on days prior to holidays. To measure the Holiday Effect, the trading days have been classified into three categories, namely, Weekdays, Pre-Holidays, and Post Holidays. Weekday is the day, which has both at least one preceding, and one succeeding day as trading days. Pre-Holiday is the day which has at least one preceding day as trading day but at least one succeeding day as holiday. Post-Holiday is the day which has at least one preceding day as holiday, but at least one succeeding day as trading day.The descriptive statistics in Table 12 show that that the minimum average return was recorded on Weekdays and maximum return was registered on Pre-Holidays. The highest standard deviation (2.1097) was recorded in Post-Holidays and the lowest standard deviation (1.5404) was recorded for Weekdays during the study period. It indicates that the market was more volatile during Post Holidays and least volatile on Weekdays. The reasons for high Pre-Holidays returns may be due to psychological reasons. Chart 4 presents the Average Daily Returns during Pre-Holidays, Post-Holidays and Weekdays for BSE Sensex Index from April 2002 to March 2010. 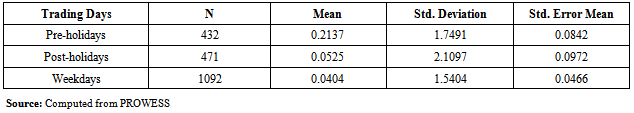 | Table 12. Descriptive Statistics for BSE Sensex Index Daily Returns for Pre, Post-Holidays and Weekdays: April 2002 - March 2010 |
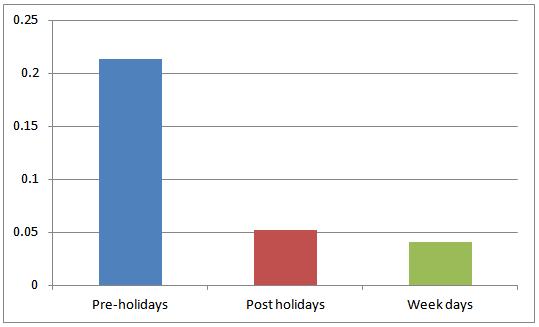 | Chart 4. Average Daily Returns of Pre, Post-Holidays and Weekdays for BSE Sensex: April 2002 - March 2010 |
The Regression results for BSE Sensex Index, from April 2002 to March 2010, are presented in Table 13. The results show that the coefficients for Post-Holidays (-0.1632) and Weekdays returns (-0.1769) were negative and also insignificant during the study period. The Pre-Holiday returns were higher than that of Post-Holidays and Weekdays and statistically significant at 1% level. However, the insignificant F-Statistic value (1.6923) did not confirm the Pre-Holiday Effect during the entire study period. Hence the Null Hypothesis (NH5), “There are no difference in returns among Pre-Holidays, Post-Holidays, and Weekdays, cannot be rejected.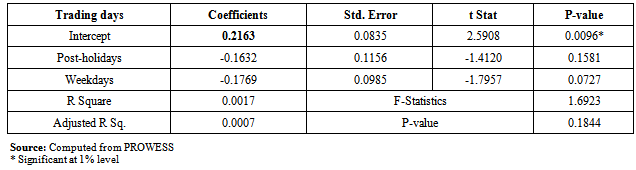 | Table 13. Regression Results for BSE Sensex Index Daily Returns for Pre, Post-Holidays and Weekdays: April 2002 - March 2010 |
4. Conclusions
The present study investigated the calendar anomalies in the BSE Sensex Index following the Post Compulsory Rolling Settlement Period. The study found that there was positive mean returns recorded for all days of the week and highest mean return was recorded on Friday, and lowest mean return recorded on Monday. The Monthly Returns Analysis found that the highest mean returns were recorded in December and the negative mean returns recorded in January in all years. The returns for the first half month were higher than the returns for the second half month. Also, returns for the Pre-holiday period were higher than the returns for Post-holidays and Weekdays. However, all four null hypotheses were not rejected in the study. It appears that during the post rolling settlement period increased liquidity has eliminated some of the stock market anomalies as demonstrated by the BSE Sensex index.Our findings may appear to contradict some of the findings of recent studies on stock market anomalies in the Indian Stock Market. Chandra[7], in his study encompassing the 1998-2007 time period for the BSE Sensex Index, found that the turn-of-month returns were statistically significant. It should be noted that our study did not test the turn-of-the-month effect. Patel[13], in his study encompassing the 1999-2007 time period for the BSE 500 index, found that the monthly returns for November and December were statistically significant and the mean return for the March-May period was lower than the mean return for the remaining nine months. It should be noted that Patel[13] used the BSE 500 and NSE 500 index in their study of stock market anomalies and we used the BSE Sensex index in our study. The BSE Sensex index is more liquid than the BSE 500 and NSE 500 index and could have contributed to apparently contradictory findings. In addition, the testing period for both recent studies overlapped the pre and post rolling settlement period and thereby did not probably account for the effect of increased liquidity and stock market turnover subsequent to post compulsory rolling settlement period and its potential effect on the anomalous behavior of stock prices.Our study is the first to focus exclusively on the post compulsory rolling settlement testing period and thereby not confounded by changes in liquidity and increased stock market turnover subsequent to the post compulsory rolling settlement period. Although some of our results confirm the findings of earlier studies such as higher returns for the months of November and December[16], lower returns for Monday[6], we were unable to reject any of our four null hypotheses. The clear takeaway from our study is that we don’t observe anomalous stock market behavior in the BSE Sensex index in an environment of increased liquidity and stock market turnover subsequent to the post compulsory rolling settlement period.
References
| [1] | Amanulla S, Thiripalraiu M (2001). Week End Effect: New Evidence from the Indian Stock Market. Vikalpa. 26(2): 33-50. |
| [2] | Anoki Parikh (2009). The December Phenomenon Month of the Year Effect in the Indian Stock Market. (Electronic copy available at: www.nseindia.org). |
| [3] | Ariel RA (1987). A Monthly Effect in Stock Returns. Journal of Financial Economics. 18: 161–174. |
| [4] | Ariel RA (1990). High Stock Returns before Holidays: Existence and Evidence of Possible Causes. Journal of Finance. 45: 1611–1626. |
| [5] | Bodla BS, Kiran Jindal (2006). Monthly Effects in Stock Returns: New Evidence from the Indian Stock Market. The ICFAI Journal of Applied Finance. 12(7): 5-13. |
| [6] | Brooks C, Persand G (2001). Seasonality in Southeast Asian Stock Markets: Some new Evidence on Day-of-the-Week Effects. Applied Economics Letters. 8: 155-158. |
| [7] | Chandra A (2011). Stock Market Anomalies: A Test of Calendar Effect in the Bombay Stock Exchange. Indian Journal of Finance, 5(5): |
| [8] | Condoyanni L, O’Hanlon J, Ward CWR (1987). Day of the Week Effect on Stock Returns: International Evidence. Journal of Business Finance and Accounting. 14(2): 159-174. |
| [9] | Gagari Chakrabarti, Chitrakalpa Sen (2008). November Effect: An Example of Calendar Anomaly in Indian Stock Market. (Electronic copy available at:http;//ssrn.com.abstract=1121606). |
| [10] | Hareesh Kumar V, Malabika Deo (2007). Efficiency of Indian Stock Market: A Case of Day of the Week Effect. SMART Journal of Business Management Studies. 3(2): 28-35. |
| [11] | Jayant Parimal (2001). Study of Volatility and Day of the Week Effect in Indian Markets. The ICFAI Journal of Applied Finance. 7(5): 1-17. |
| [12] | Madhusudan Karmakar, Madhumitha Chakraborty (2000). Holiday Effects in the Indian Stock Market. Finance India. 14(1): 165-172. |
| [13] | Marcus Davidson (2006). Stock Market Anomalies. (Electronic copy available athj.diva-portal.org/smash/get/diva2:4020/FULLTEXT01). |
| [14] | Nageswari P, Babu M (2011). Analysis of Week End Effect in Indian Stock Market. SMART Journal of Business Management Studies. 7(1): 78-87. |
| [15] | Nageswari P, Selvam M (2011). Re-Examination of the Day of the Week Effect on the Indian Stock Market: A Study With Reference to S&P CNX 500 Index. Management Trends. 8(1): 29-42. |
| [16] | Patel J. (2008) Calendar Effects in the Indian Stock Exchange. International Business and Economics Research Journal. 7(3): 61-70. |
| [17] | Ramesh Chander, KiranMehta, Renuka Sharma (2008). Reexamination of the Day of the Week Effect on the Indian Stock Markets. The ICFAI Journal of Applied Finance. 14(4): 5-20. |
| [18] | Syed A Basher, Perry Sadorsky (2006). Day-of-the Week Effects in Emerging Stock Markets. Applied Economics letters. 13: 621-628. |
 Abstract
 Reference
 Full-Text PDF
 Full-text HTML