-
Paper Information
- Next Paper
- Previous Paper
- Paper Submission
-
Journal Information
- About This Journal
- Editorial Board
- Current Issue
- Archive
- Author Guidelines
- Contact Us
International Journal of Finance and Accounting
p-ISSN: 2168-4812 e-ISSN: 2168-4820
2013; 2(6): 319-325
doi:10.5923/j.ijfa.20130206.04
Discriminant Analysis and the Prediction of Corporate Bankruptcy in the Banking Sector of Nigeria
 Abstract
 Reference
 Full-Text PDF
 Full-text HTML
Wurim Ben Pam
Department of Business Studies, Plateau State University, Bokkos, Jos, Plateau State, Nigeria
Correspondence to: Wurim Ben Pam, Department of Business Studies, Plateau State University, Bokkos, Jos, Plateau State, Nigeria.
| Email: |  |
Copyright © 2012 Scientific & Academic Publishing. All Rights Reserved.
The need to predict the potential of failure in commercial banks has become an important and reoccurring decimal. The main thrust of this study is to investigate the potency of the Multiple Discriminant Analysis Model (propounded by Altman, 1968) in ascertaining the state of health of these banks. Two ‘failed’ and two non-failed banks (as adjudged by Central Bank of Nigeria) constitute the sample of the study within a five year period (1999-2003). Contrary to regulatory agencies’ stand, Z Scores of the two non-failed banks were found to be below 1.80 indicating ill-health. The study also confirms the ill health of a bank (whose license has since been revoked) while the Z Scores of the second bank-hitherto classified as ‘failed bank’ – is found to be above 3.00. It was concluded that the MDA model is still a potent tool in the prediction of the potential of failure; the key variables in the Altman’s model are positive indicators in the analysis and regulatory agencies have not been upright in implementing results of analysis. The paper recommends the unification of the MDA model with others; the improvement of the MDA parameters and EPS. Also, regulatory agencies should be upright and impartial in applying results of the model.
Keywords: Discriminant Analysis, Prediction, Corporate Bankruptcy, Potential of failure, Banking Sector, Financial Ratios, Altman’s Z-scores
Cite this paper: Wurim Ben Pam, Discriminant Analysis and the Prediction of Corporate Bankruptcy in the Banking Sector of Nigeria, International Journal of Finance and Accounting , Vol. 2 No. 6, 2013, pp. 319-325. doi: 10.5923/j.ijfa.20130206.04.
Article Outline
1. Introduction
- The Nigerian Banking Sector plays a very crucial role in the socio-economic development of the country and significantly contributes to the Gross Domestic Product of the nation. Olaniyi[1] posits that the sector serves as the nerve centre of any modern economy, the repository of the people’s wealth and supplier of credits which lubricates the engine of growth of the entire economic system. However, the sector has over the years experienced turbulence and in some cases failure. Between 1994 and 2006 according to NDIC[2] the Central Bank of Nigeria (CBN) revoked the licenses of 45 failed banks. The federal high court issued orders for them to be wound up and appointed the Nigeria Deposit Insurance Corporation (NDIC) as liquidator of the banks. Some of the liquidated banks, according to the NDIC report[2] include Alpha Merchant Bank, PLC (September 8, 1994), Abacus Merchant Bank Ltd.(January 16, 1998), Allstates Trust Bank, PLC (January 16, 1998), Assurance Bank of Nigerian (January 16, 2006) and Lobi Bank of Nigeria Ltd.The Central Bank of Nigeria in August 2011 withdrew the banking licenses of Afribank Plc, Spring Bank Plc and Bank PHB Plc because "the three rescued banks have not shown the necessary capacity and ability to beat the September 30 recapitalization (of N25B) deadline." The NDIC stepped in, creating three bridge banks (temporary banks) to acquire the assets of the banks so as to continue operations on a fresh note. Bridge banks are temporary banks set by a regulator to administer the deposits and liabilities of a failed bank. Enterprise Bank Limited, Keystone Bank Limited and Mainstreet Bank Limited are the bridge banks established to acquire all assets and liabilities of Spring Bank, Bank PHB and Afribank, respectively. The CBN said it had issued banking licenses to the three new banks[3].In the past, instability in the Nigerian financial system and the banking sector in particular was blamed on institutional failures. However, this trend has shifted to generalized failure which is currently sweeping the banking sector. Ogunleye as cited in Olaniyi[1] corroborating this fact classified the causes of bank failure into institutional, economic and political factors as well as regulatory and supervisory inadequacies. Some of these generalized failure patterns have institutional, economic, political and socio-cultural dimensions. Specifically, factors like mismanagement, ineffective machinery for debt recovery, poor credit policy and administration, greed, corruption and fraud are some of the worst culprits[4].The gruesome impact of ill health in the banking sector has affected almost all facets of the society - the government, regulatory authorities, creditors, equity investors, the bankers as well as the general public. It is in this light that the prediction of the potential of failure in the sector comes to the fore. To arrest the aforementioned culprits and also avoid their encroachment into the Nigerian banking sector, regulatory authorities like the CBN and NDIC on the one hand and other stakeholders like shareholders, corporate managers and customers on the other hand must be conversant with potent tools that enable them measure performance and trends in the sector.Discriminant analysis, Neural networks, Logit analysis and Genetic algorithms are some of the appropriate and handy tools that might be useful in determining the current and potential bank business failure. For the purpose of this paper, the potency of the discriminant analysis tool is put to test in bankruptcy or failure prediction in Nigerian banks.
1.1. Statement of the Problem
- The ripple effects of bank failure have culminated into deterioration, stagnation and eventual collapse or system failure in almost all facets of the economy. Specifically, raising funds and credits became difficult, the propensity of citizens to save with banks deteriorated and at the same time, the performance of small, medium and large scale industries (that serve as the engine of growth to the economy) are inhibited or stalled. This instability in the banking sector has further rendered monetary policy efforts of government ineffective. Federal government’s regulatory agencies like the CBN and NDIC have continued to wrestle with bank failure especially as the sector serves as a channel for implementing its monetary policies. This quagmire calls for a pressing need for assessing the performance banks with the aim of identifying those that need the attention of the relevant supervisory agencies of government. Also, there is a need to build public confidence and safeguard the savings and investments of the citizens and foreigners. Are there ways and means of identifying and arresting bank failure long before it occurs? Can regulators use a bankruptcy prediction model to decide whether a particular bank should be closed or at least receive increased attention and guidance? Several bankruptcy prediction models may be used to empirically select predictors for failure prediction purposes. These models have different assumptions about the relationships between the independent variables. The main thrust of this study therefore, is to assess the potency of Discriminant Analysis Model in the prediction of the potential of failure in the banking sector.
1.2. Methodology
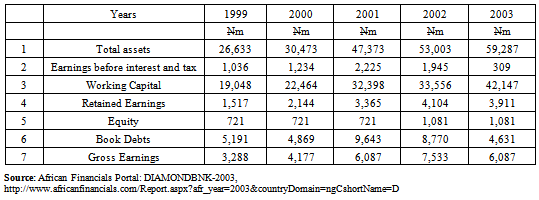
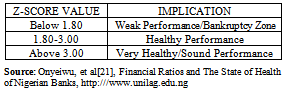
- The study is a survey using the Multiple Discriminant Analysis Model (Multi-variate Analysis of Z-scores) on secondary data obtained from annual financial reports and accounts of two (2) non-failed banks and two (2) failed banks in Nigeria selected on a convenient sampling basis. Each failure or success occurred between 1999 and 2003. This period of review is purposively selected considering the period of existence of Trade Bank Plc before its license was revoked. The non-failed banks are Diamond Bank Plc and First Bank Plc while the ‘failed’ banks are Trade Bank Plc and Afribank Plc. In the study, data is analyzed based on discriminating variables like Working capital, Retained earnings, Earnings before Interest and Tax, Equity, Total assets and Total book debts. Thereafter, the Discriminant Analysis model is calculated. The model used in this study is given as Zeta “Z” with the original Z-score formula given as follows:Z=1.2X1 + 1.4X2 + 3.3X3 + 0.6X4 + 0.999 X5, Where:X1 = Working Capital to Total AssetsX2 = Retained Earnings to Total AssetsX3 = Earnings before Interest and Taxes to Total AssetsX4 = Value of Equity to Total Book DebtX5 = Gross Earnings to Total Assets[5][6].After the computations, a decision rule to discriminate between failed and non-failed banks is used as follows:
|
2. Theoretical Considerations
- Bankruptcy prediction has been one of the most challenging tasks in accounting since the study of FitzPatrick in 1930’s and during the last 60 years an impressive body of theoretical and especially empirical research concerning this topic has evolved[7][8]. Back et al[9] observe that the two main approaches in bankruptcy prediction studies can be distinguished; the first and most often used approach has been the empirical search for predictors (financial ratios) that lead to lowest misclassification rates. The second approach has concentrated on the search for statistical methods that would also lead to improved prediction accuracy.At the beginning of the research period there were no advanced statistical methods or computers available for the researchers (Fitz Patrick as cited in[9]). The values of financial ratios in failed and non-failed firms were compared with each other and it was found that they were poorer for failed firms. In 1996, the pioneering study of Beaver presented the univariate approach of discriminant analysis and in 1968 Altman expanded this analysis to multivariate analysis[8]. In spite of the successes recorded in the use of Discriminant analysis, Back et al[9] were quick to point out that the tool suffered from assumptions that were violated often. During the 1990’s artificial neural networks produced very promising results in predicting bankruptcies[10][11][9]. However, no systematic way of identifying the predictive variables for the neural networks has been used in these studies. Genetic algorithms are a new promising method for finding the best set of indicators for neural networks. These algorithms have been applied successfully in several optimization problems, especially in technical fields.Most failure prediction studies (done before 1980’s) applied an empirical approach. They aimed at improved prediction accuracy by appropriate selection of financial ratios for the analysis. Naturally, these financial ratios have been selected according to their ability to increase prediction accuracy. There are some efforts to create theoretical constructions in failure prediction context (for presentation, see e.g. Scott 1981), but none unified theory has been generally accepted as a basis for the theoretical ratio selection. Hence, the selection has been based on the empirical characteristic of the ratios. This has led to a research tradition in which the effect of statistical method on predictor selection has been obvious. For example, the stepwise selection procedures identify variables solely on statistical grounds, ignoring the other characteristics of the variable[9].Discriminant analysis, logit analysis and genetic algorithms have all different assumptions concerning the relationships between the independent variables. Linear discriminant analysis is based on linear combination of independent variables, logit analysis uses the logistic cumulative probability function and genetic algorithm is a global procedure based on the mechanics of natural selection and natural genetics.
2.1. Discriminant Analysis
- Discriminant analysis tries to derive the linear combination of two or more independent variables that will discriminate best between a priori defined groups, which in our case are failing and non-failing banks. This is achieved by the statistical decision rule of maximizing the between-group variance relative to the within group variance. This relationship is expressed as the ratio of between-group to within-group variance. The Z-score formula for predicting bankruptcy was published in 1968. The formula may be used to predict the probability that a firm will go into bankruptcy within two years. Z-scores are used to predict corporate defaults and an easy-to-calculate control measure for the financial distress status of companies in academic studies. The Z-score uses multiple corporate income and balance sheet values to measure the financial health of a company. The discriminant analysis derives the linear combinations from an equation that takes the form of the original Z-score formula which is given as follows[6][8]:Z = 1.2T1 + 1.4T2 + 3.3T3 + 0.6T4 + 0.999T5.Where:T1 = Working Capital / Total Assets. Measures liquid assets in relation to the size of the company.T2 = Retained Earnings/Total Assets. Measures profitability that reflects the company's age and earning power.T3 = Earnings Before Interest and Taxes / Total Assets. Measures operating efficiency apart from tax and leveraging factors. It recognizes operating earnings as being important to long-term viability.T4 = Market Value of Equity / Book Value of Total Liabilities. Adds market dimension that can show up security price fluctuation as a possible red flag.T5 = Sales/ Total Assets. Standard measure for total asset turnover (varies greatly from industry to industry).Under the original z-score component definitions, the variable definition weighting factor has the following Zones of Discrimination: Z > 2.99 for “Safe” Zones; 1.81 < Z < 2.99 for “Grey” Zones and Z < 1.81 for “Distress” Zones while the z-score estimated for private firms is given as follows[12]:T1 = (Current Assets − Current Liabilities) / Total AssetsT2 = Retained Earnings / Total AssetsT3 = Earnings Before Interest and Taxes / Total AssetsT4 = Book Value of Equity / Total LiabilitiesT5 = Sales/ Total AssetsAltman found that the ratio profile for the bankrupt group fell at -0.25 avg, and for the non-bankrupt group at +4.48 avg.The Z- Score Bankruptcy Model for private firms is given as Z' = 0.717T1 + 0.847T2 + 3.107T3 + 0.420T4 + 0.998T5 and the Zones of Discrimination as Z > 2.9 for “Safe” Zone, 1.23 < Z < 2. 9 for “Grey” Zone and Z < 1.23 for “Distress” Zone. Finally, the Wikimedia[12] estimated Z-score for non-manufacturer industries and emerging market credits as follows: Z-Score bankruptcy model: Z = 6.56T1 + 3.26T2 + 6.72T3 + 1.05T4Where:T1 = (Current Assets − Current Liabilities)/Total Assets T2 = Retained Earnings / Total AssetsT3 = Earnings Before Interest and Taxes / Total AssetsT4 = Book Value of Equity / Total LiabilitiesThe zones of discrimination for non-manufacturer industries and emerging market credits are Z > 2.6 for “Safe” Zone, 1.1 < Z < 2. 6 for “Grey” Zone and Z < 1.1 -“Distress” Zone. Thus, each firm receives a single composite discriminant score which is then compared to a cut-off value, which determines to which group the company belongs to.However, Hair et al[13] observe that discriminant analysis does very well provided that the variables in every group follow a multivariate normal distribution and the covariance matrices for every group are equal. However, empirical experiments have shown that especially failing firms violate the normality condition. In addition, the equal group variances condition is also violated. Moreover, multi co-linearity among independent variables is often a serious problem, especially when stepwise procedures are employed.The two most frequently used methods in deriving the discriminant models according to Back et al[9] have been the simultaneous (direct) and the stepwise methods. In their opinion, the former is based on model construction by for example, theoretical grounds, so that the model is ex ante defined and then used in discriminant analysis. When the stepwise method is applied, the procedure selects a subset of variables to produce a good discrimination model using forward selection, backward elimination, or stepwise selection. The stepwise method used is a built in function in the SAS-program. The stepwise selection begins with no variables in the model. At each step, if the variable that contributes least to the discriminatory power of the model measured by Wilks’ lamda fails to meet the criterion to stay, then it will be removed. The variable not the model that contributes most to the discriminatory power of the model is entered. When all variables in the model meet the criterion to stay and none of the other variables meets the criterion to enter, the stepwise selection process stops (SAS as cited in Back et al[9]). All said, among the studies focusing on failure prediction are some papers that have been especially contributive. Among the first studies that identify the problem connected to the difference between the values of financial ratios of failing and non-failing firms were the studies of Ramser and Foster[14], Fitzpatrick[15], Winakor and Smith[16], and Merwin[17]. These studies settled the fundamentals for failure prediction research[9]. Also, at the international scene, the studies of Altman[8], Beaver as cited in[1], Charitou et al[18] and Rose et al as cited in[1] predicted bankruptcy status using Multiple Discriminant Analysis. In the same vein, Kolari et al as cited in[1] employed the use of trait recognition in bank failure prediction while Mizuno et al as cited[1] adopted the use of Neural Networks in bankruptcy prediction. Similar studies in Nigeria include Adefia as cited in[1] who adopted only one bank over a period of three years. Olaniyi[19] enlarged Adefia’s study by five (5) years but also involved only one bank. Olaniyi[1] is also an extension of the previous studies (Olaniyi,[19]). This investigation has gone ahead of previous ones to study two (2) non-failed banks and two (2) failed banks over a period of five years.
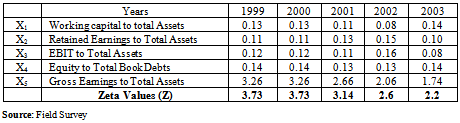
3. Data Presentation and Analysis of Results
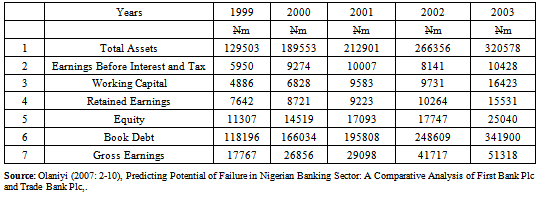
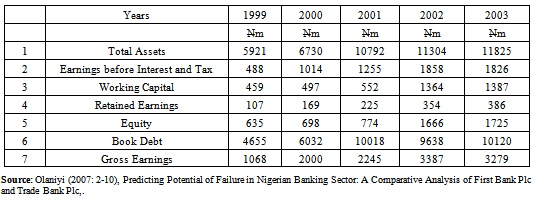
- The data studied comprise of the annual financial statements of two non failed banks and two failed banks randomly selected for five years spanning the period between 1999 and 2003. The non failed banks are Diamond Bank Plc and Access Bank Plc while the failed banks are Trade Bank Plc and Afribank Plc (now known and called Mainstreet Bank limited).The analysis begins with the annual financial statements of Diamond Bank Plc and First Bank Plc which are non failed banks. Here, the variables, financial statements and accounts needed to solve the Altman Z-score formula are captured and computed accordingly as shown in Appendices 1-4. Tables 2 and 3 below present the summary of Zeta (Z) Scores for Diamond Bank Plc and First Bank Plc respectively. These banks are currently classified as non-failed banks by the CBN. Also, Tables 4 and 5 present the summary of the Zeta (Z) Scores of Trade Bank Plc and Afribank Plc respectively. Trade Bank Plc had its license revoked by the CBN on January 16, 2006 as a failed bank. On the other hand, Afribank Plc’s commercial license was revoked by CBN and its assets and some of its liabilities taken over by Mainsteet Bank Limited (MBL) in August 2011. As at January 2012, the assets of MBL were 100% owned by Asset Management Company of Nigeria (AMCON), an arm of the federal government of Nigeria. The reason given for revoking Afribank license is that ‘the rescued bank did not show the necessary capacity and ability to beat the September 30, 2011 recapitalization dateline issued by CBN (Wikipedia[20]; Chima[3]).According to Table 2, the Z Scores of Diamond Bank Plc stood at an average of 1.22 for 1999-2002 with a drop to 0.97 in 2003. The overall implication of these Z Sores is that during the period under review, the bank had a high bankruptcy region of Z<1.81, thus indicating ill-health. In spite of the fact that the bank has not been indicted by CBN, the result of analysis clearly indicates that its performance is weak. In the same vein, First Bank Plc recorded a very high potential of failure as the Z Scores for all the years under review fall below the 1.81 line as captured in Table 3. The result agrees with Olaniyi[1] who corroborates this fact by asserting that the bank’s potential of failure is very high having Z Scores of 0.21 for all the years except 1999. In spite of the fact that the bank’s operating license was not revoked by the CBN during the period under review, the result of the analysis also indicates that the performance is weak and falls within the bankruptcy region.As can be seen in Table 4, the Z Scores of Trade Bank Plc were also far below the acceptance region. This shows that the bank’s potential of failure is very high thus agreeing with the decision of the CBN to revoke the license of the bank in August, 2006.
|

|

|

|
4. Conclusions
- In view of the aforementioned analysis, it has been concluded that:1. The Multiple Discriminant Analysis Model(Multi-variate Analysis) is still a potent tool in the prediction of the potential of failure in the banking sector. However, failure prediction researches have suffered from lack of any unified theory since the 1930’s when the first empirical studies on this subject were published. In spite of this, empirical predictions have been promising.2. Liquidity, profitability, operating efficiency and total assets turnover (which are the key variables in the Altman’s Z score) are very potent tools in the determination of the strength of a bank. Here, the operating income concept which states that ‘a company that cannot generate sufficient operating income to cover its operating expenses is bound to fail or die’ (Husband, 1946) has been vindicated.3. Other parameters like Earnings per Share, Dividend per Share and the Ratio of Interest Earned to Interest Paid can also serve as potent collaborative tools (alongside MDA) in the determination of the strength of banks.4. Regulatory agencies are seen to apply double standards in the application of the result of the MDA model on failed and non-failed banks. This is because the result of the analysis above shows that the Z Scores of banks regarded as non-failed by the CBN were far below the acceptance region for strong banks and vice versa.
5. Recommendations
- Arising from the findings and conclusion above, the following recommendations have been advanced:1. To give the Multiple Discriminate Analysis Model the potency it deserves, organizations using the tool should integrate or use Logit and Neural Networks as an added advantage. Researchers in failure prediction studies should also unify various models like Logit Analysis and Genetic Algorithm alongside the Discriminant Analysis Model for synergy purposes. 2. Operators of banks should make efforts to improve their liquidity, profitability, operating efficiency and total assets turnover if they must remain in business and avoid CBN sanctions.3. In the same vein, operators of banks should ensure that their EPS, DPS and the ratio of Interest Earned to Interest Paid are improved. This is to attract the loyalty and attention of stakeholders like shareholders, clients, depositors and government regulators such as the CBN and NDIC.4. Regulatory agencies should be upright in applying results of failure prediction models when discriminating between failed and non-failed banks and should apply the appropriate sanctions to banks found to be in the bankruptcy region without partiality or double standards.