-
Paper Information
- Next Paper
- Previous Paper
- Paper Submission
-
Journal Information
- About This Journal
- Editorial Board
- Current Issue
- Archive
- Author Guidelines
- Contact Us
International Journal of Finance and Accounting
p-ISSN: 2168-4812 e-ISSN: 2168-4820
2013; 2(4): 248-258
doi:10.5923/j.ijfa.20130204.08
Effects of Changing Deflators on the Value Relevance of Earnings per Share: Empirical Evidence from Emerging Market of Tunisia
 Abstract
 Reference
 Full-Text PDF
 Full-text HTML
Mohamed Rafik Ben Ayed1, Ezzeddine Abaoub2
1Department Comptabilité-Finance, Institut Supérieur de Gestion, Université de Tunis, Tunisia
2Faculté des Sciences Economiques et de Gestion de Nabeul, Université du 7 novembre de Carthage, Tunisie
Correspondence to: Mohamed Rafik Ben Ayed, Department Comptabilité-Finance, Institut Supérieur de Gestion, Université de Tunis, Tunisia.
| Email: |  |
Copyright © 2012 Scientific & Academic Publishing. All Rights Reserved.
In this study, we compare the value relevance of two measures of earnings per share ; the level of Domestic earnings per share measures (Domestic EPS) computed with reference to the Glossary of the Tunis Stock Exchange by dividing accounting earnings by the number of shares that compose capital at the end of the fiscal year to the level of Basic earnings per share measures (Basic EPS) based on International Accounting Standard (IAS 33 ‘earnings per share’) computed by dividing ‘Profit attributable to the ordinary shareholders’ (the numerator) by ‘the weighted-average number of ordinary shares in issue’ (the denominator). Based on a sample of 389 firm years for firms listed on the Tunis Stock Exchange (TSE) during the period 1997-2008 and using pooled regressions, we find that although there is little difference between the two types of earnings measures, Domestic EPS are more associated to security returns and that the adjusted earnings per share to International Accounting Standards, resulting in Basic EPS, does not improve the relationship between earnings and security returns. Therefore, the use of the weighted-average number of ordinary shares in issue as denominator does not improve significantly the relationship between security returns and accounting earnings in Tunisian context. Further tests show that the use of alternative measures of performance and/or the change of earnings variables does not improve the explanatory power of earnings measures.
Keywords: Value Relevance, Domestic EPS, Basic EPS, Security Returns, Deflator, Number of Shares Outstanding, Scale Factor, Explanatory Power, Earnings Slope Coefficient, International Accounting Standards
Cite this paper: Mohamed Rafik Ben Ayed, Ezzeddine Abaoub, Effects of Changing Deflators on the Value Relevance of Earnings per Share: Empirical Evidence from Emerging Market of Tunisia, International Journal of Finance and Accounting , Vol. 2 No. 4, 2013, pp. 248-258. doi: 10.5923/j.ijfa.20130204.08.
Article Outline
1. Introduction
- Value relevance research empirically investigates the usefulness of accounting information to stock investors. Accounting information is denoted as value relevant if there is a statistical association between the accounting numbers and market values of equity. Two types of models are commonly used to investigate the relation, namely the price models and the return models. The price models examine the relation between stock price, book value and earnings and are interested in determining what is reflected in firm value. The return models examine the relation between security returns and earnings and are used to analyse whether accounting numbers capture properly the economic wealth generated by the firm over a specific period of time. Both the price and the return models are said to have serious specification problems that are often referred to as ‘scale effects’ and uncorrelated-omitted variable for the price model and ‘accounting recognition lag’ and ‘transitory earnings’ for the return model[1, 2, 3, 4, 5, 6 (for literature review and empirical evidence about scale effects in price models) and 7, 8, 9 (for literature review about the impact of losses, transitory earnings and accounting recording lag in return models)].In price models, scale effects imply a spurious relation between stock price and independent variables; book value of equities and earnings. Scale effects can be caused by failing to control scale that presumably exists among firms. Scale differences arise because large (small) firms have large (small) values for equity market value, equity book value, income, losses which imply that these variables needs to be adequately controlled[6].Previous research often related scale effects to price models and not to return models because in return studies, the dependent and explanatory variables are typically scaled by the scale factor to control for heteroscedasticity. In this context, and using the White statistic, Kothari and Zimmerman[10] found that homoscedasticity of errors is rejected in return models.Different potential solutions have been proposed to scale problems in return models: (i) deflating the data by a proxy of scale; (ii) including a scale proxy as an independent variable; (iii) excluding extreme observations; and (iv) using a specific non-linear form for the relation between returns and earnings instead of a linear relation.In relation to the first potential solution, previous research has focused on the choice between different deflators such as, stock price at the beginning of fiscal year or at the beginning of the return period, previous earnings, historical cost net income, pre-holding gain net income, cash flow, stockholders equity under replacement cost, total assets, number of shares, actual and forecasted earnings, the mean and standard deviation of earnings as deflators in returns-earnings regression[11, 12, 13, 14, 15]. Christie[11] suggested that the choice of deflator is a source of potential misspecification which can cause researchers to draw the wrong conclusions from their analyses[2]. Most of studies found and concluded that market value is the appropriate deflator, because the other deflators generate errors in variables and a correlated omitted variables problem. The rationale is that the dependent variable, ‘security returns’, has stock price at the beginning of the period as the deflator[11].In relation to the second potential solution, Barth and Kallapur[6] suggested that return models are largely unaffected by scale. The authors view scale as an omitted regression variable. Many researchers have focused on the effect of scale differences (firm size) on regression parameters in returns models by including a proxy of firms size in regression as additional independent variable to purge the scale factor effect from the observed variables[16] or by partitioning the sample on two groups on the basis of a proxy of firm size[17, 18]. Ciftci et al. [19] found a relation between the R&D scale factor and earnings variability.Other alternative to mitigate scale effects problem is to exclude extreme values for dependent and/or independent variables (the third potential solution). While arbitrary, the exclusion of extreme observations is to avoid any undue influence of extreme observations such as heteroscedasticity [7, 9, 10, 20, 21, 22, 23, 24, 25 among others].Some studies have used a specific non-linear form for the relation between returns and earnings instead of a linear relation[17, 26, 27, 28] as a potential solution to scale problem particularly when the stock price is used as deflator and approaches zero[15].The differing treatments of scale in these studies reflect the considerable disagreement among researchers over what is the best, acceptable, or appropriate specification of variables for use in capital market research. However, Easton and Sommers[4] claim that the search for a scale other than the market capitalization is unnecessary. The aim of this paper is to investigate whether the use of Basic earnings per share computed with reference to the International Standards (IAS 33, FAS 128 and FRS 14) or on other words, changing the number of shares and consequently, the deflator in earnings-returns relation results in an improvement in the explanatory power of the model and higher value relevance of earnings in Tunisian context, as measured by the adjusted R² of the model and in higher regression parameters (coefficient on earnings, also called earnings response coefficient). Our study is motivated by the growing number of papers focusing on the factors affecting the usefulness of accounting information in transition and emerging countries[2, 29, 30, 31].The remainder of the paper proceeds as follows. In section 2 we present the standard model relating security returns to accounting earnings and explain how some specifications and measurement of dependent and independent variables influence the returns-earnings relation before developing the hypothesis. Section 3 discusses financial reporting in Tunisia. Section 4 provides a description of the data used in the study and statistical methods used to test the hypothesis. Section 5 discusses our empirical findings and section 6 concludes the paper.
2. Specifying the Returns-Earnings Relation
- Value relevance of earnings and its relationship to security returns can be examined in association studies.The general model describing the relation between abnormal returns and accounting earnings can be represented as follows:
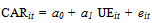 | (1) |
2.1. Return Measurement Window
- Many authors use realized returns as dependent variable and earnings level per share as independent variable. Realized stock returns (RET) are computed according to the following equation:
 | (2) |
2.2. Measurement of Unexpected Earnings
- Lev[35] suggested that one of the critical variables in the returns/earnings studies is the proxy for the market’s expected earnings. Since this expectation is unobserved, errors in estimating expected earnings might lead to a misrepresentation of the true returns/earnings association. Following, many studies have focused on the value relevance of accounting data using earnings levels and/or earnings change as explanatoray variables in returns models. Examples of studies examining the value relevance of earnings level include:[9, 17, 18, 21, 23, 24, 26, 28, 34, 38]; among others. Examples of studies examining the value relevance of earnings change include:[17, 23, 28]. In some studies, researchers have incorporated the level of and change in earnings rather than just the level or change in earnings. It was suggested that this would overcome the measurement error inherent in estimating unexpected earnings. Examples of studies include:[21, 25, 28, 39] among others.
2.3. Earnings per Share
- Different measures of earnings are used as summary of firm performance such as operating earnings, pre-exceptional earnings, earnings before taxes, cash flow, non discretionary earnings. However, the International Accounting Standard Board (IASB), the Financial Accounting Standard Board (FASB) in US and the Accounting Standard Boards (ASB) in UK have enacted standards relating to the computation and presentation of earnings per share. The objectives of the presentation of earnings per share are: i) to improve performance comparisons between different entities in the same reporting period and between different reporting periods for the same entity (IAS 33.1), and ii) to provide a measure of the interests of each ordinary share of an entity in the performance of the entity over the reporting period (IAS 33.11). However, it should be noted that earnings per share data have limitations because of the different accounting policies that may be used for determining ‘earnings’ (IAS 33.1).
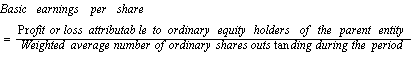
2.3.1. Basic Earnings per Share
- With reference to the IAS 33 (paragraph 10), Basic earnings per share should be calculated by dividing earnings attributable to ordinary equity holders of the entity (the numerator) by the weighted average number of ordinary shares outstanding (the denominator) during the period.
 The amounts attributable to ordinary equity holders of the entity should be adjusted for the after-tax effects of dividends on preferred stocks ‘‘preference dividends’’ (IAS 33: paragraph 12).The weighted average number of ordinary shares outstanding during the period is the number of ordinary shares outstanding at the beginning of the period, adjusted by the number of ordinary shares bought back or issued during the period multiplied by a time-weighting factor. The time-weighting factor is the number of days that the shares are outstanding as a proportion of the total number of days in the period (IAS 33.20). Ordinary shares shall be treated as outstanding from the date the holder of the shares has the right to share currently in profit or loss of the period (IAS 33.21). Shares issued during the period and shares reacquired during the period shall be weighted for the portion of the period that they were outstanding. The FAS 128 (paragraphs 36 and 37) allows presenting any other per share amounts in the notes to the financial statements. However, only earnings per share amounts for income from continuing operations and net income are required to be presented on the face of the statement. With reference to IAS 33 (paragraph 73), entities may compute other amounts of earnings per share if these items are presented in the income statement. However, in contrast to the FAS 128, extraordinary items are excluded from income statement (IAS 33). Also, the FRS 14 in UK allows firms to calculate any other version of earnings per share.
2.3.2. Effects of Number of Shares Outstanding
- Easton[40] suggests that management has discretion over the number of shares outstanding. They may choose to split their firm’s stock, to offer stock dividends and/or to undertake a reverse stock split. These splits could conceivably be used to change the price of shares without changing the economic characteristics of the firm. This management choice will also affect the scale and the magnitude of the per share measure of many firm attributes.
2.4. Choice of Deflator in Independent Variables
- Christie[11] have suggested that in both levels and returns studies, it is useful to deflate some (or all) of the independent variables by a measure of size such as number of shares, sales, market value of equity or book value of total assets and that the choice of deflator is a source of potential misspecification. He added that the correct deflator in returns studies is the market value of equity at the beginning of each period.Most of studies use price at the beginning of fiscal year as a factor of deflation of accounting data because dependent variable, ‘security return’ has stock price at the beginning of the period as the deflator. However, other studies use the stock price at the beginning of return interval. Das and Lev[28] for example, have used the stock price (at April 1) because the return interval begins three months after the beginning of the fiscal year and ending three months after the end of that fiscal year. The earnings measure in Hayn[23] is deflated by the share price at the end of fiscal year t-1, whereas, the return interval is commencing with the fourth month after the end of the firm’s fiscal year t-1. Hodgson and Clarke[18] have used the same return interval as Hayn[23], but deflated variables by the beginning-of-period share price.
3. Financial Reporting in Tunisia
- Until 1996, there were many differences between Tunisian Accounting Standards (TAS) and International Accounting Standards (IAS). Tunisian Accounting Standards changed dramatically on January 1, 1997, when the Law on the Enterprise Accounting System (EAS, hereafter) became effective. The EAS provides for establishment of the National Accounting Council (NAC, hereafter), which is an advisory body to the Ministry of Finance. The National Accounting Council’s (which took over from the Supreme Council of Accounting, created in 1975) mandate specifically encompasses the following tasks: review and opine on draft accounting standards including modalities for their application and accounting matters set out in draft laws and regulations.The EAS contains a Tunisian Accounting Conceptual Framework and Tunisian Accounting Standards. The Tunisian framework which is largely based on IASB’s Framework for the Preparation and Presentation of Financial Statements sets out the concepts that underlie the preparation and presentation of financial statements for external users. The Tunisian Accounting Standards which are inspired from IFRS are enacted by Orders issued by the Minister of Finance. The membership of the Council embodies a wide array of stakeholders: the Minister of Finance; the Governor of the Central Bank (or their respective designate); representatives from different ministries with an interest in accounting matters; the supreme audit institution, the accounting and audit profession, and the relevant regulators. The adoption of EAS has introduced considerable change in Tunisian accounting practice affecting the recognition and measurement of assets, liabilities and profit. In December 1996, fifteen accounting standards have been issued by the NAC.Since 1996, a lot of hard work is done by stock market regulators and accounting standards setters in improving the quality of financial reporting and increasing the transparency level in financial reporting. In 1999, the NAC have issued specific accounting standards for Undertakings for Collective Investment (TAS 16 to 18) and specific credit institution accounting standards (TAS 21 to 25) which are supplemented by Central Bank of Tunisia Regulations. Accounting standards related to Interim financial statements (TAS 19) and Research and Development (TAS 20) are also issued in the same year. In 2000, specific insurance accounting standards (TAS 27 – 31) have been issued. Tunisia enacted TAS 35, Consolidated Financial Statements, in 2003. TAS 35 is largely based on IAS 27, Consolidated Financial Statements and Accounting for Investments in Subsidiaries. Finally, standard on accounting for leases (TAS 41) has been recently issued in 2008.In October 2006, the World Bank and the International Monetary Fund (IMF) have prepared a report (final version) about the assessment of accounting and auditing practices in Tunisia (Reports on the Observance of Standards and Codes: ‘ROSC’). The assessment focused on the strengths and weaknesses of the accounting and auditing environment that influence the quality of corporate financial reporting. The ROSC documented that changes in Tunisian Accounting Standards can generally be considered to have been a massive step toward harmonization with IFRS which contributed to enhanced transparency. However, some fundamental differences remain, and TASs , are seriously flawed and are not adapted to modern securities market transparency requirements, and do not provide the general public with sufficient information about firms and still impede reliability and comparability. Selected differences between IFRS and TAS include the following: i) consolidation reporting requirements fall short of IAS, ii) TASs do not require that information be reported for business segments and geographical segments and, iii) TASs do not mention differed tax accounting as in IAS 12.The ROSC team made assessments of the compliance gap of financial statements prepared in accordance with TASs. The assessments revealed that financial statements are often influenced by taxation rules (Paragraph 42). To satisfy requirements of taxation authorities with regard to recognition of revenues and expenses, preparers of financial statements tend to follow tax rules rather than the accounting treatment required by TAS in various areas (e.g., depreciation, revenue recognition, provisions). The ROSC team concluded that transparency suffers from this emphasis on tax and deviation from applicable financial reporting standards. Finally, the report documented other significant issues which may raise questions about the quality of the statutory audit and in consequence the quality of accounting information including: i) until December 2003, consolidated financial statements were not presented, which has an adverse impact on the transparency of financial reporting; ii) accounting policies are not disclosed, and iii) earnings per share are not disclosed. Failure to disclose such information is particularly a concern with respect to listed companies.The report concluded that compliance with accounting requirements in Tunisia is not always effectively and consistently enforced due to deficiencies in the three core pillars of any enforcement regime, i.e., management, statutory auditors, and regulators. (i. e The Financial Market Council seeks to enforce accounting standards in general purpose financial statements of companies raising funds from the public but does not consistently demand restatement of accounting issues it discovers or impose sanctions on offenders). Further, managers and auditors do not consistently comply with accounting and auditing requirements, which adversely impact the usefulness of accounting information.The recent collapse of BATAM, quoted in Tunisian capital market, and the irregularities found in its accounting statements have brought to sharp focus the role of the external auditor. BATAM has now become a byword for bad management and auditing, after being placed under judicial administration in October 2002 for defaulting on approximately $220m of debts. This affair constitutes the first crisis of the Tunisian capitalism, which put in evidence a plurality of responsibility in particular that of the auditor which was imprisoned because he has not revealed the accounting irregularities. The affair of the company BATAM on 2002 and 2003 caused a decrease of portfolio value for small investors, not being protected in this date.It should be noted that a new Law on Strengthening the Security of Financial Relations was passed in October (2005) to reinforce the role of the Financial Market Board in the exercise of its mission and to enhance the transparency and quality of financial statements.In order to reinforce the independence of the companies statutory auditors, the Law stipulated principles dealing with rotation, misdemeanour, obligatory invitation of the statutory auditors to the board meetings and to the general assembly meetings, confirmation letter, and the co-statutory auditors. In case of co-statutory auditors, the same law stipulates that the statutory auditors should be fully independent. In case of noncompliance, a process is put in place to ensure full respect of the law and to discipline the failed auditors. The law established sanctions and penalties for managers and chief financial officer for providing to the statutory auditors inaccurate or incomplete information about the activities of the company or obstructing the work of auditors in the course of their missions. These sanctions include a six months of imprisonment and/or fine of 5000 dinars. The severe consequences for falsely attesting to firm financial statements may reduce management’s incentive to manipulate reported earnings in an attempt to reach earnings targets. The primary goal of these provisions was to improve the quality of corporate financial reporting and to restore investors’ confidence in the integrity of accounting information. As result, firms increased voluntary disclosure of their information security activities in the post-LSSFR periods. Aside from their six monthly and annual financial statements, listed companies began in 2006 to publish indicators of quarterly activity, in application of the terms of article of law n° 2005-96 of 18 October 2005 concerning enhanced security measures for financial relations.To evaluate the potential consequences of adopting the Tunisian Accounting Standards which are inspired from IFRS, this study uses firms listed on the Tunis Stock Exchange to provide some preliminary evidence on the usefulness of the key summary financial performance measures that are most concerned by the users of account especially investors. More precisely, we test whether the value relevance of accounting earnings amounts disclosed by firms listed in the Tunis Stock Exchange is affected by i) changing the earnings measurement in the numerator, and by ii) changing the number of shares used to calculate the amounts per share in the denominator.The research hypothesis to be tested in the present study is: ‘‘Changing the number of shares in the denominator of earnings per share influences the relationship between security returns and accounting earnings’’.This hypothesis is tested by comparing the explanatory power (as measured by the adjusted R²) of models regressing realized security returns on Domestic earnings per share (Domestic EPS) computed with reference to the Glossary of the Tunis Stock Exchange to models regressing realized security returns on Basic earnings per share (Basic EPS) computed with reference to the international standards (IAS 33, FAS 128 and FRS 14).
4. Data and Method
- The sample data were extracted from a total of 54 firms for which both share prices and accounting data were available for the years 1997 to 2008 on the Tunis Stock Exchange data base. The final sample consisted of 389 firm-years. As in Collins et al.,[7], to maintain comparability across estimations results, all tests presented here are based on this same sample. We use all observations, including extreme values of earnings and security returns.With reference to the Glossary of Tunis Stock Exchange, Domestic earnings per share (EPSGL) is defined as accounting earnings divided by the number of shares that compose capital at the end of the fiscal year : Xit / Nit. Basic earnings per share computed in accordance to IAS 33, (EPSIAS) is defined as earnings measure divided by the weighted average number of ordinary shares outstanding during the period: Xit / Nit.EPSGL is similar to EPSIAS, but instead of deflating earnings by number of ordinary shares at the end of fiscal year t, we deflate each earnings measure by the weighted average number of ordinary shares outstanding during the period. We can express the relation between EPSGL and EPSIAS as follows:
 | (3) |
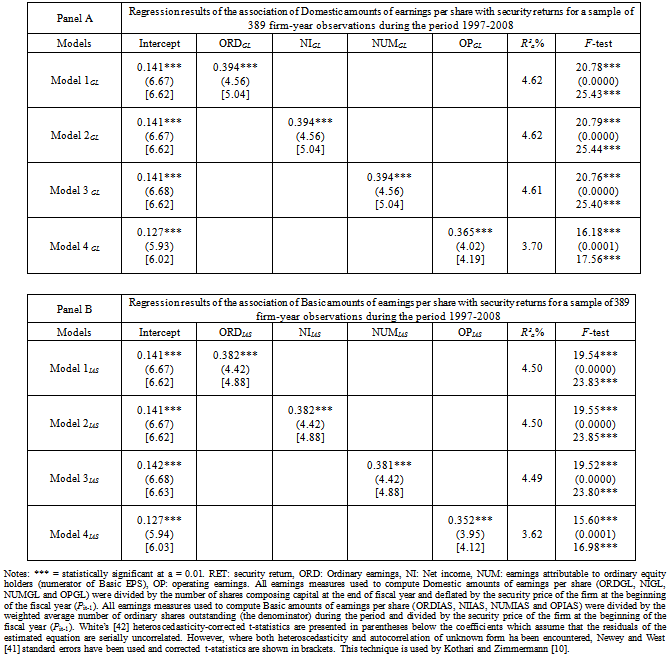
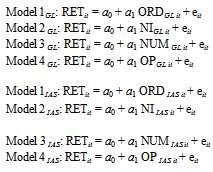 The variables used in the above models are defined as follows:• Security return (RET): realized security return for the fiscal year calculated according to equation (2);We have used four measures of earnings amounts to compute earnings per share:• Ordinary earnings (ORD): earnings before extraordinary items and effects of accounting changes;• Net income (NI): defined as ordinary earnings adjusted for extraordinary items.• Earnings attributable to ordinary equity holders of the entity (NUM): is used as numerator of the Basic earnings per share, computed following IAS 33 and FAS 128; • Operating earnings (OP): defined as earnings before non-operating items, exceptional and extraordinary items. It captures the results of the firms’ ongoing operations that will likely recur in the future. This measure is used by Charitou et al.,[16]. Per share amounts are computed either in accordance to domestic rules (with reference to the Glossary of the Tunis Stock Exchange) or with reference to the international standards. All per share amounts used in the empirical models are scaled by stock prices at the beginning-of-fiscal year;Prices are adjusted for stock splits and stock dividends when deflating by Pt-1 as in[10, 34].
5. Empirical Results
5.1. Effects of Changing Deflator on the Relationship between Earnings Measures and Security Returns
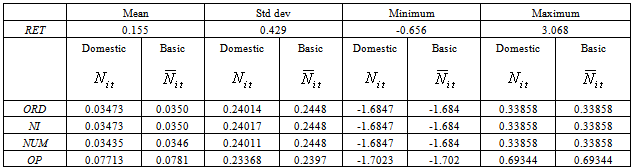
- This section discusses the empirical results that relate to the tests of the research hypothesis. Table 1 reports descriptive statistics for security return, Domestic and Basic earnings per share variables scaled by stock prices at the beginning of the period.Table 1 shows that: i) the sample mean of security return is 15.5%. This is comparable to the 16.56% that Kothari[15] reported; ii) maximum and minimum earnings per share value suggest that there is considerable variation in the distribution of earnings variables. This is important because the value relevance of accounting earnings measures may be affected by losses[23], iii) there is no significant difference in mean and standard deviation between Domestic and Basic earnings amounts per share. The ratio of Domestic earnings per share on Basic earnings per share is about 0.994. This suggests that changing the factor of scale ‘number of shares in denominator’ does not affect the mean magnitude and variability (as computed by standard deviation) of independent variables.
|
 ). All earnings per share amounts used in the empirical models were deflated by the security price of the firm at the beginning of the period (Pit-1). Prices are adjusted for stock splits and stock dividends.
|
|
5.2. Further Results
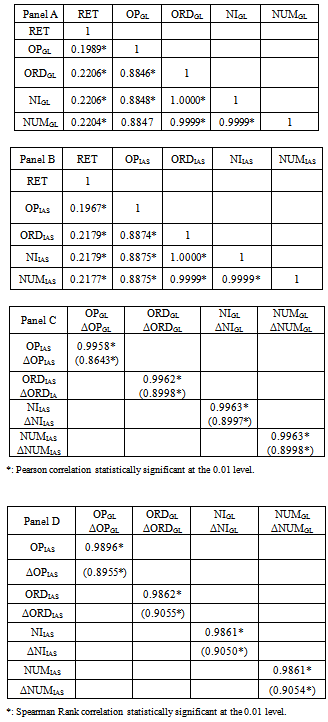
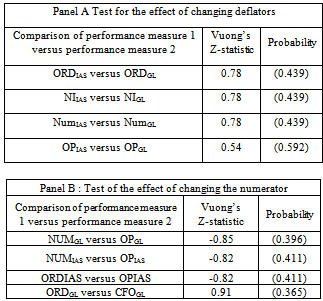
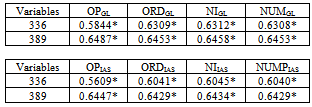
- We estimated the univariate models regressing security returns on the change of earnings measures to test the hypothesis of scale effects. Results (unreported) indicate that the coefficient on Domestic earnings change is 0.068 (not statistically significant) and the explanatory power is weak (R² = 0.11%). The coefficient on Basic earnings change is 0.174 (significant at the 0.05 level) and the explanatory power is about 0.7%. Although the use of weighted average number of ordinary shares outstanding in the denominator of earnings per share improves the relationship between earnings change and security returns, the explanatory power still weak. This weak explanatory power of earnings measures is perhaps due also to the low quality of accounting standards[44].We have tested whether the change of deflators is useful to better forecasting future earnings measures. We have computed the first-order correlation coefficient for each variable for two different samples. The first sample includes all observations for the period (1996-2008) and the second sample includes variables for the period (1997-2008) which results in 53 missing variables.
|
6. Concluding Remarks
- This study provides Tunisian empirical evidence on the association of security returns with earnings measures. More specifically, we have estimated the univariate regression of security returns on Domestic and Basic earnings per share (EPS). Domestic EPS is computed in accordance with the Glossary of the Tunis Stock Exchange by dividing reported earnings by the number of shares that compose capital at the end of fiscal year. Basic EPS is computed with reference of the international standards (IAS 33, FAS 128 and FRS 14) by dividing earnings by the weighted average number of ordinary shares outstanding. Although there is no significant difference between the two measures, results show that Domestic EPS is more associated with security returns than do Basic EPS. This suggests that changing deflator and computing earnings per share in accordance with international standards as recommended by the ROSC team (October 2006) does not improve the explanatory power of accounting data. However, to claim that the number of shares used as a denominator is a sufficient element of value relevance seems overstated. Our results are consistent with US and international evidences documenting a weak relationship between security returns and accounting data and contributes to the debate over the mandatory adoption of IFRS and the value relevance of accounting information reported under IFRS[45].
Notes
1If earnings are transitory,the expected value would be 1.Assuming that some earnings news is transitory and some is permanent would lead to a coefficient lying between these values.
References
| [1] | Filip, A and Raffournier, B,. (2010), ‘The value relevance of earnings in a transition economy: The case of Romania. The International Journal of Accounting 45, 77–103. |
| [2] | Beisland, L. A (2009), ‘A review of the Value relevance literature’, The Open Business Journal, Vol 2, pp 7-27. |
| [3] | Barth, M. E. and Clinch, G. (2009) ‘Scale Effects in Capital Markets-Based Accounting Research’, Journal of Business Finance and Accounting, Vol. 36, No. 3-4, pp.253-288. |
| [4] | Easton, P., and G. Sommers (2003) ‘Scale and the scale effect in market-based accounting research’, Journal of Business Finance and Accounting, Vol.30, pp.25-55. |
| [5] | Ota, K. (2003) ‘The impact of price and return models on value relevance studies: a review of theory and evidence’, Accounting Research Journal, Vol.16, No.1, pp.6-20. |
| [6] | Barth, M. E. and Kallapur, S. (1996) ‘The effects of cross-sectional scale differences on regression results in empirical accounting research’, Contemporary Accounting Research, Vol. 13, No. 2, pp.527-567. |
| [7] | Collins, D., Maydew, E. and Weiss, I. (1997) ‘Changes in the value-relevance of earnings and book values over the past forty years’, Journal of Accounting and Economics, Vol.24, pp. 39-67. |
| [8] | Basu, S. (1997) ‘The conservatism principle and the asymmetric timeliness of earnings’, Journal of Accounting and Economics, Vol. 24, pp. 3-37. |
| [9] | Easton, P., Shroff, P. and Taylor, G. (2000) ‘Permanent and transitory earnings, accounting recording lag and the earnings coefficient’, Review of Accounting Studies, Vol.5, No.4, pp.281-300. |
| [10] | Kothari, S. and Zimmerman, J. (1995) ‘Price and return models’, Journal of Accounting and Economics, Vol.20, pp. 155-192. |
| [11] | Christie, A., 1987, On cross-sectional analysis in accounting research, Journal of Accounting & Economics 9, 231-258. |
| [12] | Beaver, W., Griffin, P and Landsman, W. (1982) ‘The incremental information content of replacement cost earnings, Journal of Accounting and Economics, Vol. 4, pp. 15-39. |
| [13] | Lustgarten, S (1982)The impact of replacement cost disclosure on security prices: New Evidence, Journal of Accounting and Economics, Vol 4, N° 2, Pages 121–141. |
| [14] | Brown, L., Griffin, P., Hagerman, R., Zmijewski, M., 1987b, An evaluation of alternative proxies for the market’s expectation of earnings, Journal of Accounting & Economics 9, 159-193. |
| [15] | Kothari, S. (1992) ‘Price-earnings regressions in the presence of prices leading earnings: earnings level versus change specifications and alternative deflators’, Journal of Accounting and Economics, Vol.15, pp.173-202. |
| [16] | Charitou, A., Clubb, C. and Andreou. A, (2001) ‘The Effects of Earnings Permanence, Growth and Firm Size on the Usefulness of Cash Flows and earnings in Explaining Security returns: Empirical Evidence for the UK’, Journal of Business Finance and Accounting, Vol.28, No.5-6, pp.563-94. |
| [17] | Habib, A. (2008) ‘The role of accruals and cash flows in explaining security returns: Evidence from New Zealand’, Journal of International Accounting, Auditing and Taxation, Vol.17, pp.51-66. |
| [18] | Hodgson, A. and Stevenson-Clarke, P. (2000) ‘Earnings, cash flows and returns: Functional relations and the Impact of Firm Size’, Accounting and Finance, Vol.40, pp.51-73. |
| [19] | Ciftci, M ad Cready, W.M. (2011), ‘Scale effects of R&D as reflected in earnings and returns, Journal of Accounting and Economics 52, 62–80. |
| [20] | Collins, D., Kothari, S., (1989), An analysis of inter-temporal and cross-sectional determinants of earnings response coefficients, Journal of Accounting & Economics 11, 143-181. |
| [21] | Easton, P. and Harris, T. (1991) ‘Earnings as an explanatory variable for returns’, Journal of Accounting Research, Vol.29, pp.19-36. |
| [22] | Martikainen (1997) ‘Accounting losses and earnings response coefficients: The impact of leverage and growth opportunities’, Journal of Business Finance and Accounting, Vol.24, No.2, pp.277-291. |
| [23] | Hayn, C. (1995) ‘The information content of losses’, Journal of Accounting and Economics, Vol.20, pp.125-153. |
| [24] | Subramanyam, K. (1996) ‘The pricing of discretionary accruals’, Journal of Accounting and Economics, Vol.22, pp.249-281. |
| [25] | Francis, J. and Schipper, K. (1999) ‘Have financial statements lost their relevance?’ Journal of Accounting Research, Vol.37, No.2, pp.319-52. |
| [26] | Cheng, C.S.A., W.S. Hopwood, and J.C. McKeown, (1992) ‘Nonlinearity and specification problems in unexpected earnings response regression models’, The Accounting Review, Vol.67, No. 3, pp.579-598. |
| [27] | Freeman, R. and Tse, S. (1992) ‘A nonlinear model of security price responses to unexpected earnings’, Journal of Accounting Research, Vol.30, pp.185-209. |
| [28] | Das, S. and Lev, B. (1994) ‘Nonlinearity in the return-earnings relation: tests of alternative specifications and explanations’, Contemporary Accounting Research, Vol.11, pp. 353-79. |
| [29] | Outa, E., R (2011), ‘The Impact of International Financial Reporting Standards (IFRS) Adoption on the Accounting Quality of Listed Companies in Kenya. International Journal of Accounting and Financial Reporting, Vol. 1, No. 1 |
| [30] | Alali, F.A. and Foote, P.S. (2012), ‘The Value Relevance of International Financial Reporting Standards: Empirical Evidence in an Emerging Market, The International Journal of Accounting 47, 85–108. |
| [31] | Dimitropoulos, P. E and Asteriou, D., (2009), ‘The Relationship between Earnings and Stock Returns: Empirical Evidence from the Greek Capital Market’. International journal of Economics and finance. Vol 1 N°1. |
| [32] | Scott, W. (2000) Financial Accounting Theory. (Canada: Prentice-Hall). |
| [33] | Holthausen, R. and Watts, R. (2001) ‘The relevance of the value-relevance literature for financial accounting standard-setting’, Journal of Accounting and Economics, Vol.31, No.1–3, pp.3–75. |
| [34] | Dechow, P. (1994) ‘Accounting earnings and cash flows as measures of firm performance: The role of accounting accruals’, Journal of Accounting and Economics, Vol.18, pp. 3-42. |
| [35] | Lev, B. (1989) ‘On the usefulness of earnings and earnings research: lessons and directions from two decades of empirical research’, Journal of Accounting Research, Vol.27, pp.153-201. |
| [36] | Kothari, S. (2001) ‘Capital markets research in accounting’, Journal of Accounting and Economics, Vol.31, No. 1–3, pp.105–231. |
| [37] | Mohammady, A (2010), ‘Earnings Quality Constructs and Measures’ The Business Review, Cambridge, Vol. 16, 1. |
| [38] | Lev, B., and Zarowin, P. (1999) ‘The boundaries of financial reporting and how to extend them’, Journal of Accounting Research, Vol.37, pp.353-385. |
| [39] | Chen, P and Zhang, G (2007), ‘How do accounting variables explain stock price movements? Theory and evidence, Journal of Accounting and Economics 43, pp. 219–244. |
| [40] | Easton, P. (1998) ‘Discussion of revalued financial, tangible, and intangible assets: association with share prices and non-market based Value Estimates’, Journal of Accounting Research, Vol. 36, pp.235-247. |
| [41] | Newey, W. and West, K. (1987) ‘A simple positive semi-definite, heteroscedasticity and autocorrelation consistent covariance matrix’, Econometrica, Vol.55, pp.703-708. |
| [42] | White, H. (1980) ‘A heteroscedasticity consistent covariance matrix estimator and a direct test for heteroscedasticity’, Econometrica, Vol.48, pp.817-838. |
| [43] | Vuong, Q., (1989). Likelihood ratio tests for model selection and non-nested hypotheses. Econometrica 57, 307–333. |
| [44] | Barth, M. E, Landsman, W and ,Lang, M, (2008), International Accounting Standards and Accounting Quality, Journal of Accounting Research Vol. 46 No. 3 June 2008. |
| [45] | Barth, M.E, Landsman, W. R, Lang, M and Williams, C (2012), ‘Are IFRS-based and US GAAP-based accounting amounts comparable? Journal of Accounting and Economics. |
| [46] | Dumontier, P. and Raffournier, B. (2002) ‘Accounting and capital markets: a survey of the European evidence’, European Accounting Review, Vol.11, No.1, pp.119–51. |