-
Paper Information
- Next Paper
- Paper Submission
-
Journal Information
- About This Journal
- Editorial Board
- Current Issue
- Archive
- Author Guidelines
- Contact Us
International Journal of Finance and Accounting
p-ISSN: 2168-4812 e-ISSN: 2168-4820
2013; 2(4): 185-198
doi:10.5923/j.ijfa.20130204.01
Economic Value Added and Shareholders’ Wealth Creation: Evidence from a Developing Country
 Abstract
 Reference
 Full-Text PDF
 Full-text HTML
Madan Lal Bhasin
Department of Accounting & Finance, Bang College of Business, KIMEP University, Dostyk Building, 2 Abai Avenue, Almaty 050010, Republic of Kazakhstan
Correspondence to: Madan Lal Bhasin, Department of Accounting & Finance, Bang College of Business, KIMEP University, Dostyk Building, 2 Abai Avenue, Almaty 050010, Republic of Kazakhstan.
| Email: |  |
Copyright © 2012 Scientific & Academic Publishing. All Rights Reserved.
It is universally accepted that the goal of financial management is to maximise the shareholder’s value. In recent years, Economic Value Added (EVA) framework is gradually replacing the traditional measures of financial performance on account of its robustness and its immunity from creative accounting. Following this global trend, several companies in India are focusing on shareholders value creation. The main objectives of this study were: to examine whether the sample companies has been able to generate value for its shareholders; to analyze the effectiveness of EVA over the conventional measures of corporate performance, and to indicate whether the significant differences exists between the actual values of EVACE and time factor of the sampled companies. Moreover, it also seeks to examine the value-creation strategies of selected Indian companies by analysing whether EVA better represents the market-value of companies in comparison to conventional performance measures. In this regards, EVA and the conventional measures of corporate performance are analysed. Moreover, various statistical tools like ANOVA, trend analysis and regression analysis are used for analysing the data. The study indicates that “there is no strong evidence to support Stern Stewart’s claim that EVA is superior to the traditional performance measures in its association with MVA.”
Keywords: Economic Value Added, Market Value Added, Corporate Performance Measures, Shareholders Wealth Creation, Value Based Management, Developing Country
Cite this paper: Madan Lal Bhasin, Economic Value Added and Shareholders’ Wealth Creation: Evidence from a Developing Country, International Journal of Finance and Accounting , Vol. 2 No. 4, 2013, pp. 185-198. doi: 10.5923/j.ijfa.20130204.01.
Article Outline
1. Introduction
- In the present era of globalization, companies of emerging economies are facing new challenges. Severe competition, rapid technological change, wide volatility in real and financial markets etc., have increased the burden on managers to deliver superior performance, and value for their shareholders. The ultimate role of managers is often presented as increasing shareholder value. Although managers exist to create value for their owners, corporate managers do not always act to maximize shareholder value, because of perceived conflicts with other goals. Shareholder value does not necessarily conflict with good citizenship toward employees, customers, suppliers, the environment and the local community. Companies that respect those constituencies tend to outperform others, suggesting that value can be delivered to shareholders only if it is first delivered to other constituencies. The growth of the Indian capital market has increased the pressure on the companies to consistently perform better. The companies, which gave the lowest preference to shareholders curiosity, are now bestowing the utmost preference to them. Moreover, shareholders activism has reached to unprecedented level partially due to integration of financial markets and partially due to regulatory reforms (in terms of disclosure requirements and investor protection) and this has led to increased pressure on firms to increase shareholders value ‘consistently’. Just earning profit is not enough, a business should earn sufficient profit to cover its cost of capital and create wealth. From the economist’s viewpoint, value is created when management generates revenue over and above, the economic costs to generate these revenues. Costs come from four sources: employee wages and benefits; material, supplies, and economic depreciation of physical assets; taxes; and the opportunity cost of using the capital. Under this value-based view, value is only created when revenues exceed all costs including a capital charge. This value accrues mostly to shareholders because they are the residual owners of the firm. Shareholders expect management to generate value over and above the costs of resources consumed, including the cost of using capital. If suppliers of capital do not receive a fair return to compensate them for the risk they are taking, they will withdraw their capital in search of better returns, since value will be lost. A company that is destroying value will always struggle to attract further capital to finance expansion since it will be hamstrung by a share price that stands at a discount to the underlying value of its assets and by higher interest rates on debt or bank loans demanded by creditors.Wealth creation refers to changes in the wealth of shareholders on a periodic (annual) basis. Applicable to stock exchange listed firms, changes in shareholder wealth are inferred mostly from changes in stock prices, dividends paid, and equity raised during the period. Since stock prices reflect investor expectations about future cash flows, creating wealth for shareholders requires that the firm undertake investment decisions that have a positive net present value (NPV). Although used interchangeably, there is a subtle difference between value creation and wealth creation. The value perspective is based on measuring value directly from accounting-based information with some adjustments, while the wealth perspective relies mainly on stock market information. For a publicly traded firm these two concepts are identical when (a) management provides all pertinent information to capital markets, and (b) the markets believe and have confidence in management.Shareholder’s wealth (or value) maximization is a well- accepted objective among corporate finance managers in recent years. The shareholders wealth is measured by the returns they receive on their investment. It can either be in forms of dividends, or in the form of capital appreciation, or both. Capital appreciation depends on the changes in the market value of the stocks of which market value is the dominant part[1]. While the principle that the fundamental objective of the business-corporation is “to increase the value of its shareholders’ investment is widely accepted, there is substantially less agreement about how this is accomplished.” Several studies have been carried to find out what influences the share/market price of a company. In this context, author[2] observes: “As the lenders (debt holders and others) can protect themselves contractually, the objective can be narrowed down to maximizing stockholders value, or stockholders wealth. When financial markets are efficient, the objective of maximizing stockholder wealth can be narrowed even further: to maximizing stock prices.”Even though ‘stock’ price maximization as an objective is the ‘narrowest’ of the value maximization objectives, it is the most prevalent one. It is argued that the stock prices are the most observable of all measures that can be used to judge the performance of a publicly traded firm. Besides this, the stock price is a real measure of stockholder wealth, since stockholders can sell their stock and receive the price now. Should we accept that the stock price maximization leads to firm value maximization? The market value of stocks depends upon number of factors ranging from company-specific to market-specific. Financial information is used by various stakeholders to assess firm’s current performance and to forecast the future as well[3].Can we make managers responsible for the stock price maximization? While the responsibility of firm value maximization has to be fixed with the managers, using stock prices as a measure of periodic measure of corporate performance poses a serious problem[4]. While many argue that the stock prices are not under the full control of the managers, there are many others who believe that stock price maximization leads to a ‘short-term’ focus for manager. Indeed, stock prices of a corporation are determined by a multitude of agencies (like by security traders, financial institutional investors, short-term investors, and financial analysts) all of whom hold the stock for short-periods, and spend their time trying to forecast next quarter’s earnings[5].To generate value for shareholders, “value-based management (VBM)” system has been developed, which seeks to integrate ‘financial’ hypotheses with ‘strategic’ and ‘economic’ philosophy of the company. Taggart et al., first coined the term VBM and he suggested a framework that links the company’s strategy to its value in capital market. VBM have identified five key institutional value drivers(viz., governance, strategic planning, resource allocation, performance management, and top management compensation) that are essential for sustainable value creation. The VBM approach uses metrics at different levels that are aligned to the institutional drivers, key functions and processes. “EVA as the centre-piece of a strategy implementation process that can be linked to all the key functions and processes listed above[6].” An appropriate measure of corporate performance, on the one hand, should be highly correlated to shareholder return and, on the other hand, should be able to signal the extent of periodic wealth creation[7].With increased competition and greater awareness among investors, new and innovative ways of measuring corporate performance are being developed. A search for such a measure had been the trigger for the rapidly growing literature on VBM. Modern value-based performance measures (such as economic value added (EVA), market value added (MVA), cash flow return on investment (CFROI), cash value added (CVA), discounted economic profits (DEP), shareholders value added (SVA) etc., have been developed recently by various consulting companies to gauge the real performance of companies, and also to shift the focus from accounting earnings to cash flows[8]. In short, VBM enables a business to achieve desired results and to create shareholder value.EVA as a Superior Performance MeasureThe term ‘EVA’ is the acronym for “Economic Value Added” and is a registered trade mark of Stern Stewart & Co. of USA. Really speaking, EVA is a financial performance measure that most accurately reflects company’s true profit[9]. EVA is calculated “after subtracting the cost of equity capital and debt from the operating profits.” EVA is nothing but a new version of the age-old “residual income(RI)” concept recognized by economists(Alfred Marshall) since the 1770’s. EVA is based on RI concept which states that wealth is created when revenues are sufficient to cover a firm’s operating costs and cost of capital[10,11]. Unless it covers its cost of capital, it does not create wealth. By measuring the value added over all costs, EVA measures, in effect, the productivity of all factors of production.EVA is the performance measure most directly linked to the creation of shareholder wealth overtime. EVA is the single measure of performance, enabling investors to identify investment opportunities and motivate managers to make value added business decisions. “EVA is a superior measure as compared to other performance measures on four counts: (a) it is nearer to the real cash flows of the business entity; (b) it is easy to calculate and understand; (c) it has a higher correlation to the market value of the firm, and (d) its application to employee compensation leads to the alignment of managerial interests with those of the shareholders, thus minimizing the supposedly dysfunctional behaviour of the management[12]. The last two merits can be considered as a reflection of the first two. If EVA truly represents the real cash flows of a business entity and it is easy to calculate and understand, then it automatically follows that it should be closely related to the market valuation and it should minimize the dysfunctional behaviour of the management when used as an incentive measure. In other words, close relation to market valuation and convergence of managerial interests with shareholders interests is a vindication of EVA as a superior metric. “When EVA becomes the singular focus of all decisions, it establishes clear and accountable links between strategic thinking, capital investments (economic returns), operating decisions (accounting returns), and shareholder value (shareholder returns)”[13].In fact, EVA is a performance metric that captures the true economic profit of a company. Earnings, earnings per share, and earnings growth are misleading measures of corporate performance and that the best practical periodic performance measure is EVA. EVA is the financial performance measure that comes closer than any other measure in capturing the true economic profits of an enterprise. EVA also is the performance measure most directly linked to the creation of shareholder wealth overtime. Using the results from in-house research by the company, Stewart further adds that “EVA stands out well from the crowd as the single-best measure of wealth creation on a contemporaneous basis and is almost 50% better than its closest accounting-based competitor(including EPS, ROE and ROI) in explaining changes in shareholder wealth”[12]. Truly speaking, EVA is based on the concept that “a successful firm should earn at least its cost of capital. Firms that generate higher returns than the cost of financing would benefit the shareholders and result in increased shareholders wealth.” EVA was developed to help managers to incorporate two basic principles of finance in their decision-making, namely, maximizing shareholders’ wealth and investors’ expectations that differ from cost of capital. Unlike conventional measures of profitability, EVA helps the management and other stakeholders’ to understand the capital charges. It is an ‘integrated’ approach to all decisive areas of financial management system. Indeed, many highly regarded corporations (including Coca-Cola, AT&T, Quaker Oats, Briggs & Stratton, CSX, and Toys R Us) have switched to EVA for investment decisions, capital reallocation, business combinations, and performance evaluation of managers and divisions[14].Some criticize EVA as being a very complex framework that relies on complicated calculations. The “Cost of Capital” calculation is particularly difficult to calculate and prone to errors that lead to grossly misleading results. Also, EVA is not easily understood by the majority of employees because of its complex framework and calculations. However, some critics[15] have extensively elaborated and finally, refuted the claim that EVA is a superior performance measure on all these four counts. The main strength of the EVA is that it offers an indicator of wealth creation that aligns the goals of plant or division managers to the general corporate goals. However, it also has certain limitations, particularly when it comes to size differences, financial orientation, short-term orientation and results orientation. In the light of these shortcomings, managers would do well to complement EVA with other financial measures to create a balanced pool of measures that cover all performance areas relevant to the success of the organization[16].Moreover, Bennett Stewart in his book (The Quest for Value) describes EVA as: “(1) operating profits less the cost of all capital employed to produce those earnings, (2) one and the same thing as Net Present Value, (3) the only measure to tie directly to intrinsic market value, and (4) the fuel that fires up a premium in the stock market value”[9]. The selling point of EVA is that it considers economic profits and economic capital in order to know the “value created and destroyed” by an organization during a particular period. Economic profit and economic capital is calculated by making certain adjustments into the accounting profits. However, there exist anomalies in the academic literature about the number of adjustments required to reach economic profit and economic capital. An author[17] asserts that “EVA provides a valuable framework for converting wrong accounting numbers into correct estimates of value…Accounting adjustments are much ado about nothing.” Stern-Stewart and Company had suggested 164 such accounting adjustments to convert Generally Accepted Accounting Principles (GAAP) profits to economic profits[13]. From the study of literature, it can be concluded that “accounting adjustments to EVA range between 5 and 16. The nature and number of adjustments differ from one firm to another based on facts, such as, sector, accounting policy followed by the company and the country GAAP. There is no universal set of adjustments or method followed in practice for the calculation of EVA”[18]. Another important point in calculation of EVA is “calculation of the weighted average cost of capital.” As suggested by various researchers, cost of equity capital under EVA may be calculated using capital assets pricing model (CAPM). Various researchers[19, 20] have used CAPM to calculate the cost of equity thereby establishing the empirical validity of EVA calculation. The EVA based performance measurement system is the basis on which the company should take appropriate decisions related to the choice of strategy, capital allocation, merger & acquisitions, divesting business and goal setting. While deciding resource allocation it becomes necessary to appreciate the EVA impact of such decision[21]. A firm can motivate its managers to direct their effort towards maximizing the value of the firm only by, first measuring the firm value correctly and secondly, by providing incentives to managers to create value. Both are interdependent and they complement each other[22]. The paper examines the effectiveness of Economic Value Added (EVA) in improving the performance of the firm as a whole and also as a measure of performance. Finally, it can be concluded that irrespective of whether EVA is linked to share prices or not, EVA style of managing companies with the goal of value enhancement is here to stay.”Corporate performance measurement is one of the emerging areas of research in accounting & finance among the researchers all over the world. Therefore, the present study examines whether EVA has got any association with the shareholders wealth creation. The rest of the paper is structured as follows. Section 2 presents a brief review of the existing literature relevant to this study. Section 3 describes the objectives of the study and testable hypotheses are defined in section 4. The sources of data and methodology employed for the present study is explained in section 5. Section 6 describes the empirical findings and discussions based on which the final section 7 gives the summary of the paper along with the conclusions.
2. Review of Literature
- During the last two decades, several researchers, corporate professionals, and consultant firms engaged in the field of accounting & finance have been paying their close attention on the EVA, and admitting the limitations of ‘traditional’ measures of performance. But majority of them have drawn inferences about the theoretical discussion of it and a few of them have concentrated to make the EVA concept as a legitimate tool of corporate financial performance measurement. The present section briefly thrashes out the notable research works carried out so far by the leading scholars in the field.Easton[23] observed that “EVA is an increasingly popular corporate performance measure that is often used by companies not only for evaluating performance, but also as a basis for determining incentive pay.” Like other performance measures, EVA attempts to cope with the basic tension that exists between the need to come up with a performance measure that is highly co-related with shareholders wealth, but at the same time somewhat less subject to the random fluctuations in stock prices. This is a difficult tension to resolve and it explains the relatively low correlation of all accounting based performance measures with stock returns at least on a year to year basis. EVA is a powerful new management tool that has gained growing international acceptance as the standard of corporate governance. It serves as the centre-piece of a completely integrated framework of financial management and incentive compensation[12]. In essence, EVA is a way both to legitimize and to institutionalize the running of a business in accordance with basic micro-economics and corporate finance principles. The experience of a long list of adopting companies throughout the world strongly supports the notion that an EVA system, by providing such an integrated decision-making framework, can refocus energies and redirect resources to create sustainable value for companies’ customers, employees, and shareholders and for management.O’Byrne[24] concluded that “EVA is better than other measurements, such as Net Operating Profit after Tax (NOPAT) and cash flows.” Moreover, Peterson and Peterson (1996) analysed traditional and value-added measures of performance and their relationship with stock returns. Their findings state that “traditional measures are not empirically less related to stock returns than return on value added measures.” Similarly, Luber[25] confirmed that “a positive EVA over a period of time will also have an increasing MVA, while negative EVA will bring down MVA as the market loses confidence in the competence of a company to ensure a handsome return on the invested capital.” However, Grant[26] found that “EVA concept might have everlastingly changed the way real profitability is measured. EVA is a financial tool that focuses on the difference between company’s after tax operating profit and its total cost of capital.”Chen and Dodd[27] reported that “EVA measure provides relatively more information than the traditional measures of accounting profits.” They also found that EVA and RI(Residual Income) variables are highly correlated and identical in terms of association with stock returns. However, KPMG-BS study[28] assessed top 100 companies on EVA, Sales, PAT and MVA criteria. The Survey has used the BS-1000 list of companies using a composite index comprising sales, profitability and compounded annual growth rate of those companies covering the period 1996-97. “Sixty companies have been found able to create positive shareholder value whereas 38 companies have been found to destroy it.” Thenmozhi[29] made a ‘comparative’ study of how the traditional performance measures are comparable to EVA. Working on a sample of 28 companies for a period of three financial years, he found that “only 6 out of the 28 companies have positive EVA while the others have negative. The EVA as a percentage of Capital Employed has been found to indicate the true return on capital employed.” Comparing EVA with other traditional performance measures, the study indicates that all the companies depict a rosy picture in terms of EPS, RONA and ROCE for all the three years. The study shows that “the traditional measures do not reflect the real value of shareholders and EVA has to be measured to have an idea about the shareholders value.” Similarly, Bao and Bao[30] revealed that “EVA is positively and significantly correlated with the firm value.” Moreover, Banerjee[31] attempted to find out whether Market Value of the firm is the function of current operational value (COV) and Future Growth Value(FGV). Based on the analysis of his data, he comes to the conclusion that “in many cases there was a considerable divergence between MVA and the sum total of COV and FGV.”Ray[32] observed that “the missing link between EVA and improved financials is actually productivity.” EVA can be a powerful tool when properly applied. It allows a firm to ascertain where it is creating value and where it is not. More specifically, it allows a firm to identify where the return on its capital is outstripping the cost of that capital. For those areas of the firm where the former is indeed greater than the latter EVA analysis then allows the firm to concentrate on the firm’s productivity in order to maximize the value created of the firm. Finally, as investors buy more shares in the firm in order to have more claims on its increased value, they automatically bid up and eventually maximize the firms share price. Moreover, Mangala and Simpy[33] discussed the relationship between EVA and Market Value among various companies in India. The results of the analysis “confirm Stern & Stewart’s hypothesis and concluded that the company’s current operational value was more significant in contributing to change in market value of share in Indian context.”Fernandez[34] examined the correlation between EVA and MVA of 582 American companies for the period 1983-97. It was shown that for 296 firms in the sample the “changes in the NOPAT had higher correlation with changes in MVA than the EVA, while for 210 sample firms the correlation between EVA and MVA was negative.” Worthington and West[35] provided ‘Australian’ evidences regarding the pooled time-series, cross-sectional data on 110 Australian companies over the period 1992-1998 is employed to examine information content of EVA and concluded that “stock returns to be more closely associated with EVA than residual income, earnings and net cash flow.” De Wet[36] conducted a study on EVA–MVA relationship of 89 Industrial firms of ‘South Africa’ and found that “EVA did not show the strongest correlation with MVA.”Rakshit[20] analysed the financial performance of ‘Dabur India Limited’ by using EVA. He concluded that “the EVA based performance measurement system is the basis on which the company should take appropriate decisions related to the choice of strategy, capital allocation, merger & acquisitions, divesting business and goal setting.” While deciding resource allocation it becomes necessary to appreciate the EVA impact of such decision. The management accountant is expected to successfully transform traditional management system into value based management system. Similarly, Irala[37] examined whether EVA has got a better predictive power relative to the traditional accounting measures, such as, EPS, ROCE, RONW, Capital Productivity and Labour Productivity. “Using the dataset for six years across 1,000 companies, the results supported the claim that EVA is the better predictor of market value compared to the other accounting measures.” In another study by Misra and Kanwal[38,39] about Indian companies argued that accounting-based metrics are misleading measures of corporate financial performance as they are vulnerable to ‘accounting distortions’. Results of their study reveal that “EVA(per cent) is the most significant determinant of MVA as it explains the variations in share value better than the other conventional accounting-based measures of firms’ financial performance.”Kyriazis and Anastassis[40] in their study of ‘Greek’ firms concluded that “relative information content tests reveal that net and operating income appear to be more valuable than EVA. EVA components add only marginal information content as compared to accounting profit.” However, Ismail[41] provides evidence regarding EVA and company performance in ‘Malaysia’. The study sought to explain the ability of EVA, compared to traditional tools, in measuring performance under various economic conditions. The study revealed that “EVA is also able to correlate with stock returns and is superior in explaining the variations in the stock returns as compared with traditional tools under varying economic conditions.” Similarly, Chary and Mohanty[18] explained the concept of value from the perspectives of stakeholders and shareholders. Using a case-based approach they illustrated different methods of computing shareholder value. Lee and Kim[42], however, introduced ‘Refined’ EVA(REVA) to the hospitality industry and compared it to EVA, MVA and other traditional accounting measures. The study provides interesting and meaningful findings that “REVA and MVA can be considered good performance measures throughout the three hospitality sectors (i.e., hotel, restaurant and casino). According to the findings, REVA and MVA significantly explain the market-adjusted return by presenting positive coefficients.”Kaur and Narang[11] examined the shareholder value creation using two value-based metrics of financial performance viz., EVA and MVA for a sample of 104 Indian companies. The study “supported the claim that EVA influences the market value of shares.” Moreover, Vijaykumar[43], in his study supports the hypothesis of Stern & Stewart’s that “MVA of firms was largely positively associated with EVA in all selected sector of Indian Automobile industry.” Kumar and Sharma[10] examined a sample of 873 firms-year observations from the Indian market and applied ‘pooled’ ordinary least- square regression to test the relative and incremental information content of EVA and other accounting-based measures in explaining the market value added. Recently, Vijaykumar[7, 44] in his study, using ‘factor-analytic’ approach, attempted to find out whether EVA has got a better predictive power of selected automobile companies in India. The results of his study showed that “out of eight variables, three factors have been extracted and these three factors put together explain 69.902 per cent of the total variance. Further, sales and profit after tax are found to have a stronger relationship with EVA.” The objective of the study, done by Patel and Patel[45], was “to determine shareholders value (in terms of EVA) of selected private-sector banks during the last five years, i.e. since 2004-05 to 2009-2010. For none of the bank EVA has impact on share price, except EVA by Kotak Mahindra bank did have significant impact on stock price of Kotak Mahindra bank.”From this brief review of literature, it is evident that the scholars have given much importance to EVA while measuring performance, or value creation of any company. Now, the business world is moving towards greater transparency and superior corporate governance. Thus, shareholder value creation aspect is of utmost importance in the present scenario of corporate performance and management. Therefore, one cannot deny the present necessity of an exclusive study in this field. Moreover, we believe that it is important to make a further contribution to the literature by conducting a new study using the Indian market and find out the empirical validity of Stern & Stewart’s EVA hypothesis.
3. Objectives of the Study
- The examination of literature on the efficacy of various performance measures brings two important issues. First and foremost is that most of the research on EVA and its superiority has been from the USA and other developed markets. There is an obvious requirement to examine the usefulness of EVA along with traditional financial performance measures in an alternative institutional setup. However, less evidence is available about developing market. This motivates us to analyse the highly controversial but important Stern- Stewart’s assertion regarding the superiority of EVA in the Indian context, and contribute to the existing literature. Second, empirical evidences about EVA and its superiority are mostly inconclusive and controversial. So, there is further need to examine Stern-Stewart hypothesis and help in establishing the empirical validity of EVA.Though some leading Indian companies have already joined the band wagon of their American counterparts in adapting the EVA-based corporate performance systems, many other are hesitating as there is no strong evidence that the EVA system works in India[46]. In the above context, there is an immediate need for a comprehensive and elaborate study to ascertain whether the above claims hold in the Indian context.The present study aims to achieve the following objectives:(a) To examine whether the sample companies has been able to generate value for its shareholders;(b) To analyse the effectiveness of Economic Value Added over the conventional measures of corporate performance;(c) To figure out the relationship between EVA, RONW, ROCE and EPS; and(d) To indicate whether the significant differences, if any, exists between the actual values of EVACE and time factor of the sampled companies.
4. Hypotheses Development
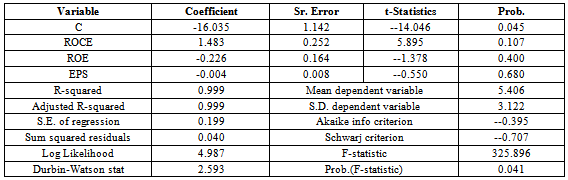
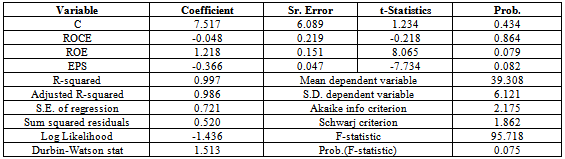
- One of the purposes of this study is to provide evidences about the superiority of EVA over the traditional performance measures. To achieve this, relative and incremental information content of EVA and traditional performance measures are analysed. Relative information content comparisons examine if one measure provides greater information content than another. On the other hand, incremental information content comparisons assess whether one measure provide more information content than another[47]. Hence, as part of the research methodology, the following hypotheses are put to test:Hypothesis 1:H0 There is no significant difference between mean values of EVACE, ROCE, ROE and EPS.H1 There is a significant difference between mean values of EVACE, ROCE, ROE and EPS.Hypothesis 2:H0 There is no significant difference between actual and trend value of EVACE.H1 There is a significant difference between actual and trend value of EVACE.Hypothesis 3:H0 There is no significant impact of ROCE, ROE and EPS on EVACE.H1 There is a significant impact of ROCE, ROE and EPS on EVACE.
5. Sources of Data and Research Methodology Used
- In the present era of globalization, the corporate-sector is gradually recognizing the importance of EVA as a result of which some Indian companies have started calculating EVA and making disclosures in their Annual Reports. Some of the companies have also started using EVA for improving their internal governance. For the purpose of current study, we have specifically selected five leading and globally well-known Indian companies, namely, Bharat Heavy Electricals Limited, Hero MotoCorp (HM Corp) Limited (formerly known as Hero Honda Motors Corporation), Infosys Limited, L&T Limited, and TCS Limited. This study is primarily based on the secondary sources of data and covers a period of five years from 2006-07 to 2010-11. However, all the relevant data for the purpose of this study have been extracted from the company’s Annual Reports and other information given on their Websites.In addition to the various ‘conventional’ performance measures, such as, Return on Capital Employed (ROCE), Return on Equity (ROE), and Earnings Per Share (EPS), a ‘value-based’ metric, “Economic Value Added (EVA)” has also been used. Undoubtedly, EVA is increasingly becoming an important metrics of measuring shareholders’ wealth creation, both in the developed and developing countries (like India). Undoubtedly, EVA is gaining recognition as a fundamental measure of company performance despite the fact that it has been in existence for a relatively short period of time. For the purpose of current study, both time series and regression approaches are used for analysing the data. Moreover, the trend values of EVACE for different years have been calculated using trend analysis. In order to test the significance of the trend and actual EVACE, Chi-square test has also been used. Besides, ANOVA is used for comparing means of the sample companies. In this study, all the required data analysis has been carried out by using the SPSS 17.0 and E-views 5.1 software.
6. Empirical Results and Analysis
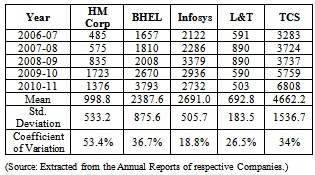
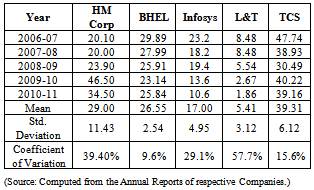
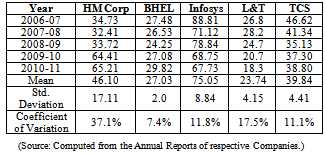
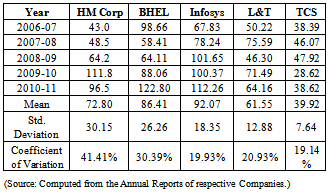
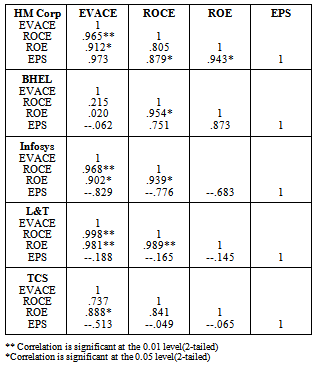
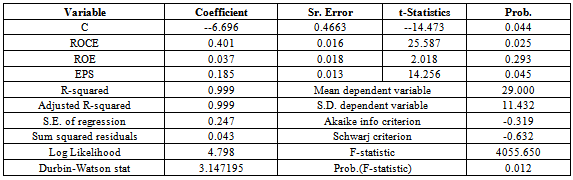
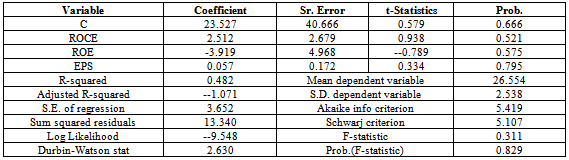
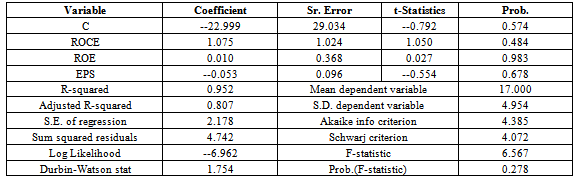
- Basically, the theory of EVA rests on two principal assertions: first, a company is not truly profitable unless it earns a return on invested capital that exceeds the opportunity cost of capital; and second, that wealth is created when a firm’s managers make positive Net Present Value (NPV) investment decisions for the shareholders (Grant, 2003).Table 1 depicts the Economic Value Added (EVA) performance of the sample companies for the recent five years period during 2006 to 2011. The analysis of the table very clearly reveals that “the EVA in absolute figures of BHEL, L&T and TCS has increased over the study period.” However, the EVA of Infosys Limited registered a slight decline (from Rs. 3379 to 2936 crores and Rs. 2732 crores) during the last two fiscals ended March 2010 and 2011. It can be inferred that, on an average basis of five years, the maximum (Rs. 4,662.2 crores) and minimum (Rs. 692.8 crores) EVA were posted by the TCS Limited and L&T Limited, respectively. A careful study of the results of Coefficient of Variation shows that Infosys(with 18.8% variations) has been able to add value for its shareholders on a consistent basis, followed by L&T(26.5% variations) as evident from their “least” estimates. Thus, the ability to create EVA “consistently” shows the ability of the two firms, especially BHEL and TCS in earning economic profits in excess of their overall cost of capital.To increase EVA, thereby increasing shareholders’ wealth, Stewart (1994) has given four ways on which corporate business strategies should depend. First, companies must utilize their existing resources more efficiently to improve their operating performance, resulting in higher rates of interest on existing capitals. Second, companies should invest additional capital in only those projects where return is more than the cost of capital. Third, to withdraw (or shrink) capital from the unprofitable projects yielding negative net present value. Last, but not the least, to employ an optimal capital structure to drive down the cost of capital.Basically, EVA capital employed (EVACE) attempts to establish the relationship between ‘EVA’ and ‘average’ capital employed by the company. Table 2 describes the EVA Capital Employed (EVACE) performance of the sample companies during the five year period, from 2006-07 to 2010-11, of study. A careful analysis of the table reveals that three companies, namely, TCS Limited, Hero MotoCorp and BHEL have amply “rewarded their investors with an EVA Capital Employed” of 39.31, 29.00 and 26.55 %(on an average basis), while the ‘lowest’ value for the same was posted by L&T Limited (5.41%). In sharp contrast to this, ‘higher’ variability in EVACE is seen in the case of L&T Limited, as evident from its “highest” (57.7%) coefficient of variation.
|
|
|
|
|
|
|
|
|
|
|
|
|
7. Summary and Conclusions
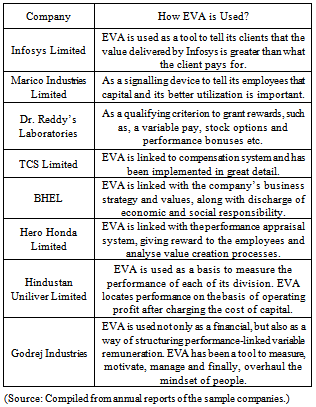
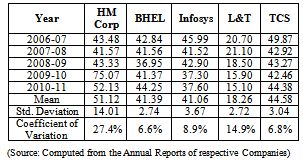
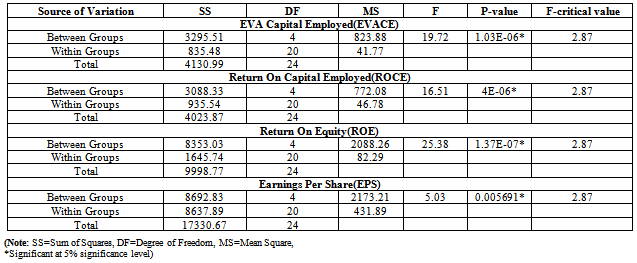
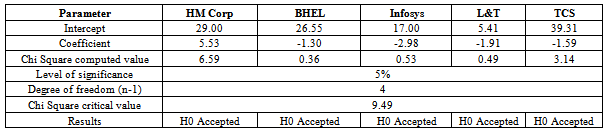
- Shareholder value maximization has become the predominant goal of corporations in India and the world over. To achieve such goal, it is important for companies to device performance measures that are aligned towards the corporate goal of shareholder value enhancement. Many consulting firms have come up with different value-based measures (VBM) of performance, such as, Economic Value Added (EVA), cash flow return on investment, and Total Shareholder Return (TSR) to cater to the above need. Of these measures, EVA has become quite popular in India. The EVA has attracted many of the world’s best managed and largest corporations to implement EVA as performance measurement system. The clarity that EVA has brought to the pursuit of shareholder value has led more than 500 companies to adopt the discipline since Stern & Stewart Company introduced the new system way back in 1982.In a market-driven Indian economy, there are a number of firms that create wealth, whereas a large majority of them destroys it. Companies need to improve their financial performance from the point of view of shareholder’s value addition. Non-creation of EVA leads to investor dissatisfaction. This in turn affects the equity mobilization activities of corporate sector that significantly impact the economy. EVA is both a measure of value and also a measure of performance. First, the value of a business depends on investor’s expectations about the future profits of the enterprise. Stock prices track EVA far more closely than they track earnings per share, or return on equity. A sustained increase in EVA will bring an increase in the market value of the company. Second, as a performance measure, EVA forces the organization to make the creation of shareholder value the number one priority. Under the EVA approach stiff charges are incurred for the excessive use of capital. EVA focused companies concentrate on improving the net cash return on invested capital. In this context, it is relevant to see whether corporate sector is earning returns on their cost, and thereby creating wealth for their shareholders. In fact, EVA, being a value-based measure, assists investors with wealth discovery and company-selection processes. Since creating shareholder value has become the widely accepted corporate objective nowadays, EVA deals with accounting for the cost of capital and determines the sufficiency or insufficiency of earnings generated by a firm to cover the cost of capital, i.e., whether a firm is a value generator or a value diluter. Unfortunately, investors’ hard-earned money is still being misused in unprofitable projects, resulting in shareholders’ wealth destruction. The need of the hour is to improve the practices prevalent in the corporate sector of India today. But, despite being touted as “today’s hottest financial idea and getting hotter,” it is by-and-large being ignored by the corporate sector, professionals and government bodies in India. A number of companies have started disclosing EVA statements, as additional information, in their Annual Reports. Unfortunately, annual published reports still lack transparency and adequate disclosures.The present study examined the value creation strategies of the selected Indian companies by analysing whether the EVA better represents the market value of companies in comparison to conventional performance measures. In this regards, “EVA and the conventional measures of corporate performance, such as, RONW, ROCE and EPS were analysed by using ANOVA, Trend analysis, and Regression analysis.” The analysis of the result reveals that “the EVA in absolute figures of BHEL, L&T and TCS has increased over the study period. Higher variability in EVACE is seen in L&T. ROE values showed fluctuating trend during the study period. It is seen that consistency in EPS was marked by TCS followed by Infosys and L&T. However, Hero MotoCorp has recorded EPS that showed variability on a higher magnitude during the study period. It is clear from the results of ANOVA that EVACE, ROCE, ROE and EPS of sample companies differ significantly. In addition, the differences between the original and trend values were not very significant in statistical sense and the same is attributed to sample fluctuations. Further, the EVACE and ROCE were highly correlated and were statistically significant at 5% level of significance in case of three companies, namely, Hero MotoCorp, Infosys and L&T.” However, from this study it can be suggested that “Indian listed companies should improve their EVA to the shareholders by considering the cost of capital invested. Because positive reported earnings not always provide additional value.” As for the shareholders, they need to be aware of the value created by the management of the company. Companies in higher EVA should provide benefits in the long-run; that is, while the capital invested by the shareholders produces value, the company also generates more profit from its operation. The empirical results of the study do not support the claim that EVA is a better performance indicator than traditional accounting measures in explaining market value. This implies that there are other factors that drive market value and should be taken into account for shareholders’ value creation or for performance measurement. As suggested by Chen and Dodd[49], there are various factors related to customers, employees and community satisfaction, product quality, R&D innovations those affect the market value of firms apart from financial variables. Keeping in view the limitations of this study, further research studies may be undertaken to explore the impact of disclosure of EVA statements in annual reports on the share prices of a large sample of companies. At present, “it seems prudent to use both traditional metrics and value added metrics, accompanied by information that explains how the less familiar value-added metrics work. Reliance on a single measure is not warranted.” The advent of this concept has provided flexibility to the management in measuring the performance of their business operations.The EVA analysis has attracted much attention in the Western countries, both as a management innovation, as well as, stock market analysis. The acceptance of such a technique in the Indian context, however, shows somewhat diverse trends. Some exemplary corporate houses (like Infosys, Wipro, HCL, TCS, NIIT, BPL, BHEL, Hindustan Unilever, Hero Honda, Godrej Industries, TISCO, Ranbaxy Laboratories etc.) have been separately publishing “EVA Statements, on a continuing basis, in their Annual Reports as part of financial statements.” However, a vast majority of the companies are still not willing to install the EVA technique for evaluating their financial performance because of certain ‘inherent’ difficulties associated with the computation. Again, it is observed by some scholars that in the Indian context, it may be very difficult task to establish the existence of any relationship between stock price and economic value added (EVA). In a developing economy like India, depending on EVA could be an obstacle in making ‘new-investment’ decisions. Moreover, when talking about shareholders’ value creation, the profile of the shareholders also needs to be taken care.The growth of the Indian Capital Market has increased the pressure on the companies to consistently perform better. No enterprise survives or grows if it fails to generate wealth for the ultimate stakeholders. Profit maximization is “age-old, wealth maximization is matured and value maximization is today’s wisdom.” An enterprise can exist without making profits but it cannot survive without adding value. An enterprise not making profits shall turn into poor health (like several companies in the public sector), but not adding up value may cause its termination over a period of time[50]. In the present era of globalization, the corporate-sector in India is gradually recognizing the importance of EVA as a result of which some Indian companies have started calculating EVA, making disclosures in their Annual Reports and also using EVA for different managerial purposes, as shown in Table 14. Moreover, some leading companies have also started using EVA for improving their internal governance. For example, TISCO Limited is using EVA to measure performance of its mines and other business segments. Managers of the company find the measure quite useful and are highly enthused by the use of this measure. Similarly, TCS Limited has implemented “EVA as a performance measurement and evaluation system linked with incentive. It is expected that EVA will soon gain popularity more as a management planning and control tool. Undoubtedly, EVA is gaining recognition as a fundamental measure of company performance despite the fact that it has been in existence for a relatively short period of time.
|