-
Paper Information
- Next Paper
- Previous Paper
- Paper Submission
-
Journal Information
- About This Journal
- Editorial Board
- Current Issue
- Archive
- Author Guidelines
- Contact Us
International Journal of Finance and Accounting
p-ISSN: 2168-4812 e-ISSN: 2168-4820
2013; 2(2): 104-108
doi:10.5923/j.ijfa.20130202.09
Comparative Analysis of the ASEAN+3 and European Financial Markets
 Abstract
 Reference
 Full-Text PDF
 Full-text HTML
Anna Kiseleva
Institute of Europe RAS, Moscow, 125993, Russia
Correspondence to: Anna Kiseleva , Institute of Europe RAS, Moscow, 125993, Russia.
| Email: |  |
Copyright © 2012 Scientific & Academic Publishing. All Rights Reserved.
In this paper I compared the degree of financial market integration in the EU as well as in the ASEAN+3. The main weaknesses of the ASEAN stock markets are their fragmentation and low share of foreign stocks among the listed companies. This research has found out that the sigma convergence indicator confirms that the ASEAN+3 countries aren’t prepared for a monetary union. The eurozone and non-eurozone financial markets had been more and more integrated inside each subgroup between 1998 and 2008. In general since 2008 the dichotomy has been increasing between the two mentioned groups and inside the EU.
Keywords: Stock Exchange, Foreign Issuer, Sigma Convergence Indicator, EU, ASEAN+3
Cite this paper: Anna Kiseleva , Comparative Analysis of the ASEAN+3 and European Financial Markets, International Journal of Finance and Accounting, Vol. 2 No. 2, 2013, pp. 104-108. doi: 10.5923/j.ijfa.20130202.09.
Article Outline
1. Introduction
- Shunning financial markets fragmentation aims at reaching such inherit peculiarity of financial markets as the economy on scale. That’s why the World Bank’s experts blame small open economies for their fragmented markets and advise to unify regulation and consolidate the markets infrastructure[3]. M. Schindler[7] suggested new indexed approach to measure financial integration using 91 countries data from 1995 to 2005. This index takes into account different levels of capital account restrictions. According to M. Schindler’s comparative picture, de jure financial restrictions in the East Asia and Pacific are less then in Europe and Central Asia, which is contrary to IMF dummy index approach. The second interesting finding presented by M. Schindler is that de facto financial integration for equity investments is rocketed 3 year after de jure losing restrictions. The same incremental effect for cumulating results for lifting capital restrictions (but in smaller scale) was found for debt securities. However for FDI de facto integration is less then de jure one. L. Kang-por Fung, Chi-sang Tam and Ip-wing Yu[5] consider bond market benchmark and benchmark equity indices since 16.03.1994 up to October 2007 and consider 10 Asian countries (mainly from ASEAN+3) and the USA.They use 5 different approaches to measure market integration separately for bond and equity markets. They prove that during the times of turmoil in the financial markets integration processes slow and even go backward, while in a good time they move ahead, besides, Asian stock markets demonstrate a better degree of integration than bond ones. Chinese stock market moves out of phase with others. The same countries were under consideration in later paper[4], in which the ratcheting up Asian stock market integration was confirmed using later data (for data set of 1993-2009). A. Benetrix and S. Waelti[1] argued that in the EU the bond market integration left behind the integration in the stock markets.
2. Regulation Framework on the Agenda
- ASEAN members approved measures on the ASEAN+3 financial markets integration in the scope of the Asian Bond Markets Initiative on the Joint Ministerial Statement of the 11th ASEAN Plus Three ASEAN Ministers Meeting (Madrid, 4.05.2008) through promoting their plans to facilitate regulatory framework and related infrastructure for fixed income markets. ASEAN Economic Community Blueprint contains approaches to attract foreign direct and portfolio investments to ASEAN markets. Concerning the selected historical financial data regarding to the company which shall be presented in financial reports, IOSCO International Equity Disclosure Standards (1998) require five most recent financial disclosure years. The ASEAN Equity Securities Disclosure Standards permit the three most recent financial years disclosure. From my point of view, three-year disclosure seems to be too short for outside investment analysts to make a diligent and reasonable basis for the investments. ACMF members jointly adopted the “Common Supervisory Framework” for mutual recognition of market professionals qualifications at its 5th ACMF meeting in 2006. The Framework is to be used as a guide to settle mutual recognition of qualification and professional experience. In 2007 the Monetary Authority of Singapore and the Securities and Exchange Commission of Thailand signed a Memorandum of Understanding. This document is a reciprocal agreement for approving qualifications of market professionals. It’s a pity but there is no information about any other country in the ASEAN to implement mutual recognition of market professionals procedure. Evidently, “Cross-Recognition of Qualifications on Education and Experience of Market Professionals” is the cornerstone for cross-border investments in the ASEAN.
3. Stock Exchanges in the ASEAN+3 and the EU
- Analysis and relative data described below were made by the author by using the World Federation of Exchanges and the World Bank databases. Difference in the financial market development can be measured as a market capitalization to GDP ratio for a particular country. Generally speaking, in 2010 the ASEAN+3 countries (with the World Bank data provided) excluding Viet Nam (19.68%) and Indonesia, are in line with the average world rate of companies’ market capitalization to GDP ratio (90.42%). However the performance of the Philippines, Japan, China and Thailand is 10-20% below the world average data. Hong Kong’s ratio is 12 times better than the average one resulting in the peer leadership. Republic Korea, Singapore and Malaysia market capitalization of publicly traded companies surpasses GDP of the corresponding countries. Similar predominance is inherent in countries with well-developed financial markets such as Luxembourg, the USA, the UK and Sweden. The lowest ratio in the EU was in Slovak Republic (4.66%) and in Latvia (5.21%). New EU members outside the eurozone have not struggled low capitalization of their financial markets and their market capitalization to GDP ratio freeze below 23% GDP. The only exception is Poland with its 40% capitalization to GDP ratio. Among the eurozone countries the capitalization to GDP ratio less than 20% was observed in 7 countries in 2010: Slovak Republic, Estonia, Italy, Ireland, Austria, Slovenia, Cyprus. For four countries such as France, Spain, the Netherlands, Luxembourg this ratio exceeded 70%.To sum up, for ASEAN+3 countries the market capitalization ratio is high in compliance with the EU ones and this is deemed to be a sign of the financial markets importance as the transmission mechanism in their economy.
3.1. The Market Width
- I have evaluated the “market width” by exploiting the number of issuers of 2010 which securities were traded on the stock exchanges associated with the World Federation of Exchanges. Tokyo SE Group has the largest number of the listed companies in the ASEAN+3 with its 2293 issuers. It is even slightly more than the width of the market for companies traded on the NYSE Euronext (US) with its 2238 issuers. Korea Exchange and Hong Kong Exchange follow it with 1798 and 1413 issuers respectively. In the EU the BME Spanish Exchanges with its 3345 issuers and the London SE Group with its 2966 issuers exceed both Asian and US stock exchanges, including NASDAQ OMX (2778 issuers), Tokyo SE and NYSE.The most successful stock exchange in attracting foreign issuers is London SE. LSE is the leader in the number of foreign companies quoted on the stock exchanges with its 604 foreign issuers. NYSE follows it with 451 issuers and Singapore stock exchange is the third with 317 foreign companies. Despite of comparable number of non-domestic listed numbers ASEAN+3 stock exchanges (excluding Singapore stock exchange) exhibit low share of quoted non-domiciled companies.Only Hong Kong stock exchange and Singapore stock exchange have more than 1% of offshore issuers among all the listed undertakings. In the European Union all but one (NASDAQ OMX Nordic Exchange) stock exchanges reported on WSE site are with foreign enterprises in listing. Their share among all quoted companies (if they trade) exceeds 1%.It’s worth mentioning that even relatively small stock exchanges (not more than 300 issuers listed) have foreign companies to be listed. For instance, Irish stock exchange has 59 foreign companies. There are 52 foreign companies in the listing on the Budapest stock exchange.For bond issuers European stocks are the key players. The Korean stock exchange (with 737 bond issuers) has the broadest number of listed companies among the ASEAN + 3 stock exchanges. It is 3-4 times more modest than European stock leaders: Irish stock exchange (3784 issuers), Deutsche Börse (2809 issuers), Luxembourg Bourse (2524 issuers). The vast majority of the debt issuers quoted on the ASEAN+3 stock exchanges are the private domestic companies.The highest quantity of foreign bond issuers and the maximum percentage in the total number of the listed companies are registered on the Korea stock exchange.Contrary to the ASEAN+3, a quarter of the European stock exchanges are specialized on foreign enterprises. The leadership both on the total number of the listed bond issuers and on share of foreign issuers held by the Irish SE (3075 foreign issuers among 3784 listed companies). Only one domestic company is represented on the Luxembourg stock exchange, the other 2523 issuers are foreign companies. The Deutsche Bourse is the third on the quantity of listed companies and the second on the foreigner’s share criterion (2550 foreign issuers of 2809 listed companies). The foreign issuers are too rare in the ASEAN+3 bond markets as compared to European ones. Consequently it’s crucially important to provide single infrastructure to facilitate investments in regional debt securities in the ASEAN+3 for both market participants and general public.
3.2. The Market Depth
- The notion “market depth” is considered in the paper as total market capitalization of all stocks traded on a particular stock exchange at the end of the year.In all ASEAN+3 stock exchanges the share of foreign stocks turnover is less than 1% of the total turnover stocks. The largest share of non-domestic securities turnover rests with the US stock exchanges NASDAQ (9.31%) and NYSE (9.76%). The lion share of the foreign stocks in the whole regional trade turnover belongs to the Shanghai, Tokyo, Shenzhen SE (23.76%, 20.08%, 18.87% respectively).Malaysia SE with its relatively small share in the regional securities turnover (0.59%) is responsible for 1.42% of foreign securities turnover, which represent the largest share of foreign securities in the total SE turnover in the ASEAN+3.The leaders in the regional trade turnover in the group “Europe ─ Africa ─ Middle East” are: London SE (24.34%), NYSE Euronext SE (17.90%), Deutsche Börse SE (14.45%). The share of foreign stocks in total trade turnover held by eight European stock exchanges exceeds 1%. The leaders on the quantity of foreign companies quoted on the stock exchanges are: Luxembourg SE (18.71%), Deutsche Börse (9.93%), London SE (9.64%). The presence of foreign bond issuers in the European stocks turnover is comparable with the largest Americas SE.Tokyo SE Group, Osaka Securities Exchange, Korea Exchange are the largest ASEAN+3 stock exchanges at trade in debt securities. Similar to foreign stocks, fixed income securities are poorly represented at the ASEAN+3 financial markets (less than 1% of bonds value is listed) except Hong Kong Exchange (transactions in foreign bonds are responsible for 22.57% of total fixed incomes values). The less values of bonds in a stock exchange in the ASEAN+3 is, the more share in it belongs to non-government fixed incomes. In Bursa Malaysia (the smallest one in trade size) they are responsible for 100% bond values, but only 0.19% of value was covered by non-government bonds on the largest in the region Tokyo SE Group. Such relationship is not typical for the EU. The leader on fixed incomes, Deutsche Börse SE, holds the second place in foreign bond values (62.50%). In fact, Luxembourg SE specializes only in foreign debt securities (value of foreign bonds listed there is 99.94%). Trading in domestic debt securities plays the key role for Irish SE (100%), Athens Exchange (99.22%), Warsaw SE, Ljubljana SE, Budapest SE (96.88%, 89.39%, 89.02% respectively).Enterprises’ debt financing by means of bonds issue at the domestic securities markets hasn’t received an appropriate development in the post-communist countries. It’s possible to put forward a supposition about ineffective transmission mechanisms under financing investments needs of domestic enterprises in these countries. The leaders in relative size of corporative bonds trading are NASDAQ OMX Nordic Exchange (60.06% values of bonds listed) and BME Spanish Exchange (59.42% values of bonds).
3.3. Market Liquidity
- I took average velocity of domestic shares in 2010 in order to measure market liquidity. Stocks with the highest degree of liquidity are quoted at the NASDAQ OMX Nordic Exchange and NYSE where in average any stock changes its owner (3.4 and 1.3 times per year respectively). Similar high degree of liquidity have the ASEAN+3 leading stock exchanges. Among them Shenzhen SE (3.44 times per year stocks change their owners), Shanghai SE, Korea Exchange and Tokyo SE (1.79, 1.76, 1.09 times per year change their owners respectively). Thailand SE falls behind a bit where a stock changes its owners 0.94 times per year. The least liquid Securities Exchanges are Philippine SE and Bursa Malaysia, which provide (on average) only 0.19 and 0.32 transactions with every share per year.
3.4. Sigma Convergence Indicator
- Sigma-convergence was used by P. Vodova[10] as the measure of financial convergence between Czech Republic, Slovakia, Poland, Hungary. This criterion is based on the interest rate volatility. I have adopted the formula from ([10] as shown in formula (1). For raw data I have used IMF-IFS statistics on the government bond yield (with a few exceptions). Sigma indicator goes to zero in the case of full convergence. I used the terms “eurozone” and “non-eurozone” according to the list of the countries included in both groups at the end of 2011.
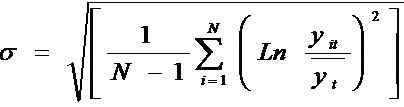 | Formula 1. Sigma convergence indicator |
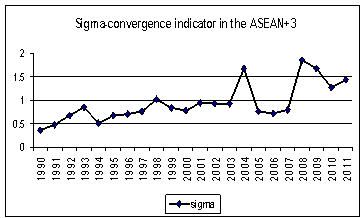 | Figure 1. Sigma-convergence indicator in the ASEAN+3. Source: author’s calculations based on IMF-IFS data |
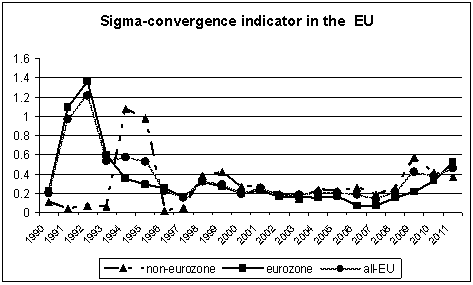 | Figure 2. Sigma-convergence indicator in the EU. Source: author’s calculations based on IMF-IFS data |
4. Perspectives and Further Steps in the Development of the Global Financial Markets
4.1. New financial Products and Possible Renovation
- The number of Chinese high net-worth individuals (whose investments exceed 1 million USD) has been growing rapidly at a rate of about 15% since 2010, when it was 875 thousand of them[6]. It’s interesting that immigration motives prevailed, according to[6], only for 23% of respondents. The prevailed motivation for foreign investments of Chinese high net worth individuals, according to D. McMahon, were risk diversification (86% of the sample) and the lack of wide diversity for investments opportunities (76% of the sample). However the increasing diversity of investing vehicles and investment tools, as a rule, result in enlargement of the shadow banking system which probably leads to much more vulnerable domestic financial one. Leading by the Financial Stability Board, G20 countries make efforts to stabilize the global financial markets by means of strengthening the surveillance over the shadow banking system. For example, repos and lending securities regulatory proposals are under consideration in the Securities Lending and Repos: Market Overview and Financial Stability Issues[8]. In this report the authors scrutinized the sources of surge in the volume of repo and securities lending transactions. It is important to remember that legally the repo operations differ from securities lending ones as in repo the ownership is transferred to the counterparty which purchases securities but securities lending avoid this ownership transferring. That’s why, despite the fact that in common practice people usually use these words as synonyms, they are not actually identical. Firstly, according to FSB Report[8] repo operations are used as substitutes for short term bank loans. Secondly, financial intermediaries like as dealers (especially with market maker functions) which might operate with the sufficient share of marginal sources, depending on the volatility and price levels of the underlined securities dealing, e.g. with structured products. This type of financial intermediaries uses securities lending to avoid excessive storage of underlying securities; to cover long/short position in securities; to avoid “chain of settlement delivery failures”; to hedge “credit risk or market risk exposure”, etc.[8].Thirdly, leveraged investment funds use securities lending and repos in their everyday investment strategies based on short selling and margin trade. This choice is of particular interest for hedge funds because their financial ratios are often out of standard banks’ requirements for borrowers and, consequently, they have to rely on brokers’ loans. Sometimes well-being pension funds use repo in the scope of their «liability-driven investment (LDI) strategies” to increase spare cash needed to increase ROA or for liquidity management purposes[8].The fourth and the fifth reasons for surge in securities lending and repos accordingly are collateral requirements of banks, brokers, dealers as well as the source of «additional returns, making market activity “supply-led”»[8].As we can see from this passage the part of the reasons resulted in soaring repos and securities lending, originated from the financial market participants’ endeavour to facilitate functioning of the financial markets in due course. However the other reasons result from speculative motives and their greed.To enhance the settlement problems related to the inefficient regulation of the shadow banking system, Financial Stability Board (FSB) issued Global Shadow Banking Monitoring Report in November 2012. FSB staff monitored “Argentina, Australia, Brazil, Canada, Chile, China, Hong Kong, India, Indonesia, Japan, Korea, Mexico, Russia, Saudi Arabia, Singapore, South Africa, Switzerland, Turkey, UK and the US”[2]. The FSB experts outlined that the assets of the shadow had been risen dramatically during the five years before the crisis and had reached $62 trillion by 2007. After the crisis started, the average annual growth rate, according to my calculations based on FSB data[2], decreased from 19% to 2%[2]. To increase the stability of international financial system, FSB experts insisted on scrutinizing systemic risks originated from shadow banking system per se. The other source of instability is the close relationship between banks and shadow banking system and the high probability of contagion the shadow banking system in general through the infected classic bank, suffering from its distressed condition and vise versa[2]. FSB disseminated consultative document “Strengthening Oversight and Regulation of Shadow Banking. A Policy Framework for Addressing Shadow Banking Risks in Securities Lending and Repos”[9] in order to decrease risks related to shadow banking system in November 2012. It contains suggestions how to reduce risks related to repos and securities lending.
5. Conclusions
- The ASEAN+3 countries suffer from lack of commonly accepted intra-regional securities market standards and the cross-border infrastructure, supporting trade in securities. Now the securities market in the ASEAN+3 is a rather developed one as it’s a solid market capitalization to GDP ratio. However there are a few countries left aside with their vestiginal stock trading. Low share of foreign enterprises listed in the ASEAN+3 SE as well as laggard foreign securities trade turnover are a hindrance for securities market internationalization for the ASEAN+3 stock exchanges. Financial market convergence for the ASEAN+3 is moderate as opposed to high degree of convergence in the EU, but since 2008 the divergence has been increasing in the EU.From my point of view, even in the case of implementation FSB’s suggestion in G20 countries, the shadow banking system regulation will definitely come across with more difficulties then a common one. The main reason is that shadow banking system is originally oriented on qualified investors who usually support management’s endeavour to domicile shadow financial institutions in tax haven for minimizing taxes and excessive financial statement disclosure.