Angus Okechukwu Unegbu
School of Business & Entrepreneurship, American University of Nigeria, Yola Adamawa State, Nigeria
Correspondence to: Angus Okechukwu Unegbu , School of Business & Entrepreneurship, American University of Nigeria, Yola Adamawa State, Nigeria.
| Email: |  |
Copyright © 2012 Scientific & Academic Publishing. All Rights Reserved.
Abstract
This study is centered on developing advanced simplified Z-Score model for identification of falsified financial statements mainly from published data of emerging economies. The paper adopts qualitative response technique based on six parameter questions. The answers to these questions which are derivable from each financial statement are the nucleus for the construction of ‘Angus Z-Score’. Financial Statements of Fifty one companies with unique motivations to falsify were investigated. Statistical tools of analyses are T-test SPSS based and percentages. The study found it easier and simpler to use Angus Z-Score model in testing and identification of Falsified Financial Statements. The predictive efficacy of Angus Z-Score is significantly high. The model’s predictive ability increased in comparisons to adopted benchmark CPT. Model in some sectors. Angus Z-Score model is found to be an important analytical tool for pre-testing Corporate Financial reports for falsification/misstatements in order to enhance right investment and other business decisions.
Keywords:
Misstatements Prediction, Propensity to Falsify, Z-Score, Identification of Fraudulent Financial Statements, Predicting Fraudulent Financial Statements, Emerging Economics, Financial Statement Falsification Forecasting
Cite this paper: Angus Okechukwu Unegbu , Advances in Modeling for Falsified Financial Statements, International Journal of Finance and Accounting, Vol. 2 No. 1, 2013, pp. 37-54. doi: 10.5923/j.ijfa.20130201.06.
1. Introduction
Financial statements’ preparation and presentation has become crucial instrument of corporate identity, performance history and Corporate Public relations’ show case. This new found usefulness of corporate reporting has increased motivations for insertions of unfounded and false items into financial statements in order to bring it up to desired intentions. These manipulations has assumed unimaginable proportions in recent years of economic downturns for various reasons leading to distortions of financial statements and clouding the understanding of Financial Statement Corporate stakeholders. The sudden collapse of multinational corporations and many national companies were attributed to falsification of financial statements for prolonged periods. The motivations to false are anchored on Corporate management’s participations in order to hold on to office, earn bonus and present themselves as genius before stockholders and the general public. These falsifications sometimes is aided by professionals as a result of existing lapses in Accounting Standards of affiliating countries and sometimes by encouraged by non-existence of enabling status. Falsifications of financial statements appear in different forms such as earnings engineering, accounting for retained profits, provisions, tax evasions, fraudulent accounting and misstatements. Whichever form, falsification of financial statements appears, it brings with it only short terms gains but huge long term economic and social costs to the Government, Business Owners, Stockholders, lack of trust on Corporate Auditors and the General public, thus the need for a model for identification of false financial statements has become expedite. It is more needed in emerging economics where information technology, information upkeep and access is every difficult, complex and usually faced with disruptions.
1.1. Statement of the Problem
In a bid to curb the long run huge negative effects of Corporate financial statements’ falsifications and manipulations, several scholars have advocated methods/models for identification of fraudulently prepared financial statements. These existing methods come with it long mathematical calculations, equations and econometric models that are hard to understand and interpret by Corporate financial statement stakeholders for which they were intended to serve. Felt-gaps centred mainly on complexities of existing models. Phenomenal suggestions were on the need for Z-Score type of model for identification of falsified financial statements. The purpose of this research is to develop advanced simplified Z-score model for identification of false financial statements, using variables derivable from Corporate financial statements itself. The specific objectives of this paper are anchored to meeting these felt-gaps arising from existing models, thus it aimed that advocating a new model called ‘Angus Z-Score model’ that is not only simply to understand but construed in Z-score form for easier interpretation and application.
1.2. Research Hypotheses
In the present modeling, CPT. Model postulated by [1] is adopted as a benchmark model for testing the efficacy of the new model, thus the following hypotheses are hereby formulated;HO1: The predictive efficacy of Angus Z-Score and CPT. Models is not significantly different in discriminating between falsified and non-falsified financial statements.HO2: The predictive ability across industries between Angus Z-Score and CPT. Models is not significantly different.
1.3. Practical implications and Significance of Paper
Corporate Financial reports can now be pre-tested using Angus Z-Score model for falsification/misstatements in order to enhance right investment and other business decisions. The significance of this paper is that a simple and easy to use working model is now available to test corporate financial statements for right investment and other business decisions. It is mainly applicable on Corporate bodies operating in developing economies. This Study has succeeded in adding an analytical tool to Forensic Accountants and other outside corporate stakeholders’ capability of discriminating between falsified and non-falsified financial statements, the knowledge of which enhances making right investment decisions.
2. Review of Related Literature on Modeling for Falsified Financial Statements
The desires to falsify financial statements have been studied and further explanations as to what factors motivate these desires had been advocated ([2],[3],[4],[5],[6]). Despite the harm, falsified financial statements bring to corporate bodies and the economy, the desire to falsify is increasing. Regardless of the existence of different countries’ laws making falsification of financial statements illegal, criminal and misdemeanor, the urge to falsify is unabated. As a result of these increasing urge to falsify financial statements, researchers have started modeling how to identify falsified financial statements. The magnitude of falsification of financial statements is more in Emerging Economies as a result of lapses and inadequacy of information technology, information upkeep and access. Emerging Economies are prone to various kinds of shocks, manipulations and circumventions than developed countries. It is asserted by [7] that continuous improvement in communication and information technology has directly impacted the quantity and quality of data available to be communicated. Continuing [7] citing Sachs (1999) averred that the problem for myriad reasons; the technological gains in wealthy countries do not readily diffuse to the poorest ones. This gap has created differences in the quality of financial reporting between developed and emerging economies. In order to survive and flourish in emerging economies, companies must be able to filter quickly corporate reports for further business decisions. One of the most effective filtering focuses for further business decisions is the determination of falsified and non-falsified financial statements.
2.1. Dynamics of Modeling for Falsified Financial Statements
Using ten financial variables of debt to equity, sales to total assets, net profit to sales, accounts receivable to sales, net profit to total assets, working capital to total assets, gross profit to total assets, inventory to sales, total debt to total assets and financial distress (Z-score) , using stepwise logistic regression,[8] developed two models with an equation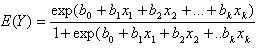 Where;Y= 1 if falsified financial statements occursY =0 if non-falsified financial statements occursE(Y) = p (falsified financial statements occurs = Π)Π= denotes the probability that Y = 1bo = the intercept termb1; b2; . . . ; bk = the regression coefficients of independent variablesx1; x2; . . . ; xk= the independent variablesThe models are presented as:FFS = bo + b1…(DEBT/EQ)+ b2(SAL/TA)+ b3(NP/SAL)+ b4(REC/SAL)+ b5(NP/TA) +b6(WC=TA) + b7(GP/TA)+ b8(INV/SAL)+ b9(TD/TA)+ eWhere FFS = 1 if FFS discovered group, 0 otherwise.Given that;Debt = Long term DebtsEQ = EquitySAL = SalesTA = Total AssetNP = Net ProfitREC = ReceivablesWC = Working CapitalGP = Gross profitINV = InventoryTD = Total DebtHaving found from the work of Loebbecke et al. (1989) that profit relative to industry was inadequate for 35 percent of companies with fraud in their financial statements,[8] incorporated the Z-Score insolvency prediction model advocated by ([9],[10]) in producing two models of Logit model and Altman’s Z-Score model. The combined theory and workings of these models were not only long but very complex for a Corporate Manager, Financial analyst and other users of financial statements to apply and interpret with ease.A study carried by[11] on a study titled detection of fraudulent financial statements through the use of data mining techniques. In their study[11] used decision trees, neural networks and Bayesian belief networks for building a model for identification of falsified financial statements. Apart from the known defects in the use of data mining techniques which presupposes that some of the variables or financial statement must have been proofed to be falsified, their model is very long, complex and understandable by experienced well read professional auditors.A research done by[12] centered on developing a model of forecasting fraudulent financial statements using data mining while[13] focused on creating model of predicting fraudulent financial statements with machine learning techniques were well thought academic researches. The first model is based on a hybrid decision support system that combines algorithms using stacking variant methodology while the second model anchored on the use of decision trees based on financial ratios as variables. Twenty five financial ratios were incorporated in building this second model. The models were found to be significant predictors of falsified financial statements but both models ended up being very long to comprehend and very complex in application.The use of three-Phase Cutting Plane Algorithm using Mathematical Programming was advocated by[14]. The motivation behind the model is to develop an algorithm which will give a successful achievement on detecting companies which appeal to financial manipulation and intend to estimate the amount of earnings management practices from the publicly available information. The algorithm, the claimed will overcome some of the major drawbacks of the existing statistical techniques for detection of financial manipulations of earnings. In building their model, they adopted ten variables, each an equation of other variables. Listing and explaining the variables and their equations because it is very long and will result into seeking their permission for reproduction. The application and the workings of the model are not only tedious but understandable by highly trained Accountants with technological and econometric exposures. A study on detecting the manipulation of financial information, using artificial neural network models was carried out by[15]. An Artificial Neural Network Model, which is based on the concept of using artificial neurons, to estimate the manipulative financial reporting practices of the companies. Neural network refers to an artificial intelligence technology. The variables employed in the built of their model came from;i. Sales Growth Index (SGI)ii. Days Sales in Receivables Index (DSRI)iii. Gross Margin Index (GMI)iv. Asset Quality Index (AQI)v. Depreciation Index (DEPI)vi. Sales, General and Administrative Expenses Index (SGAI)vii. Leverage Index (LVI)viii. Total Accruals to Total Assets Index (TATA)ix. Days in Inventory Index (DII)x. Financial Expenses Index (FEI)In their conclusion, they are of the view that when the variables that are necessary to find out manipulation of financial information are known, artificial neural network approach could be used for determining the companies which will exercise manipulation of financial information.A review of reviewed Financial Accounting Fraud Detection based on Data Mining Techniques was also done by[16]. The review proposes a framework for data mining techniques based accounting fraud detection to help qualified accountants selecting suitable data and data mining technologies for detecting fraud which shows that there exist apparent confusion on conceptualizations and applications of data mining techniques.[1] using variables from financial statements prompted ten parameter questions advocated a model titled ‘CPT analyses model (Cash flow, Percentage Trend Analyses)’. The model is a qualitative-response technique with the following equation and explanations;
  Where; Ag = Angus range.
 = Parameter Values (We advocated for ten Scale point parameters or questions for ascertaining false financial statements) N = No answers from the assertion parameters or questions.
2.2.The Ten Parameter Questions are
1. The Cash Flow Statement was forced to balance with an entry or there is a new in the financial statements that has no contra effects or lacks from the previous year?2. There exist given percentage trend(s) in any of the financial statement’s variables?3. Is there apparent sudden material change(s) in Long-term investments, Long-term loans, Leases, Deferred taxes, Provisions or write-offs that affect Cash Flow Statement computations?4. Are there material item(s) omitted or added in any financial statement or not professional correctly reflected in the Cash Flow Statement?5. Tax paid or Tax liability computations/shown in any financial statement cannot be reconciled with that shown in the Cash flow Statement?6. Dividend paid/outstanding shown in the financial statements cannot be reconciled with the figures reflected in the Cash flow Statement?7. Gains or losses from Disposals Fixed Assets are not correctly shown in the Cash Flow Statement and/or treatment of acquisitions or disposals in the financial statements lacks professional assertion?8. There exists a treatment in any financial statement that lacks professional assertion?9. Is there end of year transfers from intra-group transactions or foreign partners that lacked established prior year events but affect current year’s Cash flow statement computation?10. There are changes to non-cash items or provisions without details, notes after the base year but affects current year Cash flow Statement?
2.3. CPT Decision Criteria: Decision Outcome
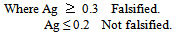 The felt-gaps of [1] model are the existence of gray area and overlapping parameter questions. The material issue in CPT. model is not the gray area but overlapping questions. To close the gray area is simply to restate the decision criteria thus:
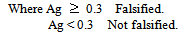 The present study though adopted qualitative response questions which are similar to the ones employed[1] but is different as it focuses on developing model for identification of falsified financial statements that is construed in Z-Score form.
3. Research Methods
3.1. Study Area and Sampling Technique
The area of concentration of this study is corporate bodies operating in emerging economies with high propensity to falsify apparent in their published financial statements. The symptoms that induce falsification of financial statements as asserted by [3] as expanded by [1] formed the nucleus of the current study.The data for this study were obtained from published financial statements of corporate bodies as surveyed/investigated by [1]. The sampling method adopted is availability and purposefully sampling technique. Published financial statements of Fifty one companies with unique motivations to falsify their financial statements were investigated for the purpose of testing stated hypotheses at 95% confidence level.This research adopts qualitative response technique in the modeling so as to keep the model and its interpretation very easy. It adopts parameter questions stipulated by[1] but reduced it to six. The modified six parameter qualitative response observatory aces are used in the construction of a Z-score model hereby referred to as ‘Angus Z-score model’. Statistical tools of analyses are T-test SPSS based version 16 software and percentages.
3.2. Angus Z-score Model and its Decision Criteria
The dynamics of building Z-score model for identification of falsified financial statements starts with identifying areas of financial statements with high propensity to manipulate. These areas of high propensity to falsify are broadly classified into six. Using qualitative response technique in order to make its use universal, each of them is assigned a model question and identified as variables X1 to X6. Positive answer to any of the posited questions attracts a digit of one and it is multiplied as many times as there are such inherent positive answers on appraisal of any given financial statements. The weight of these parameter questions are not the same. The weighting is based on intentionality and materiality of the entry into the financial statements. Weighting and dividing by sum of the parameters, the Angus Z-score model for detecting falsified financial statements is construed thus:Z = 0.625X1 + 0.561X2+ 0.630X3+ 0.621X4+ 0.629X5+ 0.631X6Where;X1 = There is apparent sudden material change(s) in Long-term investments, Long-term loans, Leases, Deferred taxes, Provisions, Pensions, write-offs, etc, that affect Cash Flow Statement computations and there exist changes to non-cash items or provisions without details/notes after the base year but affects current year Cash flow Statement?X2 = Tax paid or Tax liability computations/shown in any financial statement cannot be reconciled with that shown in the Cash flow Statement?X3 = The Cash Flow Statement was forced to balance with an entry or there is a new entry in the financial statements that has no contra effects or is not a prior year item, there is material item(s) omitted or added in any financial statement or lacks professional assertion?X4= Dividend paid/outstanding shown in the financial statements cannot be reconciled with the figures reflected in the Cash flow Statement?X5 = There exist given percentage trend(s) in any of the financial statement’s variables and or between current and previous year?X6 = Gains/losses from Disposals of fixed assets are not correctly reflected in the Cash Flow Statement and/or treatment of acquisitions/disposals in the financial statements lacks professional assertion?Decision criteria of Angus Z-Score model
3.3. Justification for the Choice of the Six Qualitative Response Questions
X1. Long-term investments and Loans are readily used to manipulate additions or reductions in figures in form of write-offs, increases or reductions aimed at balancing financial figures. Such write-ins or write-offs without historical origins are usually covers of falsifications. Leases, Deferred taxes and Provisions always attract high propensity to falsify because of their non-cash impacts. Many non-cash items of the income statement have high focus for financial statement’s manipulations thus the need to ascertain their historical origin. X2 Tax paid is readily entered into the Income Statement but many a time is reduced or increased in the Cash Flow Statement for balancing entry. Same applies to tax liabilities that appear in the Balance Sheet compared with historical events leading to its computations. There is the need to recheck this as many unquoted corporate bodies uses tax provisions that appeared in the Income State and Balance Sheet as tax paid in the Cash flow Statement.X3 Sudden introduction of entries into the Cash flow Statement without contra effects on either the Income Statement or Balance Sheet is a suspect for falsification because Cash Flow Statement reconciles entries in the Balance Sheet resulting to “Cash” as reported in the Balance Sheet with entries in the Income Statement which resulted to “Profit” as captured by the Income Statement.X4 Dividend paid reduces Cash in the Balance Sheet while proposed dividend affects retained profit and increases liability. Many a time there exist complexities of historical events from previous years’ proposed dividend, current year dividend declared and the amount of dividend recorded to have been paid. These complexities induce a fertile soil for falsifications. X5 Common falsification of financial statements trend is to increase or decrease the current year’s figures by given percentages of the previous year. Where it is established that a given trend exist be it vertical or horizontal, is a sure sign of falsification. This type of falsification is common in the Income Statement. X6 Acquisitions and Disposals of Fixed Assets always have contra effects on Balance Sheet and Cash Flow Statements. Lack of these contra effects in reporting is a sure sign of falsifications. Further complications are inherent from Disposals in terms of gains or losses because of their non-cash entry nature. These complications always give rise for their use for manipulations; hence there is the need to recheck their historical treatments, computations and entry in the Cash Flow Statement.
4. Testing of Hypotheses and Discussions of Test Outcomes
HO1: The predictive efficacy of Angus Z-Score and CPT. Models is not significantly different in discriminating between falsified and non-falsified financial statements.In order to test this hypothesis, extracts of prediction of each of the two models were made from the appendix in respect of falsified and Not-falsified predictions. The summary of these are seen in table 1 below;Table 1. Predictions of Angus Z-Score and CPT. Models***
 |
| |
|
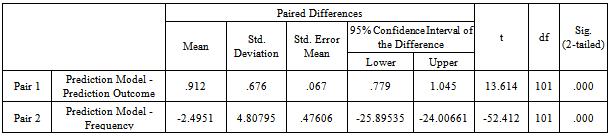
Statistical analysis of table 1, using T-test appeared as seen in table 2 below;Table 2. Predictive Efficacy of models & outcomes of predictions Paired Samples Test
 |
| |
|
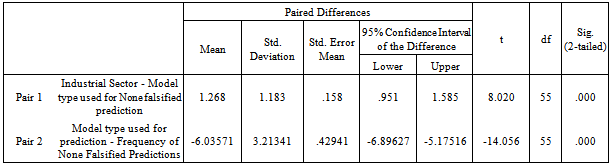
4.1. Discussion of Hypothesis 1 Test Outcomes
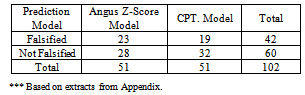
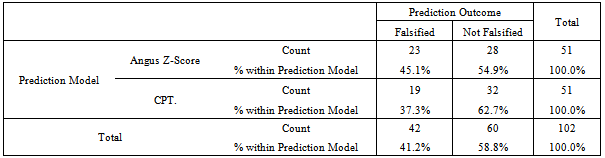
The outcome of the test as contained in table 2 showed that the predictive efficacy of the models used against outcome of predictions is very significant as p= 0.0001 which is less than stipulated 0.05 level of significance. Thus the paper stipulated hypothesis one which states that the predictive efficacy of Angus Z-Score and CPT. Models is not significantly different in discriminating between falsified and non-falsified financial statements is hereby rejected. The differences in predictions are vividly captured in table 3 below;Table 3. Cross tabulation Differences between Angus Z-score and CPT. Models’ prediction outcomes
 |
| |
|
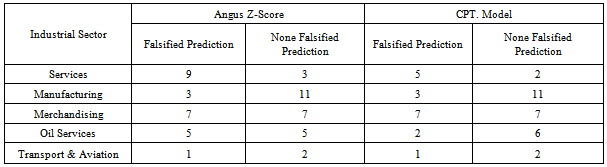
HO2: The predictive ability across industries between Angus Z-Score and CPT. Models is not significantly different.To test hypothesis two, extracts from the appendix in this respect appears as seen in table 4;Table 4. Industrial Sector Predictions of Angus Z-Score & CPT. Models
 |
| |
|
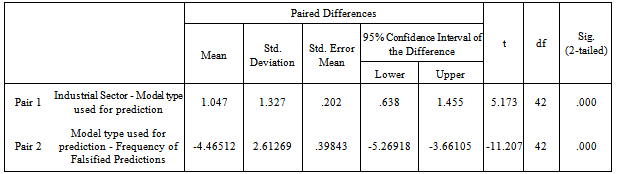
Applying T-test statistics on each aspects of the prediction outcomes, the results are as seen in tables 5 and 7 below;Table 5. T-test on Falsified Prediction outcomes of Angus Z-Score and CPT. models across Industrial Sectors
 |
| |
|
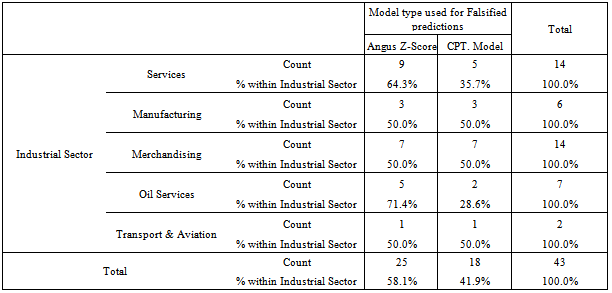
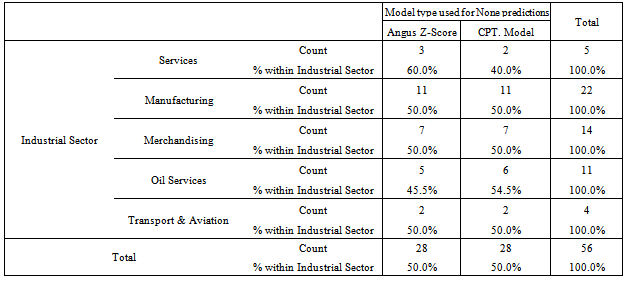
4.2. Discussion of Hypothesis 2 Test Outcomes
Table 5 test outcomes shows that there is significant differences in falsified prediction outcomes of the two models since p > 0.05. The differences captured in percentages across sampled industrial sectors are as contained in table 6 below. In this same respect, the outcome of Not- falsified test statistics shown in table 8 is also very significantly different across industrial sectors using Angus Z-score or CPT. Model. Their areas of differences are depicted using percentages as seen in table 8.Table 6. Cross tabulation differences on Falsified prediction outcomes of Angus Z-Score and CPT. Models
 |
| |
|
Table 7. T-test on Not Falsified Prediction outcomes of Angus Z-Score and CPT. models across Industrial Sectors
 |
| |
|
Table 8. Cross tabulation differences on Not Falsified prediction outcomes of Angus Z-Score and CPT. Models
 |
| |
|
5. Findings and Conclusions
It is easier and simpler to use Angus Z-Score model for testing and discrimination of Falsified Financial Statements and non-falsified ones. The predictive efficacy of Angus Z-Score and CPT. Models is significantly different. There is improvement on falsified predictive ability of Angus Z-Score over CPT. Model from 37.3% to 45.1%.Across Industrial Sectors, Angus Z-Score model’s falsified predictive ability increased in comparisons to CPT. Model in Services and Oil Service Sectors but remained unchanged in other sampled sectors.
ACKNOWLEDGEMENTS
I wish to acknowledgement that material portions of the attached appendix variables are reproduced with the permission of Academic Journals, the publisher of African Journal of Business Management which published Unegbu and Tasie (2011).
Appendix
Predictions of CPT. analyses model and Angus Z-score model
References
| [1] | Unegbu and Tasie (2011). Identification of false financial statements: A pre-ante tool for investment decisions, solvency analysis and bankruptcy predictions. African Journal of Business Management vol.5 (10) May. Pp.3813- 3827, 18 |
| [2] | Naser K and Pendlebury M (1992). The Creative Touch. Journal of Certified Accounting Vol.2 p36-38. |
| [3] | Beasley S.M, Carcello J.V. & Hermanson D.R (1999). Fraudulent Financial Reporting:1987- 1997; An Analysis of US companies, Research report from Committee of Sponsoring Organizations of the Tradeway Commission (COSO)P2-12. |
| [4] | Mulford, C.W and Comiskey E.M (2002). Creative Accounting: Prevention & Detectionhttp://www.pro2net.com. |
| [5] | Pietersz G (2007). Creative Accounting.http://www.moneyterms. Co.uk. |
| [6] | Okoye, Ukenna & Ugwanyi (2009). Understanding and explaining the underpinnings of Creative Accounting in Nigeria: The Cadbury Evidence. The Certified National Accountant, Vol.17. No1.p31 |
| [7] | Bertrand E. William (2010). Higher Education and Technology Transfer: The effects of Technolosclerosis on Development, Journal of International Affairs. Vol.64, No1, Pp101 -119. |
| [8] | Spathis T. Charalambos (2002). Detecting false financial statements using published data: some evidence from Greece. Managerial Auditing Journal, 17/4 Pp 179 -191. |
| [9] | Altman, E. (1968). Financial ratios, discriminant analysis, and the prediction of corporate bankruptcy, Journal of Finance, September, pp. 589-609. |
| [10] | Altman, E. (1983). Corporate Financial Distress: A Complete Guide to Predicting, Avoiding, and Dealing with Bankruptcy, John Wiley, New York, NY. |
| [11] | Kirkos Efstathios, Spathis Charalambos, Manolopoublos Yannis (2007). Detection of Fraudulent Financial Statements through the use of data mining techniques. Elsevier Journal of Expert Systems with applications No. 32, Pp 995 -1003. |
| [12] | Kotsiantis S, Koumanakos E, Tzelepis D (2006). Predicting fraudulent financial statements with machine learning techniques, SETN 2006, LNAI 3955, Springer-Verlag Heidelberg Pp.538 -542. |
| [13] | Kotsiantis S, Koumanakos E, Tzelepis D (2006b). Forecasting fraudulent financial statements using data mining. International Journal of Computational Intelligence vol.3 (2) Pp 1304 -2386. |
| [14] | Dikmen B and Küçükkocaoğlu G (2006). Detecting Earnings Manipulation: The Three Phase Cutting Plane Algorithm using Mathematical Programming.http:www.Scridbd.com/doc/41396038/Detecting-Earnings. |
| [15] | Küçükkocaoğlu G, Benli Y and Küçüksözen C (1997). Detecting the manipulation of financial information by using artificial neural network models, Istanbul Stock Exchange Review, Volume 9, No 36. |
| [16] | Sharma and Panigrahi (2012). A Review of Financial Accounting Fraud Detection based on Data Mining Techniques |
| [17] | International Journal of Computer Applications, Vol. 39. No. 1, PP 37 -47 |
 Abstract
 Reference
 Full-Text PDF
 Full-text HTML