-
Paper Information
- Next Paper
- Previous Paper
- Paper Submission
-
Journal Information
- About This Journal
- Editorial Board
- Current Issue
- Archive
- Author Guidelines
- Contact Us
International Journal of Finance and Accounting
p-ISSN: 2168-4812 e-ISSN: 2168-4820
2013; 2(1): 13-18
doi:10.5923/j.ijfa.20130201.02
Revaluation and Altman`s Z-score –the Case of the Serbian Capital Market
 Abstract
 Reference
 Full-Text PDF
 Full-text HTML
Saša Muminović
Julon d.d., Ljubljana, Aquafil Group, Ljubljana, Slovenia
Correspondence to: Saša Muminović , Julon d.d., Ljubljana, Aquafil Group, Ljubljana, Slovenia.
| Email: |  |
Copyright © 2012 Scientific & Academic Publishing. All Rights Reserved.
The bankruptcy prediction models based on accounting information are sensitive to accounting changes based on real business events and some based on artificial valuation as well. Revaluation is a concept primarily connected with fair value accounting and estimation of market price for classes of property, plants and equipment. In this paper, the hypothesis that elimination of revaluation, as artificial accounting change,from the balance sheet could increase the accuracy of Altman’s model has been tested. The aim of this paper is to establish how significant the impact of revaluation on Altman`s models calculation is. The results have shown that cosmetic changes cannot improve the accuracy of the Z score model. The results also confirmed previous research which rejected Z score application in Serbia. This research proves that the cosmetic changes cannot improve the accuracy of the Z score model. The users should turn to models created for local specific markets. Study[22] has shown that applying the models to time periods and industries other than those used to develop the models may result in a significant decline in the models’ accuracies.
Keywords: Altman- Z Score, Revaluation, Bankruptcy Prediction
Cite this paper: Saša Muminović , Revaluation and Altman`s Z-score –the Case of the Serbian Capital Market, International Journal of Finance and Accounting, Vol. 2 No. 1, 2013, pp. 13-18. doi: 10.5923/j.ijfa.20130201.02.
Article Outline
1. Introduction
- The anticipation of a potential bankruptcy, i.e. signalization of potential business and financial difficulties, has always been a subject of high interest. It also represents one of the basic tasks of financial analysts. There are number of studies related to this issue: Altman and Narayanan pointed out that there is a review 44 separate published studies relating to 22 countries outside the US[1]. Current crises have increased that interest even more.The primary methods used for bankruptcy prediction model development are multivariate discriminant analysis (MDA), logit analysis, probit analysis, and neural networks[2]. Altman`s Z Score is based on multivariate discriminant analysis.Several pieces of research attempted to implement Altman Z Score in transition countries, in Croatia[3] and in Serbia[4] and they ended with unsatisfactory results. In Croatia Error Type I was 24.58%, Error Type II was 39.24%, with overall accuracy of 68.09%. In Serbia however, Error Type I could not be calculated and Error Type II was 32.4%. The shortcomings of Altman`s Z score also caused the development of new bankruptcy prediction models adapted to local contexts – e.i. BEX Model[5]. Despite unsatisfactory results in testing, model is widely used and results are taken for granted i.e.[6].So, if the results of testing were unsatisfactory, why is it important to test the revaluation impact on Altman`s models, except for the fact that the model is widely used? The review of relevant literature, except Belak in 2011[7], does not recognize elimination of revaluation as a factor for improvement of the bankruptcy prediction models. The first reason lies in the fact that during the development of the Altman`s model the concept of revaluation of fixed assets, connected to fair value accounting, was not in use. Fair value was firstly defined in 1982 in IAS 20, but within the E.U. directive it has been allowed since 2001[8]. Secondly, Z score (the original and revised version) is an accounting based model. Such models may require redevelopment from time to time to take into account changes in the economic environment to which they are being applied. As such, their performance needs to be carefully monitored to ensure their continuing operational utility[9]. The third reason is connected to revaluation itself. Subsequent to initial recognition of an asset at cost, classes of property, plant and equipment may be carried at revalued amounts. The revalued amount should be the fair value - the market price determined by appraisal. If the allowed alternative treatment is used, revaluations should be made regularly so that the carrying amount of the asset does not differ materially from the fair value at the Balance Sheet data - IAS 16[10].Finally, the forth reason is connected to the fact that between the elimination of the revaluation and the increase of profitability, measured by ROE and ROA indicators, is strong positive correlation, which cannot be neglected in bankruptcy prediction and in assessment of creditworthiness. Also revaluation has a positive impact on indebtedness i.e. total debt / capital ratio - it reduces the leverage ratio.The importance of revaluation is not only connected to accounting issues. Several researches,for example in Brazil and UK, have demonstrated that revaluations of fixed assets are positively related to changes in future performance measured by an operating income. Also, revaluations are also significantly positively related to stock prices showing that revaluation reserves are value relevant[11,12].
2. Design / Methodology / Approach
- The sensitivity of Altman`s original Z score, revised Z` score and Z``score (EMS) Model has been tested on revaluation on a sample of Serbian companies. Calculations for stocks that represent the Serbian capital market are based on data published in prospectuses on the website of Belgrade Stock Exchange. Stocks of non-banking sector which entered into the composition of Belexline index during the period 2006-2009 were included in the calculation. The research is based on previous researchand testing of Altman`s model on Serbian market[4] and data base published on Belgrade Stock Exchange web page[13]. From original sample of 44 non-distressed companies, we have selected all which have the revaluation in their financial statements (29, 30, 30 and 28 financial statements in period 2006-2009). As always, we have to emphasize that the lack of reliable data is a constant problem influencing all analyses on Serbian capital market. We have observed the degree of relationship between changes in Altman`s model due to the revaluation share in total assets, fixed assets and the revaluation share reserve in capital. The samples were tested for heteroskedasticity and the assumption was rejected.Based on described problem, basic hypothesis was set out that we seek to prove in the empirical part of the research:H1: Revaluation has a significant impact on the value of Altman`s models because of its role in the balance sheet to increase the value of revalued assets on the one hand and the increase of capital on the other. H1.1: The elimination of revaluation, as artificial accounting change, from the balance sheet could increase the accuracy of Altman`s model.The aim of this paper is to establish how significant the impact of revaluation on Altman`s models calculation is.
3. Theoretical Background
- Altman in 1968[14] extended Beaver’s[15] unvaried analysis and developed a discriminant function which combines ratios in a multivariate analysis: Z = 0.012X1 + 0.014X2 + 0.033X3 + 0.006X4 +0.999X5Where,X1= working capital/total assetsX2= retained earnings/total assetsX3= earnings before interest and taxes/total assetsX4= market value of equity/book value of total liabilities X5= sales/total assetsZ = overall index.From model`s parameters it could be seen that model combines a number of financial statement and market value measures. Over the years many individuals have found that a more convenient specification of the model is of the form: Z = 1.2X1 + 1.4X2 + 3.3X3 + 0.6X4 + 1.0X5.Due to the original model, companies with Z-scores less than 1.8 are predicted to be bankrupt, and companies with Z-scores greater than 2.99 are predicted not to be bankrupt. The area between 1.81 and 2.99 is defined as the zone of ignorance or grey area. Given that the original model requires stock price data, it couldn’t be applied to companies in the private sector. In the revised model[16], substituting the book values of equity for the Market Value in X4, resulted in decrease of impact on the Z-Score, but the scaled vector results show that the revised book value measure is still the third most important contributor.The result of the revised Z-score model with a new X4 variable is:Z’ = 0.717X1 + 0.847X2 + 3.107X3 + 0.42X4 + 0.998X5Private companies with Z’-Scores less than 1.23 are predicted to be bankrupt, and companies with Z’-Scores higher than 2.9 are predicted to not be bankrupt. The area between 1.23 and 2.9 is defined as the zone of ignorance or grey area.Based on previously developed model for non-manufacturers, which didn’t contain the sales/total assets ratio in order to minimize the potential industry effect, Altman, Hartzell, and Peck in 1995[17] created the emerging market scoring (EMS) model to assess the financial health of non - U.S. companies, specifically Mexican companies that had issued Eurobonds denominated in U.S. dollars. The new Z"-score model is: Z" = 6.56 X1 + 3.26 X2 + 6.72 X3 + 1.05 X4The book value of equity was used for X4 in this case. Companies with Z"-scores less than 1.1 are predicted to be bankrupt, and companies with Z"-scores greater than 2.6 are predicted to not be bankrupt. The area between 1.1 and 2.6 is defined as the zone of ignorance or grey area[18]. The necessary modifications for eliminating the revaluation effect from all three formulas are as follows[7]:X1= working capital / (total assets - revaluation reserves - deferred taxes on profit)X2= retained earnings / (total assets - revaluation reserves - deferred taxes on profit)X3= earnings before interest and taxes / (total assets - revaluation reserves - deferred taxes on profit)X4= market value of equity / (book value of total liabilities - deferred taxes on profit)X5= sales / (total assets - revaluation reserves - deferred taxes on profit)And X4 for Z` and Z``:X4= (book value of equity- revaluation reserves) / (book value of total liabilities - deferred taxes on profit).
4. Results of the Research
4.1. The Impact of Revaluation on ROA and ROE indicators
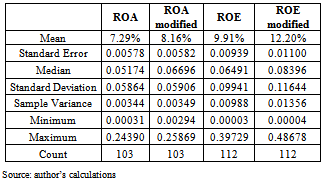
- The average values of profitability i.e. how well equity capital was invested, measured by Return on equity (ROE) for observed sample was 9.91 %. After eliminating the revaluation reserves from formula for calculation ROE indicator (Net result / (Equity – Revaluation reserves), modified average value increased to 12.2%. Considering that revaluation is an optional accounting change increase of average profitability for 23% could be considered as significant.The same was with ROA, as a key ratio of profitability, indicating how efficiently a company’s assets are employed. %. After eliminating the revaluation from formula for calculation ROA indicator (Operating result / (Total Assets – Revaluation), modified average value increased from 7.29% to 8.16%. That increase of average profitability for 12% could be also considered as significant. That means that in artificial changes could be very important in company analysis.
|
|
4.2. The Impact of Revaluation on Indebtedness
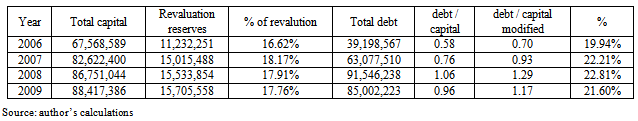
- Observing the indebtedness of the companies in the sample, measured by total debt to capital ratio presented in table 3, it could be seen an increase of from indebtedness 0.58 to 1.06 from 2006 to 2008, and slightly decrease in 2009. In 2006, 2007 and 2009 ratio was lower than 1 which indicates that total debt is fully covered by total capital.On the other hand, the elimination of revaluation from the total capital indebtedness increases from 19.94% in 2006, as minimum, to 22.81% in 2008, as maximum. In 2008 and 2009 ratio was even higher than 1. It is also interesting that revaluation reserves are stable despite the fact that current crises have strongly decreased the market prices of the real estates. According to the fair value concept and new market condition revaluation should decreased in 2009.
4.3. The Impact of Revaluation on Altman`s Models
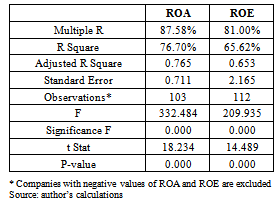
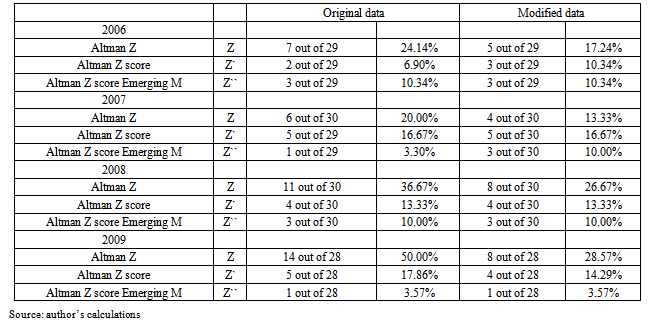
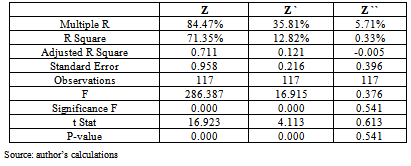
- The result of the elimination of revaluation impact from Altman`s models are presented in table 4. The biggest impact on Error type II was on original formula due to the fact that in X4 market value of equity was not corrected. Revaluation makes original Altman`s Z score worse as a consequence of the fact that Model’s parameter X3 is based on profitability and it has the highest impact. The profitability always decreases if the value of the assets increases and the value of profit (gain) remains the same. On the other hand debt to equity ratio in Model (X4) is improved with revaluation, but it has three times lower impact. Also, in some balance sheet deferred taxes on profit are not posted. The main problem in applying the original formula on Serbian market (in transitional market) is in market value of equity. Research [19] has proved that the Serbian capital market does not reflect the real value of shares and the Serbian financial market is not important for Serbian economy.The Error type II for Z` and Z`` was without changes, or slightly change. The reason for that was also in X4, but this time revaluation reserves were deducted from book value of equity making worse that ratio more than was the gain from increasing X3.The impact of elimination of revaluation on Error Type I could not be tested because calculation of Error Type I was not possible for Z score. There are two main reasons for that. The first is in the fact that in parameter X4 - market value of equity does not exist. And the second reason is in inadequate application of bankruptcy procedure and political will (see more in[20]). Also, the sample was too small to be considered. Replacing in X4 market value of equity with book value of equity for Z` score and Z``score calculation, modified formula did not provide any changes.One of the significant differences between USA companies from which the model was developed and national companies from post-transition and transition economies is the share of intangible assets. The results of the analysis prove that in the period 2004-2008 intangibles constituted an important asset for traditional market economies, which does not result for post-transition and transition economies, despite the fact that many analyses underline their growing significance in today’s business environment. The difference between selected companies implies the fact that post-transition and transition economies operate with a significantly lower share of intangibles in comparison with traditional market economies[21].Analysis has shown that there is strong correlation between revaluation share in total asset and changes in Z score results for observed sample (table 5). The degree of relationship between changes in Z score due to the revaluation share in total asset was 84.47%, which shows a high positive correlation. A statistical measure of how well the regression line approximates the real data points or coefficient of determination was 71.35%.The degree of relationship between changes in Z` score and Z``score due to the revaluation share in total asset was significantly lower at 35.81% and 5.71%. Also, in research changes in Altman`s models due to the changes in revaluation share in fixed asset and revaluation share in capital were tested, but Multiple R and R Square were lower compared to changes in Models due to the revaluation share in total asset.
|
|
|
5. Conclusions
- There are several web sites which, for a fee, provide information of about companies’ performance in Croatia and Serbia including Z score. The Model has been in use without proper testing procedure by banks and for scientific purposes and the results are taken for granted. As the use of Altman`s models in the region increase, it is important to understand what it`s accuracy and limitations. Also, what could influence the calculated value and how that influence could be mitigated? The results are not a great surprise taking into consideration the nature of bankruptcy prediction models. Here, we must not forget Taffler’s remark about z-score model which could be applied to all MDA - Multiple Discriminant Analysis models: Strictly speaking, what a z-score model asks is does this firm have a financial profile more similar to the failed group of firms from which the model was developed or the solvent set?[23].The hypothesis H1, of this research, was partly confirmed. Although there is a significant correlation between the changes in share of revaluation in total asset on the observed sample, the significance of excluding the revaluation is not important. The excluding the revaluation from calculation is irrelevant. The hypothesis H1.1 was not confirmed. The elimination of the artificial accounting change - revaluation, from the balance sheet cannot increase the accuracy of Altman`s model to make it useful in bankruptcy prediction.As it was expected revaluation changes company`s performance i.e. profitability and indebtedness because of the formula structure for calculation ROE, ROA and debt to capital ratio. The problem arose from the fact that fair value concept was not applied consistently. In years of increase of market prices the value of the asset was increased, but in years of the crises when market prices declined the reverse posting in balance sheets was not done. That opens some space for manipulation with profitability and indebtedness indicators.On the other hand, there are some remaining questions to be answered in the subsequent research. As two of the Model’s parameters are based on profitability and the profitability always decreases if the value of the assets increases and the value of gain remains the same, the questions are: What is the impact of investments (and how significant is it)? And how does the method of financing (debt or new capital increase) of those investments influence the value of bankruptcy prediction models?