-
Paper Information
- Paper Submission
-
Journal Information
- About This Journal
- Editorial Board
- Current Issue
- Archive
- Author Guidelines
- Contact Us
International Journal of Finance and Accounting
p-ISSN: 2168-4812 e-ISSN: 2168-4820
2012; 1(6): 179-189
doi:10.5923/j.ijfa.20120106.06
The Effect of Inflation, Interest Rates and Exchange Rates on Stock Prices Comparative Study Among Two Gcc Countries
 Abstract
 Reference
 Full-Text PDF
 Full-text HTML
Mahfoudh Hussein Hussein Mgammal
OYA Graduate School of Business, Universiti Utara Malaysia Sintok, Kedah, Malaysia
Correspondence to: Mahfoudh Hussein Hussein Mgammal, OYA Graduate School of Business, Universiti Utara Malaysia Sintok, Kedah, Malaysia.
| Email: |  |
Copyright © 2012 Scientific & Academic Publishing. All Rights Reserved.
The main purpose of this paper is to investigate whether stock prices and exchange rates are related to each other or not. Both the short term and the long term association between these variables are discovered. The study applies monthly and quarterly data on two gulf countries, including Kingdom Saudi Arabia (KSA) and United Arab Emirate (UAE) for the period January 2008 to December 2009. The results of this study in the short term found that the exchange rate influence positively on the stock market price index for United Arab Emirate and there is no association between them for Kingdom Saudi Arabia. Moreover the study in the long term found that the exchange rate influence negatively on stock market price index for the United Arab Emirate. While no association between these variables in Kingdom Saudi Arabia.
Keywords: Exchange Rates, Market Prices Index, Stock
Cite this paper: Mahfoudh Hussein Hussein Mgammal, The Effect of Inflation, Interest Rates and Exchange Rates on Stock Prices Comparative Study Among Two Gcc Countries, International Journal of Finance and Accounting , Vol. 1 No. 6, 2012, pp. 179-189. doi: 10.5923/j.ijfa.20120106.06.
Article Outline
1. Introduction
- This article aim to examine the association between exchange rates and stock market price index whiles at the same time considered a lot of factors, have an impact on everyday stock prices such as enterprise performance, dividends, stock prices of other countries, gross domestic product, exchange rates, interest rates, current account, money supply, employment, etc[23]. In particular, the continuing increases in the world trade and capital movements have made the exchange rates as one of the main determinants of business profitability and equity prices[22]. The association among stock prices and exchange rates has preoccupied the brains of economists for the reason that both of them play major roles in influencing the development of a country’s economy. In the recent years, because of increasing international diversification, cross-market return correlations, gradual abolishment of capital inflow barriers and foreign exchange restrictions or the adoption of more flexible exchange rate arrangements in emerging and transition countries, these two markets have become interdependent. Therefore, the varieties of investment opportunities have been increased by these changes. Economic theory postulates the important variables in understanding the behavior of stock prices and predicting the trends and movements in exchange, rates include interest rates, inflation, the price level, and money supply and other factors. Traditional economic models argue that balance sheet items of a firm affect by changes in exchange rates through its competitiveness as expressed in foreign currency and ultimately, profits and equity.[9],[18],[29], and[42] have found some association between exchange rates and macroeconomic variables. Basically, there are two theories that link exchange rates and stock prices: The traditional approach argues that currency depreciation will result in higher exports and therefore corporate profits resulting in higher stock prices in the short run. According to this approach, the transmission mechanism is the competitiveness of the firm’s expertise, resulting in changes in the value of the firm's assets and liabilities culminating in higher profits and reflecting its stock prices. This association is attributed to[39]. He argued that a bad news for Domestic Corporation is a real currency appreciation, because it will reduce its competitive ability to export, while a real depreciation enhances its ability to export in the short run. Portfolio adjustment approach is another theoretical argment in the association amid stock prices and exchange rates. According to this theory, portfolio adjustments [movements in the foreign capital- inflows and outflows of foreign capital] occur whenever there is a change in the stock prices. More foreign capital will attract, if stock prices are on the increase. However, a decline in the stock prices will result in diminished corporate wealth leading to the reduction in the country’s wealth. This may lead to a fall in the demand for money and monetary authorities reduce the interest rates to alleviate this situation. When interest rates are lower (relatively speaking), capital may flow out of the country to take advantage of higher interest rates in another part of the world resulting in currency depreciation. Therefore, according to Portfolio adjustment theory, lower stock prices may lead to currency depreciation.Finally, in order to examine the impact of exchange rates in the context of stock market prices index. The specific objectives are to investigate whether the association between stocks market prices index and exchange rates of KSA and UAE in short term (monthly) also, to investigate whether the association between stocks market prices index and exchange rates of KSA and UAE in long term (quarterly). The research questions of this study are raised in order to provide answers to achieve the above-mentioned research objectives. This study basically focuses whether the stock market price index might relate to the exchange rates in KSA and UAE. Is there an association between stock market price index and exchange rates in KSA and UAE in short term (monthly)? and, is there an association between stock market price index and exchange rates in KSA and UAE in long term (quarterly)?
2. Literature Review
- For the past few decades, the association between exchange rates and stock markets has been given much attention in the academic literature. Studies have attempted to determine how one financial market can predict the others and vice versa. The first study by Franck and[17] examined the association among stock prices and exchange rates. They employ six diverse exchange rates and found no association among exchange rates and stock prices.[2] discovered the association between changes in the dollar exchange rates and change in indices of stock prices. He used monthly U.S. stock price data and the effective exchange rate for the period 1974-1978. The consequences based on simple regressions, showed that stock prices and the value of the U.S. dollar is positively related and this association is stronger in the short run than in the long run.Furthermore,[39] examined the impact of numerous variables (exchange rates, interest rates, and changes in inflationary expectation) on stock prices. Monthly data used in this study from nine western markets (U.S., U.K., Japan, Germany, France, Canada, Netherlands, Switzerland, and Belgium).the study found depreciation to have a positive but insignificant influence on the U.S. stock market compared to change in inflationary expectation and interest rates.[36], observed the association between exchange rate changes and price stage modifies in Turkey by employing the Granger causality tests. While causality examinations are sensitive to lag selection, as well as, Libly employed three dissimilar particular methods for optimal lag selection[i.e., an arbitrarily selected,[20] and the SMAR or subset model auto regression method of[44]]. He found in the all cases, that causality runs from price rank modify to exchange rate changes but there is no feedback causality from the exchange rate to price level changes.Moreover,[7] found that contemporaneous changes in the dollar have small authority in explaining abnormal stock returns. Consequently, they found a lagged modify in the dollar is negatively connected with abnormal stock returns. Otherwise, the regression results showed that a lagged modify in the dollar has explanatory influence with respect to errors in analysts' forecasts of quarterly earnings.[26] applied Granger causality tests and impulse answer occupation for nine Asian countries to inspect the causality issue. They use daily data for the period January 3, 1986 to November 14, 1997. The countries included in their study are Hong Kong, Indonesia, Japan, South Korea, Malaysia, Philippines, Singapore, Thailand and Taiwan. They found that exchange rates lead stock prices with positive correlation in Japan and Thailand. The data from Taiwan recommends stock prices guides exchange rates with negative association. No association was found in Singapore and bi-directional causality was exposed for the remaining countries.In line with,[27] look at the association between stock prices and exchange rates by using Nonlinear Least Square method. They found that U.S. share price returns completely replicate information conveyed by movements in both the Japanese yen and the French France following four weeks. Their consequences, however, recommend a very pathetic association between the U.S equity market and exchange rates. They concluded that depreciation in a country's currency would affect its share market returns to get higher, whereas an appreciation would have the opposite effect.[6] engaged cointegration technique to study the long-run association between stock prices and exchange rates for nine Asian countries (Malaysia, Japan, Taiwan, Indonesia, Singapore, Thailand, Korea, Hong Kong, and Philippines). They utilize monthly data over the period from January 1980 to June 1998. They found the long-run association between stock prices and exchange rates merely for Singapore and Philippines. They credited this lack of cointegration between these two variables to the bias shaped by the “omission of important variables”. They found cointegration between stock prices, exchange rates and interest rate for six of the nine countries when interest rate variable was integrated in their cointegrating equation.Although,[33] take the daily close stock market indices and foreign exchange rates for G-7 countries to examine the association between stock prices and exchange rates and for the period from October 1, 1993 to February 15, 1996. They found that there is no long-run equilibrium connection between stock prices and exchange rates for each G-7 country. Whereas they found significant relationship one day’s short-run in certain G-7 countries, there is no significant correlation in the United States. These results might be explained by each country’s differences in economic stage, government policy, expectation pattern, etc.[30] examine the exchange rates and stock price relationships for Pakistan, India, Bangladesh and Sri Lanka using monthly data from 1994 to 2000. The experimental consequences show that there is a bi-directional long-run causality between these variables for only Bangladesh and Sri Lanka. No associations between exchange rates and stock prices are found in Pakistan and India.In the same line,[22] used monthly data for the period from 1974:01-1998:12 in the United Sates America. The experimental consequences of the study reveal that S&P’s common stock price is negatively connected to the exchange rate.[40] in Cyprus examines the association between stock prices and macroeconomic factors. He shows by this study strong association between stock prices and exchange rates. The cause of this is that Cypriot economy depends on services (import sector) such as tourism, off shore banking etc.[21] analyze dynamic connections between stock prices and four macroeconomic variables for Malaysia and use monthly data over the period 1977-1998. The empirical results show that the exchange rate is negatively associated with the stock prices. Nevertheless,[15] investigate the dynamic relationship among stocks and exchange rates for six Asian countries (Indonesia, Malaysia, Philippines, South Korea, Thailand, and Taiwan) over the period 1989-2003. According to the study, these financial variables are not cointegrated. The result of Granger causality test shows that bidirectional causality can be detected in Indonesia, Malaysia, Korea, and Thailand. In addition to, they found that there is an extensively negative relative between the stock returns and the contemporaneous change in the exchange rates for all countries except for Thailand[34] examines the causal association between stock prices and exchange rates for USA by using quarterly data over the period from 1960 to 2004. He found that no causal relationship and no cointegration among these two financial variables. According to,[41] empirically, searches the exchange rates and stock prices nexus for large-cap and small-cap stocks by using a Granger causality methodology for the era 1987-2005 in the USA. The consequence of the study found that there is Granger causality from large-cap stocks to the exchange rate. However there is no causality for small-cap stocks. Stock prices and exchange rates are affected by the similar macroeconomic variables and changes in federal monetary policy in the USA have a significant effect on the nature of these associations. In other hand, the nature of the association between stock prices and exchange rate is changing over time.[23] chooses the period March 2001-September 2005 to investigate the association between macroeconomic variables and each day stock prices in Japan. He takes Japanese stock prices, U.S. stock prices, exchange rate (yen/U.S. dollar), the Japanese interest rate et cetera. The investigational consequences exemplify that domestic interest rate does not influence Japanese stock prices. Nonetheless, the exchange rate and U.S. stock prices affect Japanese stock prices. Consequently, the quantitative easing policy implemented in 2001 has influenced Japanese stock prices. Further,[35] examine dynamic linkages between exchange rates and stock prices by taking the data of seven East Asian countries over the period 1988 to 1998. The result of study reveals that there is a bidirectional causal relation to Hong Kong before the 1997 Asian crises. In addition, there is a unidirectional causal relation from exchange rates and stock prices in Japan, Malaysia, and Thailand and from stock prices to exchange rate for Korea and Singapore. During the Asian crises, there is only a causal relation from exchange rates to stock prices for all countries except Malaysia. However,[16] examined exchange rates-stock price relations for 13 developing economies using a different time period for each country. The findings provide evidence to indicate causality relations for eight economies. While there is a unidirectional causality from stock price to exchange rates in the five of them, bidirectional causality is being for remaining three economies. They also found no causality for these financial variables in Turkey and this finding is not consistent with our results. The reason of the difference may be the time period used.[37] analyze energetic linkages flanked by stock prices and exchange rate for Turkey by utilizing monthly data from 1986 to 2006. They found positive and bidirectional causality between these two financial variables. Other research by,[28] investigated possibility of connections between stock prices and exchange rates in the emerging economy of Bangladesh. They used monthly nominal exchange rates of US dollar, euro, Japanese yen, pound sterling and monthly values of Dhaka Stock Exchange General Index for the period of June 2003 to March 2008. They found that there is no cointegrating association between stock prices and exchange rates. Therefore, Granger causality test shows that stock prices Granger causes exchange rates of US dollar and Japanese yen but there is no way causal association between stock prices and exchange rates of the Euro and pound sterling.Prior research by,[10] estimated the effect of exchange rate on the stock market in Ghana. By taking Treasury bill rates, money supply, foreign exchange rate, inflation and trade deficit as independent variables, using Exponential Generalized Autoregressive Conditional Heteroskedascity (EGARCH) description that there is a positive association between the stock market and the consumer price index. They also found that whenever the inflation rate is higher the volatility of stock returns also high. Overall their result shows that the relationship between macro variables and stock returns are significant.[13] examined the interface among the stock prices and the exchange rates and inspected whilst the unpredictability of stock returns influences their correlation. Weekly data for Malaysia, Indonesia, Philippines, Korea, Taiwan, and Thailand over the era 2000 to 2008 are used in this study. They found that there are important price spillovers from stock returns to exchange rate changes for Malaysia, Korea, Indonesia, Thailand and Taiwan. Furthermore, as the stock return volatility raises, and then the correlations becomes higher in Asian emerging countries except the Philippines.Notwithstanding,[8] examined the market, Interest rate and Exchange rate risk effect on the financial Stock returns. To examine this fact they selected three sectors (Banking, Financial Services and Insurance) of 16 different countries including some European countries. They used four-variate GARCH-M Model. Their variables were short-term debt (90-Day treasury Bills Rate) and 10-years Government bond yield for all the countries. Overall results showed that interest rate and exchange rate effects common in banking sector and financial services but in insurance sector interest rate and exchange rate has limited effect.[24] examines the association between stock prices and exchange rates in Mexico by using weekly data starting from the first week of January 1989 in the last week of December 2006. The Granger causality test is used in this study shows that stock prices lead exchange rates in the short run, and there is no long run relationship between these two variables.Moreover,[3] examine the relationship between stock return, interest rate and exchange rates in Pakistani economy. For this, the data on the short term interest rate, exchange rate (Rs/US $) and stock market returns (KSE-100) over the period of 1998-2009 is collected. A multiple regression model is applied to test the significance of change in interest rate and exchange on stock returns. The results show that both the change in interest rate and change in exchange rate has a significant impact on stock returns over the sample period.[5] in Pakistan used data from June 1990 to December 2008 to examine the causal association between macro-economic meters and stock market prices. The position of macro-economic meters consist of; inflation, exchange rate, balances of trade and the index of industrial production, while the stock exchange prices have been represented through the general price index of the Karachi Stock Exchange, which is the biggest stock exchange in Pakistan. The statistical techniques used consist of unit root Augmented Dickey Fuller test, Johansen’s co-integration and Granger’s causality test. The study found co-integration between industrial production index and stock exchange prices. Nevertheless, no causal association was found among macro-economic indicators and stock exchange prices in Pakistan. Which means the performance of macro-economic indicators cannot be used to forecast stock prices; moreover, stock prices in Pakistan do not replicate the macro-economic condition of the country.Based on the above literature review, the above studies clearly indicate a strong interest on the association between the exchange rate and stock prices with the use of different methodologies and data sets. There is no consensus among researchers on the empirical validity of the association between stock prices and exchange rates; however, suggesting that further research is needed to shed light on this issue. This interest on whether stock prices and exchange rates are related has turn out to be additional pronounced especially after the East Asian crisis. Through what had seen the crisis-affected countries in turmoil all the stock markets and currencies. If you are associated with stock prices, exchange rates and causality run from exchange rates to stock prices and crises in the stock markets can be prevented by controlling the exchange rates. In addition, countries can use this link to attract foreign investment to increase the portfolio in their own countries. Instead, if the causality runs from stock prices to exchange rates then the authorities can focus on national economic policies to achieve stability in the stock market. If a connection between two years and market prices, investors can then use this information to predict market behavior using information from other market.
3. Hypothesis
3.1. Hypotheses Development
- As mentioned above there are two theories that link exchange rates and stock prices: The traditional approach argues that currency depreciation will result in higher exports and therefore corporate profits resulting in higher stock prices in the short run. In addition, Portfolio adjustment approach is another theoretical argument in the association between stock prices and exchange rates. According to this theory, portfolio adjustments[movements in the foreign capital- inflows and outflows of foreign capital] occur whenever there is a change in the stock prices. Most foreign capital will attract, if stock prices are on the increase. However, a decline in the stock prices will result in diminished corporate wealth leading to the reduction in the country’s wealth. Hence according to these two theories there are so many studies examine the association between these two variables and found different results,[2] showed that stock prices and the value of the U.S. dollar is positively connected and this association is stronger in the short run than in the long run[26] found that exchange rates lead stock prices with positive correlation for Japan and Thailand.[37]. Found positive and bidirectional causality between stock prices and exchange rate in short run for Turkey.[24] shows that stock prices lead exchange rates positively in the short run, and there is no long run relationship between these two variables. Hence, the following hypotheses are developed.H1: There is a positive relationship between stock market price index and exchange rate in short term.H2: There is a negative relationship between stock market price index and exchange rate in long term.
3.2. Model and Variables Measurement
- The variable's stock market price index as dependent variable and exchange rate as independent variable used in this study are derived through a review of literature including: e.g.[24];[3];[13];[35]; and so many. Therefore some literature used interest rate and inflation rate as independent variables and they found relationship between them with stock market index which including: e.g.[3];[9];[5]; and so many. Hence, this study will use the interest rate and inflation rate as control variables. Thus, the following multiple regression analysis will be used to examine the association between exchange rate as independent variable and (interest rate, inflation rate) as control variables with stock market price index as dependent variable.SMPI = β0 + β1 ER + β2 ITR + β3 IFR + ε.Where dependent variable is stock market price index (SMP) that is measured by the average price Weighting. As well as exchange rate (ER) in this study used as independent variable, that is measured by local bilateral spot exchange rates as domestic currency per US dollar for each time. Moreover interest rate (ITR) in this study used as one of control variable that measured by sensitivity of consumer depositors index. Inflation rate (IFR) is the second control variables that used in this study this variable measured by consumer price index. However, in this study will use index for these markets so the information for these entire variable was ready in the market.
3.3. Data Analysis
- This study will use different statistical tests to examine the relationship between these two variables. First, the descriptive statistics will be used to describe the characteristics of the sample; these mainly include mean, median, and standard deviation. Second, linear regression will be employed to analyze the effect of exchange rates on stock market index.
3.3.1. Analysis for Short term (Monthly Data)
- The analysis of this study start by short term data (monthly) to investigate whether there is a relationship between stock market price index and exchange rates over this period and before using control variables, so the following types of analysis which used in this study.
3.3.1.1. Descriptive Analysis
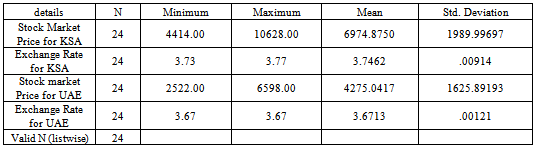
- This section of this study provides the descriptive results in which the measure of central tendency and dispersion appear for each variable. The distributions appear in order to provide a visual depiction of the distribution of for each variable. The means provided a measure of central tendency; the standard deviations provided a measure of variability.To start with, Table 1 provides the descriptive statistics for stock market index for both UAE and KSA. The results in Table 1 indicate that for the meanness of the stock market index was for KSA 6974with minimum and maximum value about 4414 and10628, respectively. Whereas the mean of the stock market of UEA was 4275 with regard to minimum and maximum, it was 2522 and 6598, respectively. Furthermore, desperation measured by the standard deviation was1989 for KSA and 1625 for UAE. In addition, the descriptive results indicated exchange rate variable for both countries varied substantially over the years. The mean of exchange rate for KSA was 3.74 with minimum and maximum value about 3.73 and 3.77, respectively. While the mean of exchange rates of UAE was 3.67 with regards minimum and maximum, it was 3.67 and 3.67, respectively. Moreover, desperation measured by the standard deviation was .00914 for KSA and .00121 for UAE.
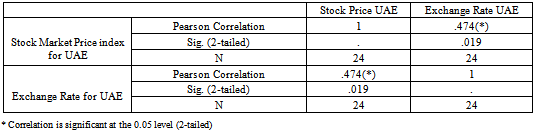
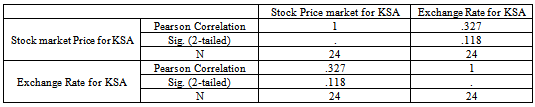
3.3.1.2. Correlation Analysis
|
|
|
3.3.1.3. Regression Analysis
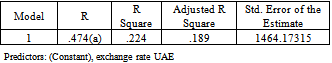
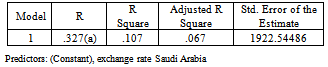
- In this section, the linear regressions are explained. The aim of this test is to determine the predictive power of the independent variables (in this case the exchange rate) toward the dependent variable (referring to stock market price index). Linear regression provides the relative contribution for the independent variable. For example, R² indicates how well a set of variables is able to predict a particular outcome. The standard value for R² is 1 which means that there is a perfect linear relationship between the dependent and independent variables. On the contrary, R² value equal to 0 indicates that there is no linear relationship between the dependent and independent variables. Standard multiple regression also provides an adjusted R² value. “The adjusted R² statistic ‘corrects’ R² value to provide a better estimate of the true populations value”. In this study the adjusted R² for UEA and KSA were 0.189 and 0.067 respectively. To sum up, the result in table below shows a positive significant relationship between Stock market price index and exchange rate for UEA (t = 2.522, p > .01). The result suggests that for each unit increase in exchange rate, there is an expected increase of Stock market price index. Moreover, the result in table below shows a positive relationship between Stock market price index and exchange rate in KSA (t = 1.625, p > .11).
|
|
3.3.2. Analysis in Short Term with Control Variables
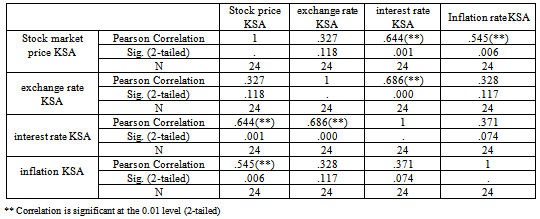
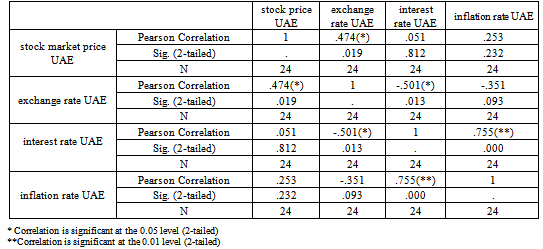
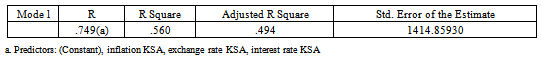
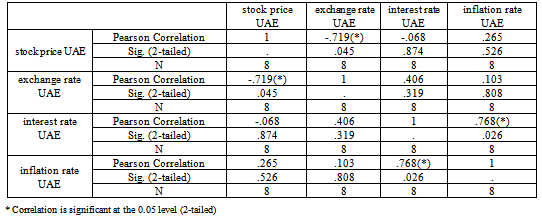
- This study mentioned above that will use interest rate and inflation rate as control variables to show the relationship on stock market price index with all these variables in the short term.The table above provides the descriptive statistics for stock market index and the other three variables for KSA. The results indicate that for the meanness of the stock market index was 6974with minimum and maximum value about 4414 and10628, respectively as well as desperation measured by the standard deviation was1989. Whereas the mean of the exchange rate of KSA was 3.75 with regard to minimum and maximum, it was 3.73 and 3.77, respectively and the desperation measured by the standard deviation was .00914. In addition, the descriptive results indicated interest rate as a control variable for both countries varied substantially over the years. The mean of interest rate for KSA was 4.2417 with minimum and maximum value about 2.00 and 5.50, respectively, while desperation measured by the standard deviation was 1.238. Moreover, the descriptive results indicated inflation rate as another control variable for both countries varied substantially over the years. The mean of the inflation rate for KSA was 7.4767 with minimum and maximum value about 3.50 and 11.08, respectively; also, desperation measured by the standard deviation was 2.73295.The table above provides the descriptive statistics for stock market index and the other three variables for UAE. The results indicate that for the meanness of the stock market index was 4275with minimum and maximum value about 2522 and 6598, respectively, So the desperation measured by the standard deviation was1626. Whereas the mean of the exchange rate of UAE was 3.6713 with regard to minimum and maximum, it was 3.67and 3.67, respectively and the desperation measured by the standard deviation was .00121. Furthermore, the descriptive results indicated interest rate as a control variable for both countries varied substantially over the years. The mean of interest rate in UAE was 2.6525 with minimum and maximum value about 1.48 and 4.60, respectively, as well as desperation measured by the standard deviation was .94659. In addition, the descriptive results indicated inflation rate as another control variable for both countries varied substantially over the years. The mean of inflation rate in UAE was 8.90 with minimum and maximum value about 1.56 and 12.30, respectively; also, desperation measured by the standard deviation was 3.03110.The results of the relationship between the independent variables and control variables with the dependent variables for KSA are shown in table 8. The result in this table indicates that the relationship between Stock market price index and the exchange rate for KSA was positive but statistically not significant (r = .32, p = .11). as well as there is a significant relationship between the stock market price index with interest rate for the same country (r = .644, p < 0.01). Moreover, there is also a relationship between the stock market price index with inflation rate (r = .545, p < 0.01). However, the results show a positive relationship between all these variables with the same hypothesis what the study's assumption above and with the previous studies.The results of the relationship between the independent variables and control variables with the dependent variables for UAE are shown in table 11. The result in table 11 indicates that there is a significant relationship between the stock market price index with exchange rate for UEA (r = 0.474, p < 0.05). Otherwise, the results show that the relationship between Stock market price index and the interest rate was positive but statistically not significant (r = .051, p = .812). As well as the same thing happened to the relationship between stock market index and inflation rate was positive but statistically not significant (r = .253, p = .232). From the table above the predictive power of the independent variables (exchange rate) and the control variables (interest rate and inflation rate) toward the dependent variable (referring to stock market price index). Therefore, in this study the adjusted R² for KSA was .494 that means there are other factors influences on stock market price index country.From the table above show that the adjusted R² for UAE was .339 that means there are other factors influences on stock market price index in this country.
|
|
|
|
|

|
3.3.3. Analysis for Long Term (Quarterly Data)
- In this, section the study, will analysis the quarterly data for these two countries KSA and UAE to the same years 2008 and 2009 to show whether the results will be the same or different.
3.3.3.1. Descriptive Analysis
- The table above provides the descriptive statistics for stock market index and the other three variables for KSA for eight quarters of year 2008 and 2009. The results indicate that for the meanness of the stock market index was 6749 with minimum and maximum value about 4414 and9652, respectively as well as desperation measured by the standard deviation was 2009.9. Whereas the mean of the exchange rate of KSA was 3.748 with regard to minimum and maximum, it was 3.73 and 3.77, respectively and the desperation measured by the standard deviation was .01281. In addition, the mean of interest rate for KSA was 4.3438 with minimum and maximum value about 2.75 and 5.50, respectively, while desperation measured by the standard deviation was 1.07685. As well as, the mean of inflation rate for KSA was 7.4188 with minimum and maximum value about 4.25 and 10.63, respectively; also, desperation measured by the standard deviation was 2.73543.The table above provides the descriptive statistics for stock market index and the other three variables for UAE. The results indicate that for the meanness of the stock market index was 4113.6 with minimum and maximum value about 2674 and 6596, respectively, So the desperation measured by the standard deviation was1649. Whereas the mean of the exchange rate of UAE was 3.6720 with regard to minimum and maximum, it was 3.67and 3.67, respectively and the desperation measured by the standard deviation was .00058. Furthermore, the mean of interest rate in UAE was 2.5375 with minimum and maximum value about 1.56 and 4.32, respectively, as well as desperation measured by the standard deviation was .91440. In addition, the mean of inflation rate for UAE was 8.5113 with minimum and maximum value about 1.56 and 11.86, respectively; also, desperation measured by the standard deviation was 3.42231.
3.3.3.2. Correlation Analysis
|
| |||||||||||||||||||||||||||||||||||||||||||||||||||||||||||||||||||||||||
|
|
|
3.3.3.3. Regression Analysis
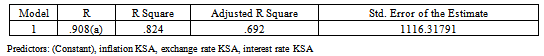
- From the table above the result shows that the adjusted R² for UAE was .692. That means there are other factors will influence on stock prices index in this country.The table shows that the adjusted R² for UAE was .361 that means there are other factors may affect.
4. Conclusions
- The main aim of this paper is to investigate whether stock prices and exchange rates are related to each other or not. By reviewing the literature relating to the implications of stock prices, whiles at the same time considered a lot of factors, have an impact on everyday stock prices such as enterprise performance, dividends, stock prices of other countries, gross domestic product, exchange rates, interest rates, current account, money supply, employment, etc. In order to provide a better understanding of the association between exchange rates and stock market price index.Based on that and after reviewing the findings of the study, it has been found that there is a significant positive relationship between stock market price index and exchange rate for UEA in the short run. This means that the stock is respond to the exchange rate as a bad signal for the economy; the result also showed that the variation of the dependent variable was explained by the independent variable by 19% and the variance of the dependent variable was explained by the independent variables and control variable by 34%. This means that the results are acceptable.Therefore, in the long run for UAE the study found there is a significant relationship between the stock market price index with exchange rate but in negative direction and the other variables there is no relationship between stock market price and these two variables (interest rate and inflation). With regard to KSA, the results showed that the relationship was positive between stock market price index and exchange rate but without statistically significant in the short run. Moreover, there is no relationship between stock market index and the other control variables that used. While a significant relationship with inflation rate in long run. Hence the result of study is in line with the previous studies. To sum up, the government of KSA and UEA should consider the exchange rate movement due to the positive relationship between the exchange rate and the stock market price index. In addition, for further studies, other economic factors should be considered such performance, dividends and gross domestic product (GDP) and other gulf countries should be included.
References
| [1] | Adjasi, C. Harvey, S & Agyapong, D. (2008). Effect of Exchange Volatility on the Ghana Stock Exchange. African Journal of Accounting, Economics, Finance and Banking Research. 3(3). |
| [2] | Aggarwal, R. (1981). Exchange rates and stock prices: A study of the US capital markets under floating exchange rates. Akron Business and Economic Review, 12, 7-12 |
| [3] | Ahmad, M. Rehman, R & Raoof, A. (2010). Do Interest Rate, Exchange Rate effect Stock Returns? A Pakistani Perspective. International Research Journal of Finance and Economics. 50, 1450-2887. |
| [4] | Ajayi, A. & Mougoue, M. (1996). On the Dynamic Relation between Stock Prices and Exchange Rates. Journal of Financial Research, 19, 193-207. |
| [5] | Ali, I. Rehman, K. Yilmaz, A. Khan, M & Afzal, H. (2010). Causal relationship between macro-economic indicators and stock exchange prices in Pakistan. Journal of Business Management .4 (3), 312-319. |
| [6] | Amare, T. & M. Mohsin. (2000). Stock Prices and Exchange Rates in the Leading Asian Economies: Short Versus Long Run Dynamics. Singapore Economic Review. 45(2), 165–181. |
| [7] | Bartov, E. & G. M. Bodnar. (1994). Firm Valuation, Earnings Expectations, and the Exchange-Rate Exposure Effect. Journal of Finance, 49, 1755-1785. |
| [8] | Beirene, J. Caporale, G & Spagnolo (2009). Market, Interest Rate and Exchange Rate Risk Effects on Financial Stock Returns. Quantitative and Qualitative Analysis in Social Sciences.3(2), 44-68. |
| [9] | Branson, W. H., & P. Masson. (1977). Exchange Rate in the short run: the Dollar Deutsche mark rate. European Economic Review, 10, 303-324. |
| [10] | Charles, V. E., Polis, C. B., Sridhara, S. K., & Blum, R. W. (2008). Abortion and long-term mental health outcomes: a systematic review of the evidence. Contraception, 78(6), 436-450. |
| [11] | Cheung, Y., & K.S. Lai. (1993). Finite sample sizes of Johansen's likelihood ratio tests for cointegration. Oxford Bulletin of Economics and Statistics, 55 (3), 313-328. |
| [12] | Chung, N. & Cheng, L. (2001). Dynamic relationship between stock prices and exchange rates for G-7 countries. The Quarterly Review of Economics and Finance 41, 477–490. |
| [13] | Chyi Doong, S & Hao Lee, C. (2009). Dynamic Correlation between Stock Prices and Exchange Rates. |
| [14] | Dimitrios, T. (2003). Macroeconomic factors and stock prices in the emerging Cypriot equity market. Managerial Finance, 29(4), 87-92. |
| [15] | Doong, C. Yung, Y. & Wang, T. (2005). The Dynamic Relationship and Pricing of Stocks and Exchange Rates: Empirical Evidence from Asian Emerging Markets. Journal of American Academy of Business, 7(1), 118-123. |
| [16] | Erbaykal, E. & Okuyan, H.A. (2007). Hisse Senedi Fiyatları ile Döviz Kuru ilişkisi: Gelişmekte Olan Ülkeler Üzerine Ampirik Bir Uygulama. BDDK Bankacılık ve Finansal Piyasalar Dergisi 1(1), 77-89. |
| [17] | Franck, P., & Young, A. (1972). Stock price reaction of multinational firms to exchange realignments. Financial Management, 1, 66-73. |
| [18] | Ghartey, E.E. (1988). Monetary Dynamics in Ghana: evidence from cointegration, error correction modeling, and exogeneity. Journal of Development Economics, 60, 203-233. |
| [19] | Granger, C.W.J, Huang, B. & Yang, C.W. (1998). A Bivariate Causality Between Stock Prices and Exchange Rates: Evidence from the Recent Asian Flue. Unpublished. |
| [20] | Hsiao, C. (1979), “Autoregressive Modeling and Money- Income and Income Data”, Journal of American Statistical Association, 74, 553 – 560. |
| [21] | Ibrahim, H & Aziz, H. (2003). Macroeconomic variables and the Malaysian equity market: view through rolling subsamples. Journal of Economic Studies, 30(1), 6-27. |
| [22] | Kim, K. (2003). Dollar Exchange Rate and Stock Price: Evidence from Multivariate Cointegration and Error Correction Model. Review of Financial Economics, 12, 301-313. |
| [23] | Kurihara, Yutaka. (2006). The Relationship between Exchange Rate and Stock Prices during the Quantitative Easing Policy in Japan. International Journal of Business, 11(4), 375-386. |
| [24] | Kutty, C. (2010). The Relationship Between Exchange Rates And Stock Prices: The Case Of Mexico. North American Journal of Finance and Banking Research, 4(4). 1-12. |
| [25] | Kunst, Robert M. & Franses, Philip Hans, 2010. "Asymmetric Time Aggregation and its Potential Benefits for Forecasting Annual Data," Economics Series 252, Institute for Advanced Studies |
| [26] | Lee, Y. M., & Wang, K. M. (2012). Capital Mobility and Current Account Imbalance: Nonlinear Threshold Vector Autoregression Approach. International Interactions, 38(2), 182-217. |
| [27] | Li Lian Ong, Kenneth W. Clements, H.Y. Izan. (1999). The world real interest rate: stochastic index number perspectives. Journal of International Money and Finance. 18, 225-249. |
| [28] | Lutfur Rahman, Md & Uddin, J. (2008). Relationship between Stock Prices and Exchange Rates: Evidence from Bangladesh. International Journal of Business and Management, 3(9). |
| [29] | Meese, R.A. & K. Rogoff. (1983). Empirical exchange rate models of the seventies: are any fit to survive? Journal of International Economics, 14, 3-24. |
| [30] | Muhammad, N. and A. Rasheed (2003) “Stock Prices and Exchange Rates: Are They Related? Evidence from South Asian Countries” Paper presented at the 18th Annual General Meeting and Conference, Pakistan Society of Development Economists. Jan 13-15, 2003, Islamabad. |
| [31] | Mustafa, S. & Mehmet, N. (2007). Turkiye'de IMKB ve Doviz Kuru Arasındaki Dinamik İlişkinin Belirlenmesi. Turkiye Ekonometri ve Istatistik Kongresi, InonuUniversitesi, Malatya. |
| [32] | Naeem, M. & Abdul, R. (2002). Stock Prices and Exchange Rates: Are They Related? Evidence from South Asian Countries. The Pakistan Development Review, 41(4), 535- 550. |
| [33] | Nieh, C. and C. Lee (2001) “Dynamic Relationship between Stock Prices and Exchange Rates for G-7 Countries” Quarterly Review of Economics and Finance 41, 477-490. |
| [34] | Ozair, A. (2006). Causality Between Stock prices and Exchange Rates: A Case of The United States. Florida Atlantic University, Master of Science Thesis. |
| [35] | Pan, G., Tian, S., Nie, J., Yang, C., Ruotti, V., Wei, H., Jonsdottir, G. A., Stewart, R., and Thomson, J. A. (2007). Whole-genome analysis of histone H3 lysine 4 and lysine 27 methylation in human embryonic stem cell. Cell Stem Cell 1, 299-312. |
| [36] | Rittenberg, Libby (1993), “Exchange Rate Policy and Price Level Changes:Causality Tests for Turkey in the Post Liberalization Period”, The Journal of Development Studies, 29/2, 245-259 |
| [37] | Sevuktekin, M. and Nargelecekenler, M. (2007), “Turkiye'de IMKB ve Doviz Kuru Arasındaki Dinamik Đlişkinin Belirlenmesi”, 8. Turkiye Ekonometri ve Istatistik Kongresi, Inonu Universitesi, Malatya. |
| [38] | Shiun, P. Wing, F & Angela, L. (2007). Dynamic linkages between exchange rates and stock prices: Evidence from East Asian markets. International Review of Economics and Finance 16, 503-520. |
| [39] | Solnik, B. (1987). Using financial prices to test exchange rate models: a note. Journal of Finance, 42, 141-149. |
| [40] | Tsoukalas, Dimitrios, 2003. “Macroecomoic Factors And Stock Prices In The Emerging Cypriot Equity Market”, Managerial Finance 29 (4), pp. 87-92. |
| [41] | Vygodina, V. (2006). Effects of size and international exposure of the US firms on the relationship between stock prices and exchange rates. Global Finance Journal, 17, 214–223. |
| [42] | Wolff, C.C.P. (1988). Exchange rates, innovations and forecasting. Journal of International Money and Finance. 7, 49-61. |
| [43] | Yutaka, K. (2006). The Relationship between Exchange Rate and Stock Prices during the Quantitative Easing Policy in Japan. International Journal of Business, 11(4), 375-386. |