-
Paper Information
- Next Paper
- Previous Paper
- Paper Submission
-
Journal Information
- About This Journal
- Editorial Board
- Current Issue
- Archive
- Author Guidelines
- Contact Us
International Journal of Finance and Accounting
p-ISSN: 2168-4812 e-ISSN: 2168-4820
2012; 1(6): 162-172
doi: 10.5923/j.ijfa.20120106.04
Remittances and Income Inequality in Rural Nigeria
 Abstract
 Reference
 Full-Text PDF
 Full-Text HTML
Olatomide W. Olowa 1, Adebayo M. Shittu 2
1Department of Agricultural Education,Federal College of Education (Tech.) Akoka, Lagos, Nigeria
2Department of Agricultural Economics and Farm Management, Federal University of Agriculture, Abeokuta, Nigeria
Correspondence to: Olatomide W. Olowa , Department of Agricultural Education,Federal College of Education (Tech.) Akoka, Lagos, Nigeria.
| Email: |  |
Copyright © 2012 Scientific & Academic Publishing. All Rights Reserved.
Remittances- both foreign and domestic- flow to and within Nigeria are huge and no visible effort has been made to study its effects on inequality in rural Nigeria. This study decomposed income inequality in rural Nigeria using the Gini-decomposition and regression-based approaches to investigate the contribution of remittance to income inequality in Rural Nigeria. The results show domestic remittances seem more likely to be income equalizing than foreign remittances. Education is associated with lower domestic remittances and higher international remittances, probably reflecting the role of education in promoting international versus domestic migration. An increase in schooling increases inequality through domestic remittances and decreases inequality through international remittances, while a reduction in household size reduces inequality through both domestic and international remittances. This analysis highlights the importance of the distinction between domestic and international remittances as drivers of inequality as well as the importance of identifying and quantifying the determinants of remittances and their subsequent impact on inequality.
Keywords: Remittances, Income, Inequality, Rural Nigeria, Economy
Cite this paper: Olatomide W. Olowa , Adebayo M. Shittu , "Remittances and Income Inequality in Rural Nigeria", International Journal of Finance and Accounting , Vol. 1 No. 6, 2012, pp. 162-172. doi: 10.5923/j.ijfa.20120106.04.
Article Outline
1. Introduction
- The impact of rural out-migration on the distribution of household income by size in rural Nigeria is central to the relationship between economic growth and equity in Nigeria. As long as large proportion of population resides in rural areas, rural income inequalities must constitute an important source of overall income inequality. This is because high levels of income inequality produce an unfavourable environment for economic growth and development. In many developing countries, studies have shown that income inequality had risen over the last two decades[1, 2]. Despite commitments shown by many developing countries towards reducing income inequality and poverty, there is lack of sufficient knowledge on how to design a holistic approach for addressing the issues[3].Because of the linkage between income inequality and poverty, reducing income inequality has become a major public policychallenge among development agencies and poverty-reduction experts. Yet, in most developing countries, discussions about poverty reduction strategies often focus almost exclusively on income growth, neglecting the potential roles of income redistribution and inequality[4]. Most of the discussions often fail to recognise that to achieve reduction in poverty, income growth has to be equitablydistributed.A logical consequence of rural out-migration of workers is a reverse flow of remittances to support dependent relatives, repayment of loans, investment and other purposes. While it is usually asserted that migrant remittances have contributed in no small measure to the economic and social development of the Nigeria, much of the discussion is largely anecdotal. The accuracy of the estimates of migrant remittances is rather doubtful and very little empirical work has been done on the evaluation of contribution of remittances to Income inequality. Data on remittances are collected largely to estimate balance of payments flows and no attempt is usually made to relate such flows to income generation at the local level. In other climes, remittances from migrants have contributed significantly to income in sending communities. Some evidences in literature have shown that an increase in international remittances reduces poverty in developing countries[5]. However, other studies have found both positive and negative effects of remittances on poverty and inequality in various countries[6, 7]. Theoretically, remittances are likely to increase inequality at initial stages of the migration process and decrease inequality at later stages[8, 9]. This prediction is supported by some empirical findings in literature[10, 11, 12], one of which also differentiated between domestic and international remittances, and showed that they had different effects on inequality and poverty in rural Mexico[10].To delve deeper into the issue of differential effects of domestic and international remittances, suffice it to say that the relative importance of domestic and international remittances is not homogeneous across population sub-groups. In particular, domestic remittances are more important as a source of income for poor households, while international remittances are more important for richer households[10].This paper uses inequality decomposition techniques in order to obtain marginal effects of domestic and international remittances on inequality, a method that has been applied to other countries before[10, 12]. Decomposition of income inequality is desirable for both arithmetic and analytic reasons[13]. Policy makers may wish to understand the link between socio-economic characteristics and their contribution to total income inequality through remittances. This sheds light on the contribution of determinants of remittances on income inequality in the economy. Estimating the contribution of each income source to total inequality is very helpful. This information helps to understand the effect that changes in household labour force participation can make on income distribution[14]. This paper intends to achieve two objectives. First, estimates the contributions of Domestic and International remittances to overall income inequality. Second, seeks to determine the contributions of some households’ socio-economic characteristics to income inequality through remittances. Remittances in this paper are taken as exogenous transfer in a similar version to other previous studies[10, 12]. This therefore precludes controversies about endogeneity and selection problems surrounding the second approach which take remittances as substitute for home production.
2. Analytical Framework
2.1. Income Source Gini Decomposition
- To explore the impacts of remittances on rural income inequality, it is first necessary to select an inequality index. Various indices exist. Following[10], an inequality index should have 5 basic properties: (1) adherence to the Pigou-Dalton transfer principle; (2) symmetry; (3) independence of scale; (4) homogeneity with respect to population; and (5) decomposability. The Piguo-Dalton principle maintains that inequality, as measured by the index, should increase when income is transferred from a low-income household to a high income household. An index displays symmetry if the measured level of inequality does not change when individuals trade positions in the income distribution—that is, the identity of individuals or households is irrelevant. Independence of income scale means that a proportional change in all incomes does not alter inequality. Homogeneity means that a change in the size of the population will not affect measured inequality. Finally, in order to explore influences of specific income sources on inequality, the index needs to be decomposable with respect to income sources. The inequality measures that satisfy these 5 requirements include the coefficient of variation, Theil’s entropy index (T), Theil’s second measure of inequality (L), and the Gini coefficient (G). The two Theil measures can be disaggregated by population subgroup but not by income source[10]. The Gini coefficient is probably the most intuitive measure of inequality, with its neat correspondence to the Lorenz curve and easy-to interpret decompositions of remittance effects. This is the measure that was used in the present study. Following[10, 15], the Gini coefficient for total income inequality, G, can be represented as:
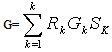 | (1) |
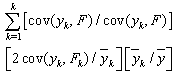 where Sk represents the share of component k in total income, Gk is the source Gini, corresponding to the distribution of income from source k, andR k is the Gini correlation of income from source k with the distribution of total income. Equation (1) permits us to decompose the influence of any income component, in our case remittances, upon total income inequality, as the product of three easily interpreted terms:a) how important the income source is with respect to total income (Sk)b) how equally or unequally distributed the income source is (Gk)c) whether or not the income source is correlated with total income (Rk).For example, if remittances represent a large share of total income, they may potentially have a large impact on inequality. (If their share in total income is nil, so must be their contribution to inequality.) However, if they are perfectly equally distributed (Gk = 0), they cannot influence inequality even if their magnitude is large. If remittances are large and unequally distributed (Sk and Gk are large), they may either increase or decrease inequality, depending upon which households, at which points in the income distribution, receive them. If remittances are unequally distributed and flow disproportionately towards households at the top of the income distribution (Rk is positive and large), their contribution to inequality will be positive. However, if they are unequally distributed but target poor households, remittances may have an equalizing effect on the rural income distribution, and the Gini index may be lower with than without remittances. Using the Gini decomposition, we can estimate the effect of small changes in remittances on inequality, holding income from all other sources constant[12].The relative concentration coefficient of income source k in total income inequality is expressed as:
  | (2) |
 . Then
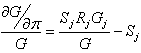 | (3) |
2.2. Economic and Demographic Determinants of Remittance Receipt
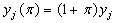
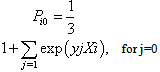
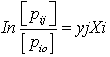
- To examine the factors that affect migration and the receipt of remittances, multinomial logit regression model was used. The probability of a household having a migrant and receiving remittance is characterized as a polychotomous choice between three mutually exclusive alternatives. Let Uij denote the utility that the household derive by choosing one of the three outcomes and
 Where γj varies and Xij remains constant across alternatives; and eij is a random error term reflecting intrinsically random choice behaviour, measurement or specification error and unobserved attributes of the alternative outcomes. Let also Pij (j = 0, 1, 2) denote the probability associated with the three categories, with j = 0 is the probability of no remittance, j = 1 is the probability of receiving remittances from domestic sources, and j = 2 is the probability of receiving remittances from foreign sourcesThe multinomial logit model is given by
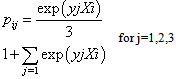 | (4) |
 | (5) |
 | (6) |
2.2.1. Dependent Variable
- Y1 = probability receiving remittances from domestic sources,Y2 = probability receiving remittances from foreign sources,Y3 = probability of no remittanceIn this analysis, the third category (None), is the “reference state”
2.2.2. Independent Variables
- The independent variables which are the economic and demographic variables that influence the decision to migrate and receive remittances[23, 24 25, 26], include:Xi = Human Capital variables,Xj, = Household Characteristics variables, andXk = Migration network and wealth
2.2.3. Human Capital
- X1 = Number of members over age 15 with primary school education X2 = Number of members over age 15 with secondary school education X3 = Number of members over age 15 with university education
2.2.4. Household Characteristics
- X4 = Age of household head X5 = Gender (male=1, 0 otherwise)X6 = Household sizeX7 = Number of males over age 15X8 = Number of females over age 15
2.2.5. Networks
- X9= Locational Variables (6 GPZ)South-south = 1South-east = 2South-west = 3North-central = 4North –east = 5North-west = 6
2.2.6. Wealth
- X10 = Land size (ha)The rationale for including these variables in the equation follows the standard literature on migration and remittances. According to the basic human capital model, human capital variables are likely to affect migration because more educated people enjoy greater employment and expected income-earning possibilities in destination areas[24]. In the literature, household characteristics – such as age of household head and number of male members and children– are also hypothesized to affect the probability of migration. In particular, some analysts[26, 27] have suggested that migration is a life-cycle event in which households with older heads, more males over age 15 and fewer children under age 5 are more likely to participate. Because of the significant initial costs in financing migration, the economic literature often suggests that households with more wealth are likely to produce migrants[28, 29]. The model therefore includes wealth variables with the expectation that middle-wealth house-holds will have the highest probability of producing migrants and receiving remittances. The most important aspect of the rural economic opportunity hypothesis states that land deprivation, particularly total landlessness or some small land holdings is a positive determinant of rural urban migration from rural areas either family’s migration or individual’s migration. Finally, since it is likely that location of residence in Nigeria will affect the probability of migration, six locational dummy variables-Zones (with capital city omitted) are included in the model.
2.3. The Determinants of Remittances and Their Inequality Implications
- The estimated regression coefficients can now be used in order to further decompose the part of income inequality that operates through remittances.The estimated regression coefficients from themultinomial regression model above were used to further decompose the part of income inequality that operates through remittances following[30] and[31]. They suggested regression-based inequality decomposition by income determinants. In particular, total household income is specified as a linear regression:
 | (7) |
 | (8) |
 | (9) |
 | (10) |
 | (11) |
 | (12) |
3. Data
- The study used the Nigeria Living Standards Survey (NLSS) .The sample design was a 2-stage stratified sampling. The first stage involved the random selection of 120 housing units called Enumeration areas (EAs) from each state and the Federal capital Territory. At the second stage, a total selection of 5 housing units from each of the selected EAs was chosen. Thus, summing up to 22200 households across the country[33]. For the purpose of this study, the secondary data was stratified into rural and urban sectors. The second stage is the selection of the sampled rural households. The dataset provides detailed records on household expenditure, household income profile, demography, education, health, employment and time use, housing, social capital and community participation, agriculture, non-farm enterprise, credit, assets and saving, remittances and household income schedule and household characteristics.The files containing the remittance variables were merged with the files containing the household roster variables and other socioeconomic variables used for the analysis. All the 14,512 rural households included in the NLSS were used for this study. Data extracted for the study included socio-economic characteristics, expenditure, household income, Domestic Remittances (DRs) and Foreign Remittances (FRs). The population weight was used as the weighing variable while the household size was used as the size variable.
4. Results and Discussion
4.1. Socioeconomic Analysis of Rural Households
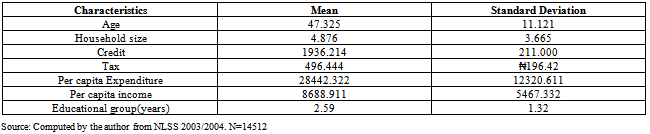
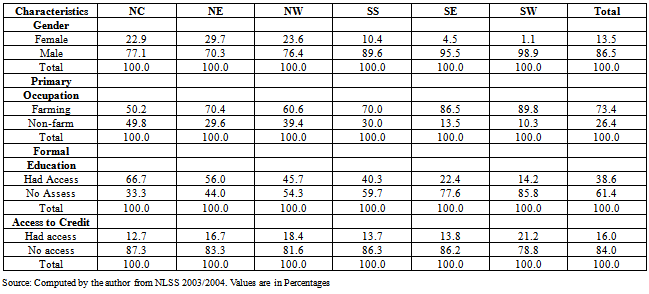
- Table 1a presents the summary of continuous socioeconomic household characteristics. On the average, the age of the rural household heads is estimated at 47 years with the standard deviation of 11.13 years. This shows that the average rural household head is in his middle years indicating high economic productivity. The average household size was approximately five. Thus, a typical rural household is not large, indicating a low supply of labour to the family enterprise especially agriculture. This might be as a result of increase in rural-urban migration. The result further show that the mean transfer to government was ₦496.42 with ₦196.42 being the standard deviation of the distribution. Furthermore, the average amount of credit available to rural households was ₦1938.10. This is rather low and a higher proportion of them could not even access this. Average level of education in rural Nigeria is primary education as shown in table 1a.Table1b shows the distribution of rural household characteristics in percentages across Geo-political Zones (GPZs). A larger percentage of the rural households were male-headed with the highest and lowest proportions in the northwest and the southeast zones representing 98.9 per cent and 70.3 per cent respectively. In all, 86.5 per cent of the rural households were male-headed. This is indicates that men are the major breadwinner in the households.About 73.4 per cent of households in rural Nigeria were engaged in farming activities as the major sources of income for the rural household heads. The incidence of farming activities being the major sources of income of the household head is greater than the overall average in the northeast and the Northwestern zones representing 86.9 percent and 89.8 percent respectively. However, in the southsouth zone, the main source of rural income is shifting from farming to non-farm activities. About three-fifth (61.4%) of the rural household heads had no access to formal education at one level or the other. This implies that majority of the rural household heads might be constrained to farming as the major source of income with attendant low income and high level of income inequality and incidence of poverty.
|
|
|
|
4.2. Household Income and Remittances
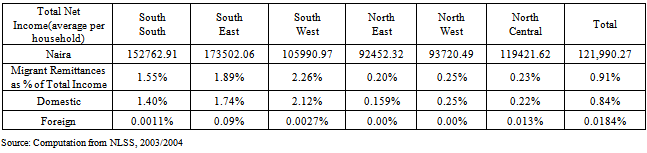
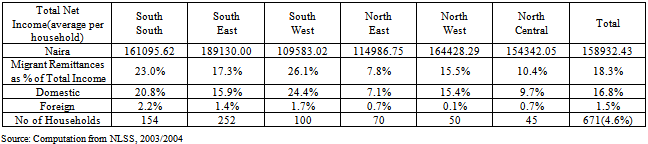
- Table 2a and b summarizes rural households’ total per capita income and remittances from domestic and international migrants, nationally and by region, Average household total income for the rural sample in 2004 was 121,990.20 naira. The composition of income reported in the table reveals a significant role for migrant remittances in rural Nigeria. Migrant remittances are not equally distributed across regions (Table 2). The percentage of household income from international migrant remittances ranged from 0% in Northern regions to 9% in the south-east. The percentage from domestic migrant ranged from 0.1% to 2.1% when households total per capita income comprised of recipients and non-recipients. The proportion of remittances becomes robust when only recipients income was considered. Thus, the percentage of household income from international migrant remittances now ranged from 0.1% in Northern regions to 2.2 per cent in the south-east while the percentage from domestic migrant ranged from 7.1 per cent in the north-east to 24.4 per cent in the south-west. The numbers in tables 2a and b reveal that migrant remittances potentially have significant impact on rural income inequality and poverty, but these impacts are not likely to be uniform across regions with vastly different prevalence and histories of migration.
4.3. Determinants of Remittances
- Table 3 shows the regression coefficients and standard error from estimating the multinomial logit on the probability of household producing migrant and receiving remittances. The log-likelihood value for the model is -2468.725. The likelihood ratio index p2 value is0.2621confirmed that all explanatory variables are collectively significant in explaining the probability of a household producing migrant and receiving remittance. In literature,[20] obtained p2 value of 0.3145 while[16] reported p2 value of 0.25 as representing a relatively good- fit for a multinomial logit model. Hence, the p2 value of 0.2621 in this study is indicative of good-fit for the estimated model. Evidence from the model as contained in table 3, shows that the set of significant explanatory variables varies across the groups in terms of the levels of significance and signs. Several of the outcomes are unexpected. For both sets of households (those receiving domestic and foreign remittances), most of the human capital variables are statistically insignificant. However, For domestic remittances, age of household head, zones 2, 3 and6 and gender are positive and significantly associated with receiving domestic remittances. Likewise, for foreign remittances, households with more educated members at the university level, age of household head, Land size and zone4 are positive and significantly associated with receiving foreign remittances. These suggest that for foreign remittances, households with more educated members at the university level have a higher propensity to receive remittances. Age of household head is significant with positive sign in all category suggest that the older the head the higher the propensity to receive remittances from all sources. Land size is significant with positive sign in foreign remittances category. Since Land and Land size represent wealth, this confirms the fact that migration (especially abroad) is an expensive venture and it only household that is well-to-do that can afford it[27]. As expected all the zones 2, 3 and 6 are significant with positive signs. Since domestic migration does not attract high cost relative to international migration, households in these zones are more likely to migrate domestically and receive remittances
|
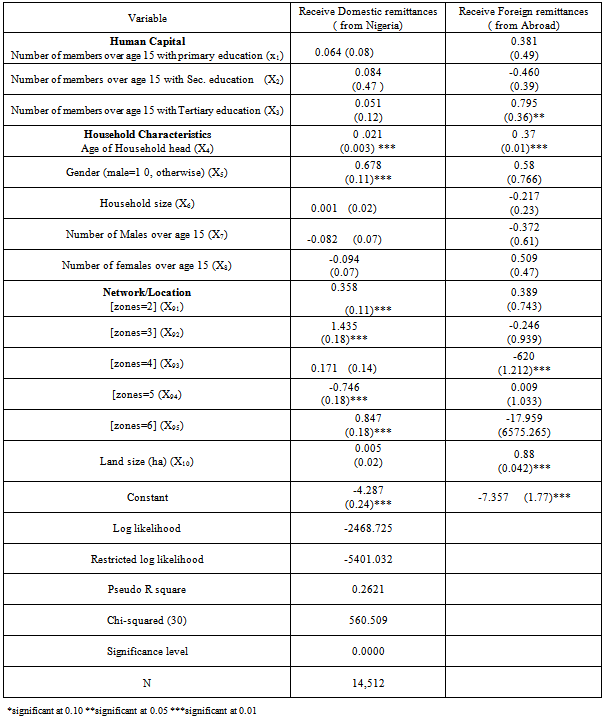
- The positive sign implies that the probability of the households having migrant and receive either domestic or foreign remittances relative to the reference group increases as these explanatory variables increase. The negative and significant parameter means that the probability of being classified in the two groups is lower relative to the probability of being placed in the reference group.
4.4. Income-Source Inequality Decompositions
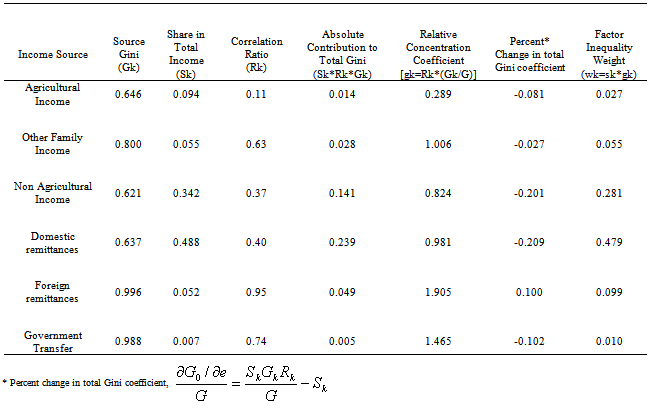
- The analyses of the contributions of income sources to income inequality were done on the basis of GPZ in order to show the effects of remittance income on income inequality in different zones with varied prevalence of remittances (migration). There are two ways in which the results can be interpreted. First, an Income source (such as remittances) either increases or decreases income inequality, depending on whether the relative concentration coefficient is greater or less than unity. When the computed value is greater (less) than one, the income source is inequality increasing (decreasing)[23]. Second, It should be noted that relative concentration coefficient is the factor inequality weight (otherwise known as relative contribution to inequality) (wsgs) divided by the share of income source in total income (ws).Therefore, by comparing these two parameters, the effect that the income source will have on income inequality can be inferred. This because an income source will have a relative concentration coefficient less (greater) than one if the share in total income is greater (less) than the factor inequality weight. In this study, the second approach was used.Table 4 summarizes the contributions of income sources to per capita total income and income inequality in rural Nigeria. Column 1 presents the source Gini. Migrant remittances are unequally distributed across rural households. The source Ginis for foreign and domestic remittances are very high: 0.99 and 0.64, respectively. As indicated earlier, a high source Gini (Gk) does not imply that an income source has an unequalizing effect on total-income inequality. An income source may be unequally distributed yet favour the poor. This is the case for domestic migrant remittances. The Gini correlation between domestic remittances and the distribution of total per-capita income (Rk) is only 0.40, comparable to that of agricultural wages Because of the low Gini correlation between domestic-migrant remittances and total-income rankings, the percentage contribution of domestic remittances to inequality (2.4 percent) is smaller than the percentage contribution to income (4.8 percent).Thus, domestic remittances have a slight equalizing effect on the distribution of total rural income. A 1.0% increase in domestic remittances, other things being equal, reduces the Gini coefficient of total income by 2.0 percent. On income-source shares (column 2), Migrant remittances represented 49 percent of average per-capita rural income in 2004. The vast majority of this remittance income (99 percent) came from domestic migrants. Wages were the next largest income source, accounting for more than 35 percent. Of this, most (95 percent) was from non-agricultural employment. Income from other Family activities accounted for just fewer than 5.0 percent of rural per-capita income, and government transfers represented 1.0 percentThe Gini correlation between international migrant remittances and total income rankings is much higher (R=0.95). Because of this, foreign remittances have an unequalizing effect on rural incomes; a 1.0-percent increase in remittances from migrants abroad increases the Gini coefficient by 0.1 percent. Government transfers are unequally distributed (Gk = 0.98). Hence, the Gini Correlation between transfers and total income is high (Rk = 0.74), indicating that apart from remittances, transfers favour the rich more than any other income source. Other things being equal, a 1.0-percent increase in government transfers is associated with a 0.02-percent decrease in the Gini coefficient of total income. Agricultural wages are the largest income equalizers in rural Nigeria, while income from other family activities has the largest positive effect on inequality.
|
|
4.5. The Determinants of Remittances and Their Inequality Implications
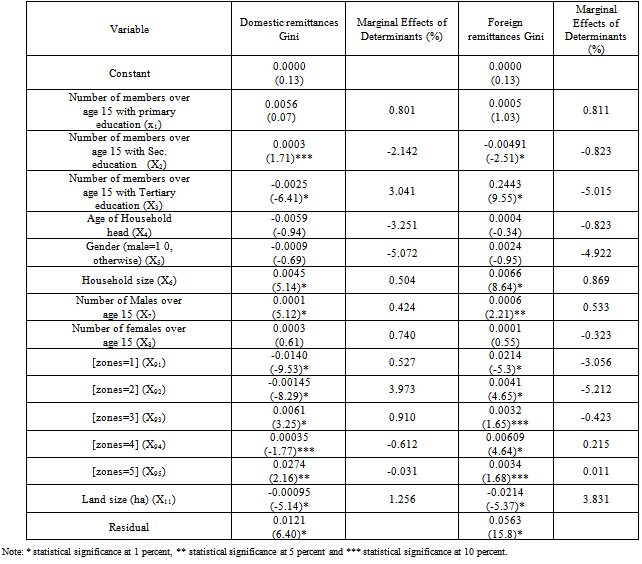
- The results of decomposition by remittance determinants are reported in table 5.Recall that the contributions of domestic and international remittances to total income inequality were negative and positive respectively in rural Nigeria (Table 4).Breaking down the contributions of remittances to inequality into shares attributed to these inequality determinants (population sub-group), Table 5 shows that these contributions are mostly driven by the distributions of schooling, household size, and male member of household over age 15 years, landholdings and geographical location. The parameter of household members having secondary education contributed positively to inequality (0.0003) through domestic and negatively through foreign remittances (-0.0049). Conversely, The parameter of household members having Tertiary education contributed positively to inequality (0.2443) through foreign and negatively through domestic remittances (-0.0025). The distribution of household size on the other hand, contributes positively to inequality through both domestic (0.0045) and foreign remittances (0.0066), while the distribution of landholdings (land size) contributes negatively to inequality through both domestic and international remittances. The implication of this is that an increase in schooling increases inequality through foreign remittances and decreases inequality through domestic remittances, while a reduction in household size is likely to reduce inequality through both domestic and foreign remittances. Land size increase will reduce inequality through both domestic and foreign remittances.Another way to look at the impact of explanatory variables on inequality is through marginal effects. Simulations were used to compute marginal effects in the following way following[34]. First, explanatory variable was changed to the effect that Household size was increased by one person for the whole sample, landholdings per capita (land size) were increased by 1%, and each of the categorical variables (for example, Gender) was changed to 1 for the whole sample. Also, in the case of the categorical variables, the simulation obviously reduces the variance of the variable to zero, and hence the results are not independent of the inequality contributions reported in table 5.As shown in table 5, marginal effects of gender and age of households head, and members over age 15 with secondary education were negative for both domestic and foreign remittances. On the other hand, marginal effects of household size and land size are positive for both domestic and foreign remittances. The marginal effect of higher education is positive in the case of domestic remittances and negative in the case of foreign remittances, and the same is true for the marginal effects of the geopolitical zones (GPZs) in the southern region (Southeast =zone1, southsouth=zone2 and southwest=zone3). The marginal effects of households in geopolitical zones in the northern region are negative in the case of domestic remittances and positive in the case of foreign remittances.These results can further be interpreted as follows: Increasing schooling of households who are already more educated than the average (tertiary) is expected to decrease domestic remittances and increase foreign remittances, probably through substitution of international migration for domestic migration. This is expected to increase income of these households, but since the impacts of schooling through domestic and foreign remittances are opposite in signs, the overall impact on income inequality is ambiguous. It depends on the initial position of these households within the income distribution. Should the favoured household be on high income stratum, inequality results or worsens; the reverse is the case with low income category. Similarly, migration of entire households from any of geopolitical zones 1, 2 or 3 is expected to reduce foreign remittances and increase domestic remittances. the reason may not be unconnected with fact that these zones seems to be better developed than other GPZs in terms of industrial establishments, agricultural opportunities, education and social infrastructure and thus have similar labour market compared to the developed countries. Also, influence of remittances on these households and the resulting effect on income inequality is ambiguous. Conversely, Migration of entire households from any of GPZs 4 and 5 in the northern region (say to any of more developed GPZ in the southern region) is expected to reduce domestic remittances and increase foreign remittances. Increase in per capital land holdings (land size) reduces inequality through domestic and foreign remittances according to table 5 because it increases the fraction of land owned by households
5. Conclusions
- This paper used inequality decomposition techniques to analyze the differential roles of domestic and foreign remittances in determining household income inequality in the rural NigeriaFindings from this study using nationally and Geopolitical Zone representative data from rural Nigeria indicate that remittances increased rural income inequalities.Since remittances were found to be inequality increasing while reducing poverty, the strong implication is that poverty programs that seek to adjust for remittance shortfalls must examine carefully the situation for all groups but more especially the poor in rural areas. On the other hand, measures that promote remittances or that enhance remittance multipliers on incomes in migrant-sending households can be an effective poverty-reduction tool. The impacts of these measures on poverty and inequality would appear to be most favourable in the highest migration regions. Education is known to be an important determinant of migration[23], although its effect varies considerably across countries[7]. If education stimulates receiving remittances, as seems to be the case for the Rural Nigeria, then enhancing education among poorer households could have an equalizing effect on income through its effect on remittances.A family planning policy that reduces fertility and therefore household size especially among the larger households is expected to reduce household size inequality, and according to table 12 this would reduce inequality through its impact on remittances. This policy would also reduce average household size and this would also reduce inequality through its effect on remittances (table 5). Hence, the impact of this policy on inequality (through remittances) will be unambiguously negative That is, inequality reducing. Finally, consider a land reform that allocates farmland to some landless households. This increases the variance of landlessness to the extent that less than half of the households own land, and hence reduces inequality according to table 5 because it increases the fraction of households with land and the fraction of land owned by households. This policy could also change the distribution of landholdings per capita, and this would change the picture.