-
Paper Information
- Next Paper
- Previous Paper
- Paper Submission
-
Journal Information
- About This Journal
- Editorial Board
- Current Issue
- Archive
- Author Guidelines
- Contact Us
International Journal of Finance and Accounting
p-ISSN: 2168-4812 e-ISSN: 2168-4820
2012; 1(5): 82-93
doi: 10.5923/j.ijfa.20120105.02
Measurement and Disclosure of Intellectual Capital: Evidence from a Developing Country
 Abstract
 Reference
 Full-Text PDF
 Full-Text HTML
Madan Lal Bhasin
Department of Accounting & Finance, Bang College of Business, KIMEP University, Abai Avenue 2, Dostyk Building, Almaty, Republic of Kazakhstan
Correspondence to: Madan Lal Bhasin , Department of Accounting & Finance, Bang College of Business, KIMEP University, Abai Avenue 2, Dostyk Building, Almaty, Republic of Kazakhstan.
| Email: |  |
Copyright © 2012 Scientific & Academic Publishing. All Rights Reserved.
In today’s knowledge-based economy, measurement and disclosure of intellectual capital (IC) are very crucial for enhancing business performance and economic growth, both in manufacturing as well as in service organizations. This study attempts to provide an insight into the style of IC disclosures and measurements done by the Indian companies. First, a longitudinal study was carried out to analyse how three Indian firms--Reliance Industries Limited, Balrampur Chini Mills and Shree Cement Limited--disclosed their IC reports. Second, in order to survey the recent IC measurement scenario, we conducted another study of 8 Indian pharmaceutical companies in which the market value added (MVA) approach is applied for measuring IC on their 2004-05 to 2008-09 annual reports. Also, it seeks to measure the effectiveness of IC as compared to tangible assets (TA) for the selected companies. On an average, the selected pharmaceutical companies reported a positive value of IC; significant correlation has been noticed between TA and net operating profits. However, no significant difference was found between percentage of IC to MV and percentage of TA to MV. At present, disclosure of intellectual capital information by the companies is done by very few leading companies, purely on a “voluntary” basis. Unfortunately, the omission of IC information may adversely influence the quality of decisions made by shareholders, or lead to material misstatements. The results of longitudinal study confirmed that IC disclosure in these companies is almost negligible and its disclosure had not received any preference from the mentors of these corporations. IC reports may initially be used for ‘internal’ management purposes; but an ‘external’ stakeholder-focus of IC report should be the ultimate goal.
Keywords: Disclosure, Measurement, Intellectual Capital, Intangible Assets, Developing Country
Article Outline
1. Introduction
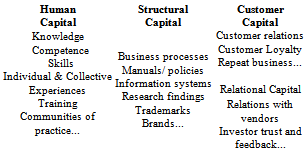
- Business dynamics of the 21st century are increasingly determined and driven by Intellectual Capital (IC) elements. The future drivers of any modern economy will no longer be capital, land or equipment, but the “people” and their “knowledge” reservoir. A knowledge-intensive company leverages their know-how, innovation and reputation to achieve success in the marketplace[1]. Market participants, practitioners and regulators alike argue that there is an important need for greater investigation and understanding of IC (or knowledge assets) disclosure as the usefulness of financial information in explaining firm profitability continues to deteriorate. Traditional disclosure mechanisms are not able to cope adequately with the disclosure requirements of new economy firms. He observed an increasing dissatisfaction with traditional financial disclosure and its ability to convey to investors the wealth-creation potential of firms[2].Various estimates indicate that “intangible” assets currently constitute 60-75% of corporate value, on an average. Further, Lev compared that relationship between market value and book value of shares. In 1970 it was 1:1 and in mid-1990 it had increased to an average of three times. This statistical information provided an insight into the growing importance of IC. Similarly, Leonard Nakamura estimated the corporate-sector investment in intangible assets in 2000 was about $1 trillion—comparable to that sector’s investment in property, plant and equipment. Half of this was related to the intangibles of research and development, and of software. The balance was other intangibles, such as brands, human resources, and organizational processes. Therefore, the corporate world is now devoting a lot of time and effort to manage its “intellectual” assets in order to improve its shareholder’s wealth. Despite growing interest and demand for IC information, prior research till date suggests a persistent and significant variation, both in the ‘quantity’ and ‘quality’ of information reported by firms on this pivotal resource. As existing economic and business metrics track a declining proportion of the real-economy, the deficiency and inconsistency in the disclosure of IC-related information is creating growing information “asymmetry” between ‘informed’ and ‘uninformed’ investors. This provides a fertile ground for informed investors to extract higher abnormal returns[3]. Thus, IC is increasingly being recognized as having much greater significance in creating and maintaining “competitive” advantage and shareholder “value”. This clearly calls for a refreshed understanding of business principles, information disclosure, and decision-making processes.The concept of IC measurement, management and disclosure is still relatively new. Accountants, business managers, and policy-makers have still to grapple with its concepts and detailed application. As expected, definition of IC varies substantially. According to Stewart[4]: “It has become standard to say that a company’s IC is the sum of its human capital (talent), structural capital (intellectual property, methodologies, software, documents, and other knowledge artifacts), and customer capital (client relationships).” One of the most comprehensive definitions of IC is offered by the Chartered Institute of Management Accountants[5] as: “The possession of knowledge and experience, professional knowledge and skill, good relationships, and technological capacities, which when applied will give organizations competitive advantage.”An expert opine, IC is a combination of human capital—the brains, skills, insights, and potential of those in an organization—and structural capital—things like the capital wrapped up in customers, processes, databases, brands, and IT systems. It is the ability to transform knowledge and intangible assets into wealth creating resources, by multiplying human capital with structural capital. For instance, Sveiby[6] first proposed a classification for IC into three broad areas of intangibles, viz., Human capital, Structural capital and Customer capital—a classification that was later modified and extended by replacing customer capital by relational capital. Some examples of IC are shown in Table-1. The diagram is only a guide to the components of IC as the elements combine and interact with each other and with traditional capital elements (physical things and monetary elements) in ways unique to individual companies to create value.The available literature has identified three sub-phenomena (or categories) that constitute the concept of IC: human, relational, and organizational capital. First, “human capital” represents the knowledge, experience and skills of the employees of the firm. It also reflects the commitment and motivation of the employees as a result of their continuance in the firm. Second, “relational capital” reflects the organizational value that emerges not only from a firm’s relations and connections with customers, but also with current and potential suppliers, shareholders, other agents, and the society in general. Finally, “structural capital” shows a firm’s supportive structures for knowledge creation and deployment, as well as, the set of knowledge, skills and abilities embedded in the organizational structure.
|
2. Why to Measure Intellectual Capital?
- Companies may want to measure IC for a variety of reasons. One study by Bernard[7] identified the following five main reasons. First, measuring IC can help an organization to formulate business strategy. By identifying and developing its IC, an organization may gain a competitive advantage. Second, measuring IC may lead to the development of key performance indicators that will help evaluate the execution of strategy. IC, even if measured properly, has little value unless it can be linked to the firm’s strategy. Third, IC may be measured to assist in evaluating mergers and acquisitions (M&A), particularly to determine the prices paid by the acquiring firms. Fourth, using non-financial measures of IC can be linked to an organization’s incentive and compensation plan. However, the first four reasons are all internal to the organization. A fifth reason is external: to communicate to external stakeholders’ what intellectual property the firm owns. Andriesen[8] proposes a much shorter list of the reasons companies may want to measure IC: to improve internal management, to improve external disclosure, and to satisfy statutory and transactional factors.Intangible resources need to be managed with more attention and differently than other resources, and measuring them helps to improve management of them. Effective management of intellectual property also helps to measure it. Good measures of IC will compliment financial measures, provide a feedback mechanism for actions, provide information to develop new strategies, assist in weighing different courses of action, and enhance the management of the business as a whole. Improving “external” disclosure of IC can: (1) close the gap between book value and market value, (2) provide improved information about the real value of the organization, (3) reduce information asymmetry, (4) increase the ability to raise capital by providing a valuation on intangibles, and (5) enhance an organization’s reputation. Good measures of IC, of course, will complement financial measures, provide a feedback mechanism for actions, provides information to develop new strategies, assist in weighting different courses of action, and enhance the management of the business as a whole.The inclusion of an IC in the corporate financialstatements would “result in a balance sheet that more realistically describes the value of the company, and displays all relevant assets from which the company expects to obtain benefits in the coming years.” Although this is an appealing idea, unfortunately, it is not per definition of value to the disclosing company. Three favourable factors regarding voluntary disclosure are: lower borrowing costs, higher value relevance, and decreased information asymmetry.It should be noted that the costs of disclosing IC-related information are certainly not to be ignored. The question is whether corporate managers value the benefits of disclosure properly. Companies incur significant costs in order voluntarily to disclose information and may regard such disclosure as a “service” to shareholders, investors and analysts. When assessing the costs of IC disclosures, one important factor is the cost of gathering and analysing IC-related data. These costs will be positively correlated to the required detail of this data. When taking the Skandia Navigator as a model, it becomes apparent that hiring specific IC staff is only one necessity. However, three factors opposing IC disclosure are: transparency drawback, regulatory barriers, and auditor conservatism.
3. The Accounting Conundrum about IC Measurement and Disclosure
- It is said that “what is measured in companies is also what is managed.” Income statement and balance sheet tools are “able to present an X-ray (or snapshot) of a firm’s performance and financial position.” Balance sheets provide indications of how the company appears within a specific period, but are not ‘reliable’ tools to perceive a company’s future performance. There is growing criticism that the ‘traditional’ balance sheet does not take account of those “intangible factors that largely determine a company’s value and its growth prospects.” Industrial-age companies needed balance sheets to show their value to investors. In the knowledge-economy, the balance sheet as tool is no longer sufficient to provide the assurance that a safe investment is being made. With the rise of the “knowledge-economy” over the past 20 years, however, IC is becoming more important and should be disclosed. Unfortunately, IC does not appear officially in the traditional financial report. Accountants are not yet ready to make significant changes to a 500-year-old system. It is therefore not strange that it is generally seen as an enormous step forward that efforts to capture IC more appropriately are being made from the accounting domain. The movement away from the ‘black-and-white’ balance sheet information is known as the ‘colorizing’ of balance sheets, which in today’s world of colourful multimedia appears to be a very apt description. However, alternative methods of measuring and evaluating IC have been slow to develop. This is because investors, through ignorance or short-sightedness, have continued to value balance sheet information. Thus, it is obvious that the measuring and reporting of IC should be seen as a tool separate but complimentary to the balance sheet. Business has always relied on its “intangible resources, along with tangible and capital resources, to create value and achieve the organization’s goals.” Business performance and success, therefore, depends on how well an organization ‘manages’ its resources. The objective of a typical for-profit business firm is to use its assets for producing goods and/or render services, which it can sell for generating cash. To attain the goal of a business firm “both tangible and intangible assets” are used in this process. It is the ‘readiness’ of the intangible assets that determines the ‘efficiency’ of this cycle. The cash so generated is ‘used’ in general in one of three different ways. It is either capitalized into more tangible assets or spent for the development of more intangible assets or paid out as dividends. This is also the reason why tangible assets appear on the balance sheet, whereas intangible assets do not. In order to understand how IC fits into the scheme of things, let us look at Figure-1.It should be noted that the goal of IC measurement is not to determine how much knowledge or IC has the firm by counting the number of computers or key employees, but how effective the organization is in creating value from it. The role of measurement is “to provide a framework to focus attention on the thing you intend to monitor. As such, measurement offers management a powerful tool that can influence organizational behaviour and action.” Unfortunately, modern accounting systems are designed exclusively (with some exceptions) for measuring and reporting “tangible” assets. The Gartner Group, for example, estimates that “intellectual” assets are worth approximately three to four times an enterprise’s book value. The dilemma remains that, even though IC can outweigh physical assets enormously, it is very difficult to find measures that will accurately reflect their value within an instrument, such as the “balance sheet.” Moreover, physical and IC have different properties and should therefore, have different valuation methods. This creates the phenomena of the “invisible” balance sheet. Figure-2 shows the balance sheet of a typical firm. Everything that appears below the ‘solid’ horizontal-line represents the “invisible assets of the firm.” This is balanced on the right hand side by a corresponding “invisible” equity.
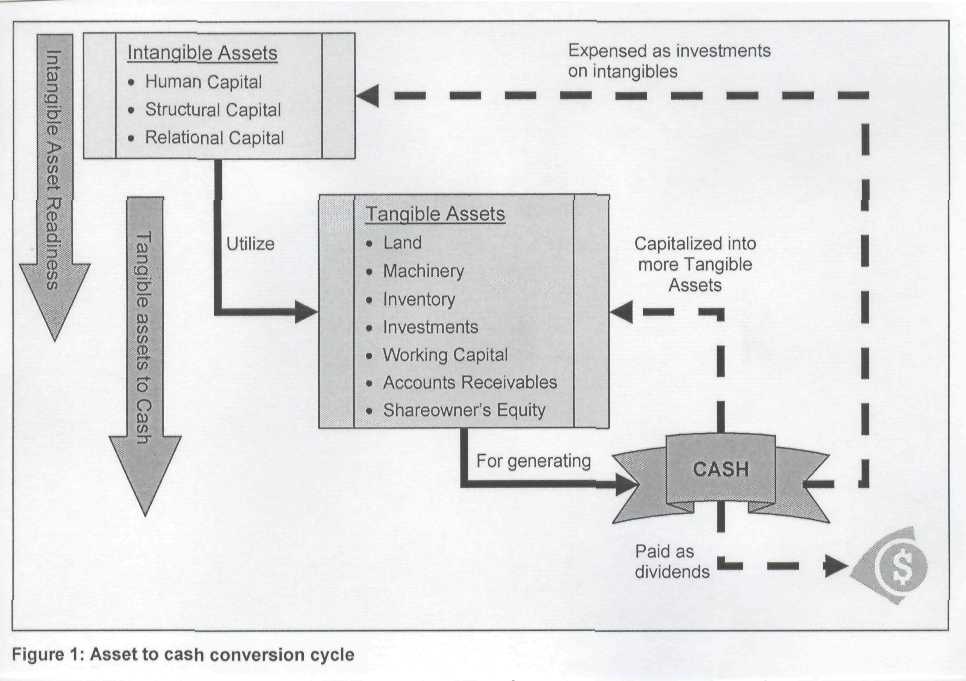 | Figure 1. The asset to cash conversion cycle of a business firm |
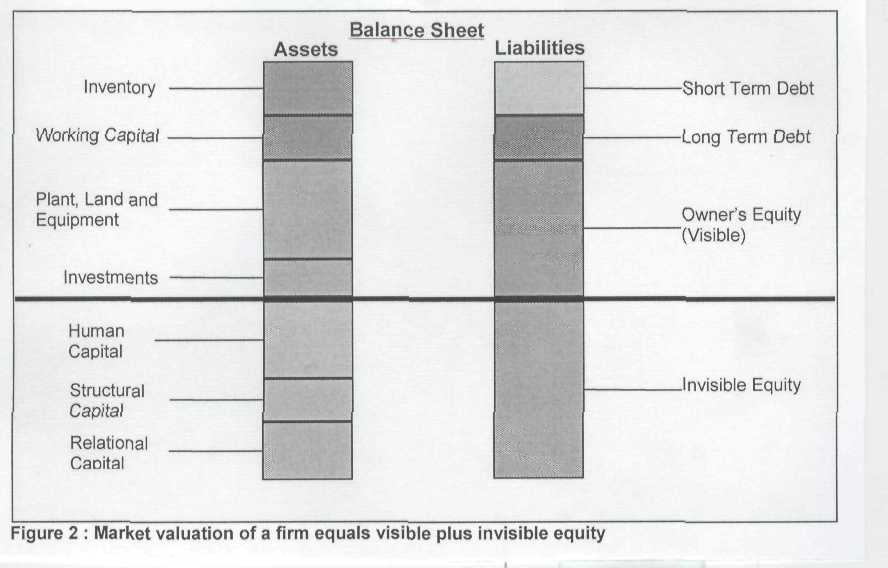 | Figure 2. Market valuation of a firm equals visible plus invisible equity |
4. Literature Review
- The main IC disclosure and measurement studies were typically cross-sectional and country-specific, although some longitudinal studies have been reported too. Some of the leading IC disclosure studies, widely reported in the literature, were conducted in Australia, UK & Ireland, Sweden, Canada, Malaysia, Sri Lanka, New Zealand, Bangladesh and India. While most studies employed “content analysis” as the research methodology, other studies have used questionnaire surveys[9]. Despite the fact that the importance of IC has increased in recent times, there are inadequate disclosures of IC in the financial statements of companies[10]. In a review of the current state of financial and external disclosure research, Parker[11] identified IC accounting as a major area for further research. However, most of the IC disclosure studies were cross-sectional and country-specific. Examples include studies in Australia[12],[13], Italy, Malaysia, UK , and Canada[14]. Relatively very few longitudinal studies have been reported[15]. Moreover, some studies focused on the specific aspects of IC disclosure, such as human capital disclosure, while others conducted international comparative studies. Some IC disclosure studies have looked beyond annual reports to examine other communication channels, such as, analyst presentations. Guthrie and Petty’s[16] analysis of IC disclosure practices suggests that disclosure has been expressed in discursive rather than numerical terms and that little attempt has been made to translate the rhetoric into measures that enable performance of various forms of IC to be evaluated.Bontis[14] conducted an empirical pilot study that explores the development of several conceptual measures and models regarding IC and its impact on business performance through principal components analysis (PCA) and partial least squares (PLS) methods. The main findings of study show that there is valid, reliable and significant link between dimensions of IC and business performance. Brennam and Connell examined substantial difference between company book value and market value, which indicates the presence of intellectual assets, not recognized and measured in company balance sheets and also provides guidelines to companies for reporting on IC. Maria and Jose Sarabia proposed a tree organization (TREEOR) model of valuation of IC of organizations based on variation of classical Lotka-Volterra equation system. The proposed model tries to measure IC of an organization to recognize the organizational mechanism of growth in analogy with growth of a tree and incorporates a bifurcation parameter that values to increase organizations IC. Prashanta and Srinivas measured the value of IC from financial reports of selected companies (viz., Infosys Technologies Ltd., Satyam Computers Ltd. and Dr. Reddy’s Laboratories) and also analyze the reasons for fluctuations in the value of IC of these companies. Market value added approach is adopted for measuring IC. Dr. Kamath[17] measures and evaluates the value added to a firm by its IC using a concept of value added intellectual coefficient (VAIC). The author remarked that value is created only if efficiency of resources is leveraged and value added increase in absolute terms is also not a measure for determining the value creation only if VAIC is increasing then it can be said that value is being created. Bhanawat measured the IC of companies by applying difference between market value and book value of firm. He found that present system of reporting of intellectual property in companies is not adequate and all selected companies fail to disclose whether an IP is self-developed or acquired. Further, Miguel Angel Axtle Ortiz analyses various components of IC through a humanistic model called contextual intellectual capital components valuation model (CONICCVATM). The sample population in eight geographic regions, 16 types of industries was analysed using 41 variables and 4 factors through multiple analysis of variances (MANOVA) methodology. The author concluded that only companies inserted in equivalents contexts could be compared and demonstrates the importance of the context in valuation of IC. In light of the above review of literature, an attempt has been made in present study to revisit the analysis of IC by market value added method.India presents an ideal case for the analysis of IC disclosures by the IT companies because the economy has been undergoing rapid economic transformation in the financial services, tourism, IT sectors and the niche manufacturing gaining momentum. In the Indian-context, there has been very limited number of IC disclosure studies, as compared to its European counterparts. However, two recent studies are available on IC disclosure in India using content analysis, which were done by Joshi and Bhasin[18], respectively. The foregoing discussion suggests that the literature on the determinants of IC disclosure in Indian-context is very limited and inconclusive. Thus, our study builds on the previous literature of IC disclosure practice and overall IC disclosure scenario in the Indian corporate sector, especially pharmaceutical firms. The scope of the study has been confined to 8 companies and a market value added approach was used on their annual reports for five years, namely, 2004-05 and 2008-09 respectively.
5. Research Methodologies Used
- Due to lack of “regional” research on IC disclosures in India, we first decided to focus on a “longitudinal” study of IC reports published by the Indian pioneer firms. After some initial research on business and intangible resources in the Indian companies, we found that three companies had published their first IC reports in 1997, which were discontinued later on. These firms are: Balrampur Chini Mills Limited, Reliance Industries Limited, and Shree Cement Limited. After some initial difficulties, we collected copies of IC reports published by these firms. The aim was to study the idiosyncrasy of the reports built in the Indian subcontinent.This research also aims at mapping the current state of IC measurement in the Indian scenario. Market value added approach (MVA), as a research methodology, is adopted for measuring IC of the 8 pharmaceutical companies in India. Accordingly, the sample-size of this study consists of the following eight pharmaceutical companies: Aventis Pharma Ltd., Dr. Reddy’s Laboratories Ltd., Novartis Ltd, Aurobindo Pharma Ltd, Torrent Ltd., Sun Pharma Ltd, Cipla Ltd., and Cadila Ltd. The electronic/soft copies of the annual reports for these selected companies were obtained for five years, 2004-05and 2008-09 from their respective corporate Websites. The relevant data required for present research study have also been collected from the electronic database ‘Prowess’ provided by the Centre for Monitoring Indian Economy (CIME). We feel the period of 5 years seems to be sufficient to analyse and establish the trend of IC of selected companies. Moreover, under the present study, various statistical techniques like mean, percentage, correlation, coefficient of variation (C.V.) and probable errors (P.E.) are used to analyse the data. More specifically, the objectives of this study are to: (a) measure IC in monetary terms for sample units, (b) examine the relationship of IC and tangible assets with net operating profit, and (c) examine effectiveness of IC over tangible assets. Hypotheses used are: (a) there is no relationship between IC and net operating profit, and (b) there is no difference between percentage of IC to market value and percentage of tangible assets to market value.
6. Intellectual Capital Disclosure Scenario in India: A Longitudinal Study
- With the rise of the “knowledge economy,” the management of IC is becoming even more important and, therefore, it should be disclosed in the annual reports. In the knowledge-based economy, therefore, most of the organizations have realized that the true potential of creating value for their organizations lies in the measurement, valuation, and disclosure of their IC[19]. Attracted by the lack of “regional” research on IC disclosures in India, we decided to focus on a “longitudinal” study of IC reports published by the pioneer Indian firms. After some initial research on business and intangible resources in the Indian companies, we found that three private-sector companies had published their first IC report in the year 1997. These firms are Balrampur Chini Mills Limited, Reliance Industries Limited, and Shree Cement Limited. After some initial difficulties, we collected IC reports published by these firms. The aim was to study the “idiosyncrasy of the reports built in the Indian subcontinent.” Why did these firms decide to build this innovative report? The reason is that the IC report contributes to the management of intangible resources, and also provides the shareholders’ with a “holistic” picture of the organizational resources. Let us study the experience of three leading firms, which had taken the lead by providing IC-related disclosures, so as to learn some valuable lessons from them.
6.1. Balrampur Chini Mills Limited
- The Balrampur Chini Mills Limited (visit www.chini.com) is one of India’s largest sugar companies, with three factories in Uttar Pradesh. In addition to the core sugar business, the company also produces and sells molasses and alcohol. In 1996-97 Annual Report, the firm elaborates about the rationale of IC and intangible report as: “to provide share owner a different and broader perspective of the company, and the fundamentals that drive its business”[20]. The Balrampur Model is specific to the company (1997-98) as “it reflects our priorities, our method of working, our attitude and our people”[21]. If successfully activated, this model becomes regenerative. As the company states in its 1998-99 report, “As we keep this intellectual capital wheel in motion, the Balrampur will always be a growing company”[22]. According to the firm, the five elements of IC are: credibility, efficiency, human, structural, and customer capital. Customer capital has a strategic importance for the firm. As it states, “This is the apex of Balrampur’s intellectual capital model. All the expertise built up on the manufacturing and marketing sides of the business is eventually judged on the ability of the company to produce sugar of acceptable quality”[23]. Moreover, the company stresses the benefits of valuing brands. The ability to outperform the sugar industry average is a reflection of the considerable intellectual capital that it has built into its business—at the farm, factory and marketing levels. The Balrampur Chini Mills’ ICR constitutes an independent document to the annual report. These reports had 11 pages (1996-1997), 24 (1997-1998), 48 (1999-2000) and 40 (2000-2001), respectively.
6.2. Reliance Industries Limited
- The Reliance Industries Limited (RIL) activities include exploration and production of oil and gas, refining and marketing, power, telecommunications, petrochemicals, textiles, financial services and insurance, and infocom initiatives. It has emerged as India’s most admired business house, for the third successive year in a TNS Mode survey for 2003. The Reliance’s employee skills are its competitive muscle. Its skills differentiate Reliance from its competitors—whether it be through the speedier implementation of a project or in its implementation at a cost which is significantly lower than that of the competition, or in the ability to extract more out of capital equipment, even when it ages. These skills are germinated in the Reliance culture. The ICR of RIL (www.ril.com) aims to: “redress the imbalance between non-financial and financial data, in recognition of the belief that value of organizations will, in times to come, increasingly reside in their intangible assets”[24]. The ICR is just focused on intellectual capital and addresses several key topics: the importance of the IC report itself, IC and value creation, human capital, structural capital, customer capital, and investor capital. However, it does not address the business model. It constitutes an independent document from the annual report with a total of 20 pages. The firm recognizes that “the development and the use of human potential and a learning organization is Reliance’s bridge to continued success in the future.” It uses the term “customer capital” not “relational capital” as most firms do. In this area, variables that matter are market creation, quality of customers, customer retention and growth, market share and the quality factor. Regarding structural capital, the firm admits that it must develop an organizational capability covering “strategy, speed of decision processes, ability to raise funds and prioritization. Organizational ability covers system architecture, the business process (horizontal integration), people processes, as well as, education, learning and knowledge building.” Finally, investor capital was the growth engine of Reliance. In this section (1998), the firm discusses issues focused on institutional shareholding, return to investors, stability in ownership, awareness initiatives, investor education and investor servicing.
6.3. Shree Cement Limited
- The Shree Cement Limited (visitwww.shreecementltd.com) is operating in the cement industry, which possesses two cement plants at Beawar, Rajasthan. It also has one of the few R&D centres in the Indian cement industry. It has a worldwide reputation for maximizing capacity utilization and low energy consumption level. Shree Cement Limited’s IC report is an independent document (having 28 pages) that constitutes a ‘Supplement’ to the Annual Report 2001. The firm understands that IC is “capturing our various experiences for organizational benefit, cross-pollinating our collective knowledge across various operational tiers, maximizing output with the minimum of resources, and doing things right the first time”[25]. The Company’s IC resides in its own employees. Thus, the firm has retained the majority of its members possessing valuable technical, financial and manufacturing skills.Shree Cement Limited’s drivers of excellence have an intangible nature. As it recognizes, they are: “an achievement-oriented culture, continuous innovation, widespread employee participation, sustained plant modernization, cross-functional information sharing, constructive dissatisfaction, personal pride in collective achievement, a family work culture, operational discipline, caring management, aggressive empowerment, reward and recognition system, workplace enthusiasm, mix of youth and experience, informal environment, spirit of “must do”, and quality obsession.” The ICR of the firm is in “narrative style” as it does not incorporate double-entry tables with indicators for its intellectual capital.
6.4. Peculiarities of IC Reports in India
- There is a vast difference in the disclosure mechanisms and methodology followed by the Indian corporations. In this context, Dr. Kamath[17] lucidly concludes as: “Some firms have been considering IC as an inseparable part of their total assets and disclosed it in their annual reports as ICR using the standard disclosure models. And, others publish those reports as a supplement to their annual reports, and some others give the details of growth in their IC over the previous period in a separate section in their annual report.” There is no doubt that in India, IC disclosure is still in its “evolutionary” stages and all the three means of disclosure are accepted. Moreover, we appreciate the growing awareness and attempts made by some leading IT companies to disclose IC in their annual reports. The Indian ICR does not focus on any business model, values, mission and vision, and/or knowledge management issues, as is the case with the European ICR. It presents information in a “narrative” style: it describes a firm’s IC and analyses its components without focusing extensively on specific indicators that measure these components. This is a major distinctive feature of Indian ICR. In sharp contrast with the European Union ICR, Indian reports do not combine a “narrative” and “quantifying” style[15]. All Indian ICR analysed in this study constitute an “independent” document that “complement” the Annual Reports. However, their length is much larger than the European Union reports. It is clear that companies in the European Union are way ahead of their counterparts elsewhere when it comes to the measurement, disclosure and management of their IC[8]. Finally, one of the firms in this study—Reliance Industries Limited—even created a specific term for investor relations (the investor capital) and provides an in-depth analysis of this capital.
7. Measurements of IC in Indian Companies: Analysis of Results
- In the knowledge economy, most of the organizations have realized that the true potential of creating value for their organization lies in the measurement, valuation and disclosure of their IC. Therefore, measurement and disclosure of IC is no more a choice but imperative for the IC driven firm’s performance. This research also aims at mapping the current state of IC measurement in the Indian scenario. Market value added approach (MVA), as a research methodology, is adopted for measuring IC of the eight Indian pharmaceutical companies over a period of five years from 2004-05 to 2008-09.In the present study, the IC of all the 8 selected companies has been calculated by applying Market Value Added (MVA) approach. Thereafter, the relationship of the IC and tangible assets with the net operating profits (NOP) has been discussed in terms of coefficient of correlation. Last but not the least, the effectiveness of IC over tangible assets has been examined through t-tests. Table-1 shows the measurement of IC of selected companies from Indian pharmaceutical industry.Table-1 shows the IC of eight selected companies during the five years from 2004-05 to 2008-09. The fluctuating trend in the amount of IC has been observed during the entire period of study among all the pharmaceutical companies. The highest absolute ‘average’ amount of IC has been reported by the Sun Pharma Limited (Rs. 11,998.1 crores) followed by Cipla Limited (Rs. 9,325.93 crores). Dr. Reddy’s Laboratories Limited was the only company, which could not create sufficient size of IC as compared to other companies. It reported not only least amount of average IC but negative value (Rs. -134.37 croes). The Indian pharmaceutical sector reported “an overall average amount of IC of Rs. 3065.15 crores during 2004-05 to 2008-09.” There is considerable variation observed among the average amount of IC of selected companies during five years. The year 2008-09 may be considered as good year for the shareholders of Indian pharmaceutical sector because this year reported highest average amount of IC (Rs. 3,905.29 crores). By and large, an increasing trend in the average amount of IC from 2004-05 to 2008-09 has been observed, except in 2006-07. The dispersion among the selected companies has been measured in terms of range, which comes to Rs. 12,132.47 crores[9,325.93-(-134.37)].
|
|
8. Conclusions
- In the modern era of global competitiveness, “IC has emerged as a strategic tool that adds value to the organization and gives a realistic picture to the stakeholders and potential investors about performance of the firm, which in turn support the corporate goal of enhancing shareholder value.” As a result, organizations are shifting their focus to measurement, disclosure and management of IC, their most valuable assets. The IC of a firm is its possession of knowledge applied experience, organizational technology, customer relationships and professional skills that provide it with a competitive edge in the market. It is the intellectual material, knowledge, information, intellectual property and experience that can be put to use to create wealth. Thus, the particular focus is to measure the organization’s IC so that contribution of intangibles to the business are measured in their own right, if measurement is feasible in practice, they will render the tangible as well as intangible assets of a company to be managed explicitly. The IC of a firm is “the sum total of its human capital, structural capital and relational capital.” These assets together form a source of distinct competitive advantage and distinguish the performance of one firm from the other. Having control on such assets enables effective internal governance, on the one hand, and succinct external communications, on the other. Hence it makes sense for firms to measure, monitor and report their IC. In order to be able to manage intellectual assets we have to recognize where this value is coming from and how it is created in an organization. The evaluation methods of the IC will become absolutely necessary in the future in order to explain the way in which the IC creates value. “Top companies will change the focus on the performance measuring systems elaborated in the past century because these are no longer relevant in today’s economy.” Ideas and information matter more than capital. Organization’s managers are obliged to take the initiative of measuring, managing and distribute the IC information referring to the way in which the organization generated value for stakeholders, employees, clients and the rest of investors. When organizations decide to start measuring IC, the reasons behind the decision can vary, but can be classified into two groups: internally oriented and externally oriented. Often, external reasons such as better public image, an increase in market value, reducing the difference between market and book value, additional information for potential investors and the market are more important then the internal benefits when realizing its influence on decision-making, overall business success, the connection between investments in intangibles and business goals as well as the necessity to manage them.Unfortunately, accounting, as it is currently practiced, has lost much of its ability to inform as businesses have become more and more knowledge intensive. Intangible assets are now variously estimated to currently constitute 60-75 percent of corporate value, on average. Research to date has yet to conclude how best to measure this intellectual capital. Current debates about IC are part of the search for a methodology to measure the knowledge base of a firm. This is critical since a failure to properly conceptualize the nature and value of knowledge assets condemns firms and whole economies to fight competitive battles with outdated weapons and tactics. Due to lack of “regional” research on IC disclosures in a developing country (like India), we first decided to focus on a “longitudinal” study of IC reports published by the Indian pioneer firms. After some initial research on business and intangible resources in the Indian companies, we found that just three companies (Balrampur Chini Mills Limited, Reliance Industries Limited, and Shree Cement Limited) had published their first IC reports in 1997, which were discontinued later on. The aim was to study the idiosyncrasy of the reports built in the Indian subcontinent. Second, this research also aims at mapping the current state of IC measurement in the Indian scenario. Market value added approach (MVA) is applied for 5 years for measuring IC of the following 8 pharmaceutical companies in India: Aventis Pharma Ltd., Dr. Reddy’s Laboratories Ltd., Novartis Ltd, Aurobindo Pharma Ltd, Torrent Ltd., Sun Pharma Ltd, Cipla Ltd., and Cadila Ltd. We feel the period of 5 years seems to be sufficient to analyse and establish the trend of IC of selected companies. However, under the present study, various statistical techniques are used to analyse the data. More specifically, the objectives of this study are to: (a) measure IC in monetary terms for sample units, (b) examine the relationship of IC and tangible assets with net operating profit, and (c) examine effectiveness of IC over tangible assets. The following broad conclusions can be drawn from above analysis and discussions: (a) The Indian pharmaceutical industry reported on an average (based on five years) amount of IC of Rs. 3065.15 crores, (b) The highest absolute average amount of IC has been reported by Sun Pharma Limited (Rs. 11,998.1 crores) while lowest average IC reported by Dr. Reddy’s Laboratories Limited (Rs. -134.37 crores), (c) Significant correlation has been identified between tangible assets and net operating profit while not significant correlation between IC and net operating profit, as it is evident by P.E. based test of significance, and (d) There is no significant difference between percentage of IC and tangible assets and percentage of tangible assets to market value as evident by t-test. So, null hypothesis is accepted.The International Accounting Standards Committee and its national counterparts face a challenge in setting standards for IC disclosure. The measurement examples thus far have been too firm-specific and no set of indicators could hope to be general enough to encompass the needs of a variety of international and industry settings. Auditing all of the different frameworks at this point would be pointless. In fact, pursuing standards at this point might be more harmful given the nascent stage of research development. Voluntary disclosure is the only solution in the short-term. In the long-term, it will be up to the demands of the capital markets. If shareholders and analysts agree that IC disclosure is beneficial in explaining business performance, than companies will have no choice but to appease their audience. In the meantime, academic researchers must continue to push the envelope on empirically-based studies so as to support the growing numbers of early adopters.
References
| [1] | José G. Vargas-Hernández and Mohammad Reza Noruzi (2010) ‘How intellectual capital and learning organization can foster organizational competitiveness?’ International Journal of Business and Management Vol. 5, No. 4; April pp. 1-11. |
| [2] | Bukh, P. N., Nielsen, C., Gormsen, P. and Mouritsen, J. (2005) ‘Disclosure of information on intellectual capital in Danish IPO prospectuses’ Accounting, Auditing and Accountability Journal, Volume 18 no. 6, pp. 713-732. |
| [3] | Chiucchi M.S. (2008) ‘Exploring the benefits of measuring intellectual capital’ The Aimag case study, Human Systems Management, Vol. 27, No. 3, pp. 217-230. |
| [4] | Stewart, Thomas A., 2002 ‘The wealth of knowledge: intellectual capital and the twenty-first century organization’ Currency Doubleday, 2002, 320 pages (ISBN: ISBN: 0385500718) |
| [5] | CIMA (2001) ‘Understanding corporate value: managing and disclosing intellectual capital’ Cranfield University, Publisher: Chartered Institute of Management Accountants (CIMA), pp. 1-28. |
| [6] | Sveiby, K.E. (2004) ‘Methods for measuring intangibles,’ available at www.sveiby.com. |
| [7] | Bernard, M, Dina, G. and Andy N. (2003) ‘Why do firms measure their intellectual capital?’ Journal of Intellectual Capital Vol. 4, No. 4, pp. 441-464. |
| [8] | Andriessen D. (2004), ‘Intellectual capital valuation and measurement: classifying the state of the art’ Journal of Intellectual Capital, Vol. 5, No. 2, pp. 230-242. |
| [9] | Beattie, V, and Thomas, S.J. (2006) ‘Lifting the lid on the use of content analysis to investigate intellectual capital disclosure’ Discussion Paper Series in Accounting & Finance, Heriot-Watt University, School of Management and Languages, September. |
| [10] | Bruggen, A., Vergauven, P., and Dao, M., (2009) ‘Determinants of intellectual capital disclosing: evidence from Australia’ Management Decision. Volume 47, No. 2, pp. 233-245. |
| [11] | Parker, L.D. (2007). ‘Financial and external disclosing research: the broadening corporate governance challenge’, Accounting and Business Research, Vol. 37, no. 1, pp. 39-54. |
| [12] | Guthrie J., Petty, R. Yongvanich, K. and Ricceri, F. (2004) ‘Using content analysis as a research method to inquire into intellectual capital disclosing’ Journal of Intellectual Capital, Volume 5, No. 2, pp. 282-293. |
| [13] | Brennan, N. (2001) ‘Disclosing intellectual capital in annual reports: evidence from Ireland’ Accounting, Auditing Accountability Journal, Volume 14, No. 4, pp. 423-36. |
| [14] | Bontis, Nick (2003) ‘Intellectual capital disclosure in Canadian corporations’ Journal of Human Resource Costing and Accounting, Volume 7, No. 1, pp. 9-20. |
| [15] | Abeysekera, I. (2007). ‘Intellectual capital disclosing between a developing and developed nation’ Journal of Intellectual Capital, Volume 8, No. 2, pp. 329-345. |
| [16] | Guthrie, J., Petty, R. M., and Ricceri, F. (2006). The Voluntary Disclosing of Intellectual Capital: Comparing Evidence from HK and Australia. Journal of IC, Volume 7, no. 2, pp. 254-271. |
| [17] | Kamath, B. (2008) ‘Intellectual capital disclosing in India: content analysis of teck firms’ Journal of Human Resource Costing and Accounting, Volume 12, No. 3, pp. 213-224. |
| [18] | Bhasin, M.L. (2011), ‘Intellectual capital disclosure scenario in India: an empirical study of IT Corporations’, Review of Economics & Finance, no.2, April, pp58-68. |
| [19] | Jing, Li, Richard Pike and Roszaini Haniffa (2007) ‘IC disclosure in knowledge rich firms: The impact of market and CG factors’ Bradford University Working paper series no. 07/06 April, pp. 1-29. |
| [20] | Balrampur Chini Mills Limited (1997a), The Intellectual Capital and Intangibles Report 1996-97, Balrampur Chini Mills Limited, Calcutta. |
| [21] | Balrampur Chini Mills Limited (1997), Intangibles Statement 1996-1997, Balrampur Chini Mills Limited, Calcutta. |
| [22] | Balrampur Chini Mills Limited (1999), Intangibles Document 1998-1999, Balrampur Chini Mills Limited, Calcutta. |
| [23] | Balrampur Chini Mills Limited (2000), The Intangibles Document 1999-2000, Balrampur Chini Mills Limited, Calcutta. |
| [24] | Reliance Industries Limited (1998), The Intellectual Capital Report 1997-98, Reliance Industries Limited, Mumbai. |
| [25] | Shree Cement Limited (2001), The Intellectual Capital Report. Supplement to Annual Report 2000-01, Shree Cement Limited, Bangur Nagar. |