-
Paper Information
- Next Paper
- Previous Paper
- Paper Submission
-
Journal Information
- About This Journal
- Editorial Board
- Current Issue
- Archive
- Author Guidelines
- Contact Us
International Journal of Finance and Accounting
2012; 1(4): 59-62
doi: 10.5923/j.ijfa.20120104.02
A Model for Evaluating Stock of Companies Listed on Tehran Security Exchange (TSE)
 Abstract
 Reference
 Full-Text PDF
 Full-Text HTML
Mohammad Ebrahimi
RaghebIsfahani University, Emam Khomeini Avenue, Isfahan, Iran
Correspondence to: Mohammad Ebrahimi , RaghebIsfahani University, Emam Khomeini Avenue, Isfahan, Iran.
| Email: |  |
Copyright © 2012 Scientific & Academic Publishing. All Rights Reserved.
Proper stock valuation is one of the most important issues to financial analysts, financial managers and investors. The purpose of this paper is to help the interested groups with required information for stock valuation. The sample of this study consists of 644 firm-years of companies listed on TSE since 2003 to 2009 year. Operating cash flows, earnings per share, book value per share, return on assets, assets turnover ratio, stock price at the beginning of the period, age of firm, size and industry type are the independent variables. The results of this research show that earnings per share and return of assets have adirect relationship with stock price. Results also show that firm’s stock price has a positive correlation with lagged stock price and it can be argued that the price of the stock is a continuum. Based on the results of this research the stock price is affected by the year of examination.
Keywords: Stock Price, Panel Data, Evaluation, Tehran Security Exchange (TSE)
Article Outline
1. Introduction
- The objective of financial statements is to provide information about the financial position, performance and changes in financial position of an enterprise that is useful to a wide range of users in making economic decisions." Financial statements should be understandable, relevant, reliable and comparable. Reported assets, liabilities, equity, income and expenses are directly related to an organization's financial position.Financial statements are intended to be understandable by readers who have "a reasonable knowledge of business and economic activities and accounting and who are willing to study the information diligently." Financial statements may be used by users for different purposes For example owners and managers require financial statements to make important business decisions that affect its continued operations. is then performed on these statements to provide management with a more detailed understanding of the figures. These statements are also used as part of management's annual report to the stockholders. Thus investors use financial statements for making economic decisions about buying or selling stock.One of the factors that affect the economic decisions, especially decisions about stock transactions is the stock price. Several factors affect the stock price and can be categorized by using different methods. Some believe that the price of firms' stock is under the influence of two factors: risk and return. This approach was presented in 1952 by Markowitz. Some other believes that these effective factors on stock price and return can be divided in two groups: macro-economic factors and firm's specific factors. This approach was presented as the single index model by Sharpe in 1961. Macro factors are those which affect every firm[16] and micro factors (firm’s specific factors) are those which only affect a specific firm[5].Micro factors can be divided in two groups: accounting variables and firm’s characteristics[10]. Accounting variables include all items that are included in the reports andfinancial statements and firm’s characteristics are those factors that can play an important role in determining the firm’s stock price, because being Profitable is among the factors that shareholders and potential investors care about and firm’s characteristics have a sensible effect on firm’s being profitable. Hence, this research tries to examine the effect of some of the accounting variables and firm’s characteristics on the stock price of firms listed on Tehran Stock Exchange.
2. Literature Review
- Shareholders and potential investors attempt to sell or buy stock considering available information (e.g. Stock price). Moreover, financial managers consider the stock price as one of the factors affecting decisions about the methods of financing and directors of firms try to show a positive performance by raising the stock market value. So, one of the important issues in experimental researches done in the field of accounting and finance management is stock pricing. So far, much research has been done in this area; this section tries to review some of the relevant ones.Hejazi and MalekiOskouei (2007) by investigating the information content of Cash Value Added (CVA) and P/E ratio in industrial companies in the Tehran Stock Exchange during 1999-2003, find that returns is more closely associated with CVA than P/E ratio. In other words, CVA has relative information content than P/E ratio. Incremental information content tests suggest that both of CVA and P/E ratios have incremental information content beyond each other[12]Gallizo& Salvador (2006) examined the relationship between accounting variables and the stock price. They used the hierarchical Bayesian in their research. Their results show that firm size and asset turnover ratio are the most effective factors in stock pricing[11].Dichev (1997) examined the relationship between accounting variables and the corporation’s stock price. He chose four variables as the independent variables; theses four variables are operating cash flow, earnings before interest and tax, net income and the book value of share. He studied the relationship among these variables and stock price. Results of his study show that operating cash flows and net income have a significant relationship with stock price[15].Bernard (1995) examined the relationship between accounting data and firms’ stock price. He presented two models for predicting stock market value and compared the explanatory power of these two models. In the first model he used two independent variables:the book value and dividend. In the second model he just used dividend as the independent variable[11]. His research’s results show the explanatory power of first model is more than the second model and also confirm existence of a relationship between the accounting data and firms’ stock price[15].Basu (1983) and Banz and Rolf (1981), among others, find evidence that stock returns and prices are positively affected by their fundamental values. On the other hand, the studies by Fama and French (1988, 1992), and Basu (1975) have reported contradictory results. They find that stock returns and prices are negatively affected by their fundamental values. In general, all these results have tried to draw a consensus on the role of fundamental ratios in the process of determining stock prices /returns and the goal of this area of research is to increase understanding ofhow these firm-specific components and other accounting information are related to stock prices[1].
3. Research Hypothesis
- The aim of doing this study is to help investors about identifying factors influencing the stock price. So research hypothesis is written as below:H0: There is a significant relationship between accounting variables, firm’s characteristics and stock price.In this hypothesis accounting variables include book value per share, return on assets, asset turnover ratio, operating cash flow per share and earnings per share and the firm’s characteristics include stock price of previous period, firm size and duration of firm's activity (life cycle).
4. Research Sample
- Statistical society of this research is the companies listed in Tehran Stock Exchange during the years 2003 to 2009 that their fiscal year lead to the end of March and their fiscal year date isn’t changed during the study period. This research used the elimination method to elect sample members. So the firms that didn’t have the above mentioned conditions were not selected in statistical sample and at last 92 firms were selected as the statistical sample.
5. Research Variables
- In this research logarithm of stock price is the dependent variables of research and explanatory variables of research (except for life cycle) are those variables which were used by Gallizo& Salvador (2006) and are divided in two accounting variables and firm’s characteristics. Table 1 presents the name of research’s explanatory variables and the method of measuring them.
6. Methodology of Research
- Panel data regression with fixed effects model (FEM) is used in this research in order to determine the relationship between the explanatory variables and the dependent variables of the research. Fixed effects model supposes that the constant variable varies over time[17]. In this case, dummy variables can be used for considering time’s effect and finally model 1 will be obtained. In model 1, DUM variable represents the dummy variables related to the time and as an example, DUM2004 is a dummy variable related to the 2004 which its amount for 2004 is equal to 1 and 0 for other years. Also, since 2003 is considered as the base year, so λ0 is the 2003 intercept coefficient; other years’ intercept coefficient is obtained from the sum of the coefficient of base year’s dummy variables and the base year (λ0).In the model 1 Log (Pi,t) is the logarithm of stock price of firm i in the year t, ui,t is model’s error and other variables is presented in the table 1.
7. Findings of Research
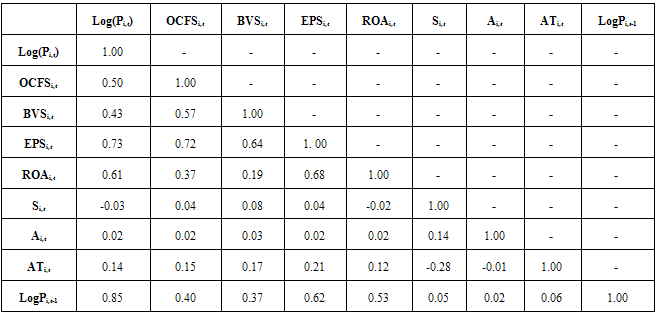
- In this study the correlation between accounting variables, firm’s characteristics and stock price is examined. Thus the Pearson correlation coefficient among the research variables has been presented in table 2. Table 2 shows that stock price has a negative correlation with firm’s size and it has a direct correlation with other explanatory variables of research. Also, table 2 shows that the current stock price has a significant relationship with lagged stock price. It means the stock price don’t follow random step model, because it is dependent to stock price of last period. But it’s necessary to do other statistic test for determining existence of significant relationship between variables of research. Therefor we examined model 1 and the result is summarized in table 3.
|
| ||||||||||||||||||||||||||||||||||||||||||
8. Conclusions
- The results of this research show that there is not any significant relationship between operating cash flow, book value of share and stock price. This research’s results are consistent with Dichev (1997). Moreover this research’s results like the Dichev (1997) and Bernard (1995) show two variables, earning per share and return of assets have adirect relationship with stock price. Results also show that firm’s stock price has a positive correlation with lagged stock price and it can be argued that the price of the stock is a continuum and it means sock price in Tehran Security Exchange (TSE) don’t follow random step model. Based on the results of this research the stock price is affected by the year of examination.It is recommended to users of the information to consider some factors when they are pricing the stock; factors such as: earnings per share, return on assets, previous stock prices and the time. Therefore, regarding the practical aspect of stock valuation of firms and great importance of predicting the stock price the researchers are recommended to do tests using independent variables that are different from this research’s independent variables such as parts of net income and total of cash flows instead of operating cash flows.
References
| [1] | Azam, Muhammad. “Stock Price Variation Regarding Macro-Economic and Firm-Specific Accounting Variables: Evidence from Karachi Stock Exchange”. International Research Journal of Finance and Economics, ISSN 1450-2887 Issue 81, 2011. |
| [2] | Banz and Rolf, W. “The Relationship between Return and Market Value stocks”. Journal of Financial Economics, 9, 1981. |
| [3] | Basu, S. “The Information Content of Price-Earnings Ratios”. Financial Management Journal, 4(2), 1975. |
| [4] | Basu, S. “The Relationship between Earnings Yield, Market Value, and Return for NYSE Common Stocks: Further Evidence”. Journal of Financial Economics, 12,129-156, 1983. |
| [5] | Bernard, V. “The FelthmanOhlson Framework:Implications for Empiricists”. Contemporary Accounting Research, 4 (spring), 733-744, 1995. |
| [6] | Dichev, I. “Measuring Value Relevance in Accounting Based Variables without Reference to Market Prices”. Journal of Accounting Research, 37(2), 319-352, 1997. |
| [7] | Elton, Dewin. J. and Martin, Gruber. “Modern Portfolio Theory and Investment Analysis”. 5d, Ed, John Wiley & Sons, 1995. |
| [8] | Fama, E. and .French, K. “Dividends Yields and Expected Stock Returns”. Journal of Financial Economics, 22, 3-25, 1988. |
| [9] | Fama, E.and French, K. “The Cross-Section of Expected Stock Returns”. Journal of Finance, 47, 427-465, 1992. |
| [10] | Gallizo, J.L. and M, Salvador. “Share Prices and Accounting Variables:A Hierarchical Bayesian Analysis”.Review of Accounting and Finance, 5(3), 268-278, 2006. |
| [11] | Haugen, Robert. “Modern Investments Theory”. 4d, Ed, Prentice Hall, Inc, 1997. |
| [12] | Hejazi, Rezvan, Mahboubeh, Jafari and Adel, Karimi. “The Information content of Accounting Variables In Companies listed in Tehran Stock Exchange (TSE)”. Business Management Dynamics, 1 (2), August 2011. |
| [13] | Hejazi,Rezvan and MalektajMalekiOskouei, “The Information Content of Cash Value Added (CVA) and P/E ratio: Evidence on association with Stock Returns for Industrial Companies in Tehran Stock Exchange”. The Iranian Accounting and Auditing Research, 14 (47), Spring 2007. |
| [14] | IASB (International Accounting Standards Board). “The Framework for the Preparation and Presentation of Financial Statements”. Accessed 24 June 2007. |
| [15] | Richard, P.B.And P, Zarowin.“The Value Relevance of Dividends, Book Value and Earnings”. New York, 6d, Printice-Hall, 1999. |
| [16] | Rutherford, D. “Dictionary of Economics”.London, 4d, Wiley & Sons, spring, 1992. |
| [17] | Techet, A.H.“13.42 Design Principles Forecean Vehicles. International Encyclopedia of Unified Science, Second Edition, University of Chicago press, 2005. |