-
Paper Information
- Paper Submission
-
Journal Information
- About This Journal
- Editorial Board
- Current Issue
- Archive
- Author Guidelines
- Contact Us
International Journal of Energy Engineering
p-ISSN: 2163-1891 e-ISSN: 2163-1905
2026; 16(1): 14-22
doi:10.5923/j.ijee.20261601.02
Received: Mar. 23, 2026; Accepted: Apr. 12, 2026; Published: May 15, 2026

Integration of Hydro-Electric Power with Variable Renewable Energy Sources for Enhanced Grid Stability in Zambia: A Reliability-Centred Assessment
 Abstract
 Reference
 Full-Text PDF
 Full-text HTML
Niza William Kashimu, Mabvuto Mwanza, Prince Mutale
Department of Mechanical Engineering, University of Zambia, Lusaka, Zambia
Correspondence to: Niza William Kashimu, Department of Mechanical Engineering, University of Zambia, Lusaka, Zambia.
| Email: |  |
Copyright © 2026 The Author(s). Published by Scientific & Academic Publishing.
This work is licensed under the Creative Commons Attribution International License (CC BY).
http://creativecommons.org/licenses/by/4.0/

Zambia's electricity system exhibits extreme vulnerability to hydrological variability, with hydropower contributing 83% of national generation capacity [1]. This concentration exposes the grid to recurrent drought-induced crises, as evidenced by the 2023–2024 emergency when reservoir depletion triggered generation deficits exceeding 700 MW and daily outages of 8–10 hours [2]. This study evaluates hybrid renewable energy configurations—specifically hydro–solar and hydro–solar–wind systems—as strategic responses to these reliability challenges. Employing a benchmark-based methodology utilising secondary data from ZESCO operational reports, NASA POWER, Global Solar Atlas, and IRENA cost databases, the research applies probabilistic reliability metrics including Effective Load Carrying Capability (ELCC), Loss of Load Expectation (LOLE), and Expected Energy Not Served (EENS) alongside techno-economic indicators. Results demonstrate that hydropower-only configuration achieves merely 42% ELCC under drought stress, with LOLE of 120 hours/year and EENS of 950 GWh/year. The hydro–solar configuration improves ELCC to 58% while reducing LOLE to 55 hours/year and EENS to 420 GWh/year. The hydro–solar–wind configuration attains superior performance with 74% ELCC, LOLE of 18 hours/year, and EENS of 120 GWh/year, achieving a stable levelized cost of electricity of USD 0.087/kWh. Sensitivity analysis confirms economic viability remains robust under 20% capital cost escalation associated with local content requirements. These findings substantiate hybrid renewable integration as a cost-effective, reliability-enhancing pathway for climate-resilient electricity planning in hydropower-dependent systems.
Keywords: Hybrid renewable energy systems, Grid stability, Hydropower–solar–wind integration, Effective load carrying capability, Loss of load expectation, Expected energy not served, Zambia, Climate resilience
Cite this paper: Niza William Kashimu, Mabvuto Mwanza, Prince Mutale, Integration of Hydro-Electric Power with Variable Renewable Energy Sources for Enhanced Grid Stability in Zambia: A Reliability-Centred Assessment, International Journal of Energy Engineering, Vol. 16 No. 1, 2026, pp. 14-22. doi: 10.5923/j.ijee.20261601.02.
Article Outline
1. Introduction
- The Zambian electricity sector presents a compelling case study of hydropower dependency and its attendant vulnerabilities. According to the Energy Regulation Board [1] Mid-Year Statistical Bulletin, hydropower constituted 83.0% of national installed capacity of 3,812.07 MW, with coal contributing merely 8.7%, solar 3.2%, heavy fuel oil 2.9%, and diesel 2.2%. This concentration, whilst historically delivering low-cost electricity, has progressively exposed the national grid to operational fragility under changing climatic conditions. The 2023–2024 drought episode proved particularly instructive: actual power generation declined to 1,019 MW by August 2024 despite installed capacity exceeding 3,800 MW, triggering load shedding schedules of 8–10 hours daily that severely disrupted mining and manufacturing operations [2]. The economic consequences proved substantial, with emergency diesel generation and power imports imposing costs of USD 0.22–0.30/kWh—far exceeding normal hydropower marginal costs.The fundamental challenge extends beyond single-event crisis management. Zambia's hydropower infrastructure exhibits structural characteristics that amplify climate vulnerability. As detailed in Table 1, Kariba North Bank possesses substantial live storage capacity of 64.8 billion cubic metres, enabling multi-annual regulation, yet this advantage concentrates systemic risk. Kafue Gorge Upper operates as run-of-river with minimal pondage (0.9 BCM), whilst Kafue Gorge Lower functions as a re-regulating station with limited active storage (1.2 BCM). Itezhi-Tezhi, though possessing 5.7 BCM storage, remains considerably smaller than Kariba. This asymmetry creates cascading vulnerability: reduced inflows at Itezhi-Tezhi propagate downstream, simultaneously constraining both Kafue Gorge stations. During prolonged drought, even Kariba's substantial storage proves insufficient, as evidenced by the progressive decline from 486.2 masl in 2018 to 476.0 masl in 2023—a trajectory approaching minimum operating levels of 475.5 masl.
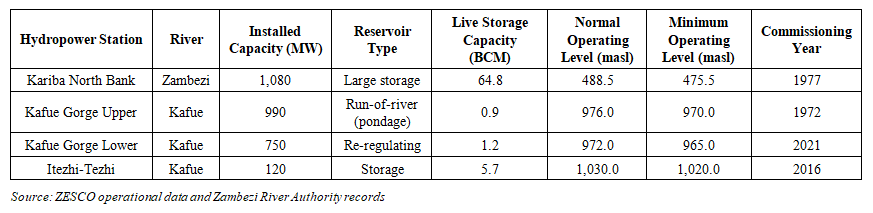 | Table 1. Major Hydropower Reservoir Characteristics in Zambia |
2. Literature Review and Theoretical Framework
2.1. Hydropower Dependency and Climate Vulnerability in Southern Africa
- The relationship between hydrological variability and power system reliability has received increasing scholarly attention as climate change intensifies drought frequency across Southern Africa. Dube and Nhamo [8] document how El Niño-driven droughts have created recurring generation shortfalls across the region, with particular severity in hydro-dependent economies. The World Bank [9] Zambia Energy Sector Review identifies diversification through solar and wind as strategic priorities, yet notes persistent barriers including grid capacity constraints and storage infrastructure deficiencies. These observations align with broader assessments of hydro-dominant systems globally, where structural characteristics—including live storage asymmetry, minimum operating level constraints, and run-of-river limitations—systematically constrain dispatch flexibility during hydrological stress.The theoretical foundation for this study draws upon systems-integration frameworks that conceptualise power systems as interconnected wholes rather than collections of discrete generation assets [10]. Within this perspective, hydropower provides dispatchable flexibility, solar and wind supply variable but complementary energy inputs, and storage technologies enable temporal balancing. Policy and institutional structures mediate these technical interactions, determining investment decisions, dispatch priorities, and planning approaches. This framework proves particularly apt for Zambia, where the Energy Regulation Board and ZESCO operate within policy parameters established by the National Energy Policy [11] and Renewable Energy Feed-in Tariff Framework [12], neither of which explicitly accommodates hybrid system coordination.
2.2. Floating Photovoltaic and Reservoir-Based Hybridisation
- Floating photovoltaic (FPV) technology has emerged as a particularly promising option for hydropower-dominated systems. Cazzaniga et al. [10] demonstrate that covering merely 2.4% of global hydropower reservoir surfaces with FPV could increase energy production by 35.9%, effectively transforming existing infrastructure into hybrid systems without land-use competition. The Longyangxia installation illustrates operational synergies: solar generation peaks during daytime hours when hydropower would otherwise discharge water, enabling reservoir conservation for evening peak demand. Portugal's Alqueva project, Europe's largest floating solar installation at 5 MW, integrates with pumped storage hydropower and includes 1 MW/2 MWh battery storage for enhanced dispatch control [4].The water–energy nexus benefits of FPV extend beyond generation complementarity. Githinji [13] estimates that FPV deployment can reduce reservoir evaporation by 60–70% in tropical climates, effectively increasing water availability for hydropower generation and other uses. Cooling effects from water contact improve PV module efficiency by 10–15% compared to land-based installations. These co-benefits prove particularly relevant for Zambia, where Kariba and Kafue reservoirs experience substantial evaporative losses during dry seasons. However, environmental considerations—including aquatic ecosystem impacts, water quality effects, and maintenance requirements under tropical conditions—necessitate careful regulatory oversight by the Zambia Environmental Management Agency.
2.3. Reliability Metrics for Variable Renewable Integration
- The integration of variable renewable energy (VRE) into power systems has necessitated development of sophisticated reliability metrics that extend beyond traditional capacity-based planning. Effective Load Carrying Capability (ELCC) has emerged as the predominant metric for quantifying renewable capacity value, measuring the additional load a system can reliably support after adding a variable resource without increasing outage risk [14]. Unlike capacity factor, which merely indicates average energy production, ELCC explicitly accounts for resource availability during high-demand periods and correlation with system stress. Grid operators including PJM, MISO, and California ISO have adopted ELCC for resource adequacy planning, with accreditation values varying seasonally and by technology type [15].Loss of Load Expectation (LOLE) quantifies the expected annual duration of supply shortfalls, typically expressed as hours per year or days per year. The widely-cited reliability standard of "one day in ten years" (0.1 days/year) derives from LOLE analysis, though regional variations exist [16]. Expected Energy Not Served (EENS)—also termed Expected Unserved Energy (EUE)—measures the total volume of unmet demand in energy units, capturing both outage frequency and magnitude [17]. Together, these metrics enable comprehensive assessment of how hybrid renewable configurations affect system adequacy. Recent applications demonstrate their utility: SPP [16] LOLE study reveals exponential EENS increases as LOLE rises, emphasising the non-linear relationship between reliability degradation and economic consequences.
2.4. Energy Storage in Hybrid Renewable Systems
- Energy storage technologies serve critical enabling functions in hybrid renewable systems, addressing temporal mismatches between variable generation and demand. Pumped Hydropower Energy Storage (PHES) provides bulk, long-duration storage with round-trip efficiencies of 70–85% and operational lifetimes exceeding 40 years, making it compatible with existing hydropower infrastructure [18]. Battery Energy Storage Systems (BESS), particularly lithium-ion technologies, offer rapid response capabilities essential for frequency regulation, voltage support, and short-term load balancing. The complementarity between these storage modalities—PHES for seasonal shifting and BESS for instantaneous response—supports comprehensive grid stability strategies.Kenya's Turkwel Power Station demonstrates practical application, where 106 MW hydropower integration with 40 MWh BESS improved frequency stability by 23% and reduced LOLE from 6.8 to 2.1 hours per year [18]. South Africa's hybrid renewable policy framework, incorporating competitive tenders for solar–wind–storage combinations under the Renewable Independent Power Producer Programme, has demonstrated capacity contributions of up to 20% firm capacity to the national grid. These precedents inform the storage considerations within this study, which evaluates PHES and BESS at conceptual and benchmark levels rather than through detailed sizing optimisation.
3. Methodology
3.1. Research Design and Analytical Approach
- This study employs a descriptive and analytical research design focused on comparative assessment rather than predictive modelling or system optimisation. The methodological approach prioritises transparency, reproducibility, and policy relevance through exclusive reliance on benchmarked secondary data from authoritative institutional sources. No unit commitment modelling, optimal power flow analysis, or dispatch simulation was undertaken; instead, representative hybrid renewable configurations are evaluated using standardised performance and cost indicators drawn from credible published sources. This approach proves appropriate for feasibility-level assessment intended to inform energy planning, tariff setting, and policy formulation under conditions of hydrological uncertainty.Microsoft Excel serves as the primary analytical and visualisation tool, enabling compilation, standardisation, and comparative analysis of techno-economic and reliability indicators. While advanced energy system tools such as HOMER Pro and PyPSA are referenced in the literature, they were not used for original simulation; rather, results reported in those studies were adopted as benchmarks and analysed within Excel. This methodological choice ensures findings remain grounded in observed operational realities rather than speculative assumptions, whilst maintaining accessibility for policymakers and utility planners.
3.2. Data Sources and Temporal Scope
- Operational and hydrological data were sourced from ZESCO annual reports and system operations documentation covering 2010–2023, capturing multiple drought cycles including the severe 2019–2020 and 2022–2023 episodes [1]. Meteorological inputs derive from Zambia Meteorological Department records and NASA POWER satellite-derived datasets [19]. Solar resource characteristics were obtained from Global Solar Atlas and Solargis databases, with cross-validation against PVGIS and CAMS-RAD products confirming consistency within ±7% [20,21]. As shown in Table 2, yearly Global Horizontal Irradiation (GHI) across six Zambian sites ranges from 1,638 kWh/m² to 1,702 kWh/m², with remarkably low spatial variability of 1.5% between sites [21]. Wind resource data were compiled from World Bank/ESMAP Global Wind Atlas v3.3, identifying viable zones in Sesheke, Petauke, and Chirundu with mean speeds of 5–7 m/s at 100m hub height [22].
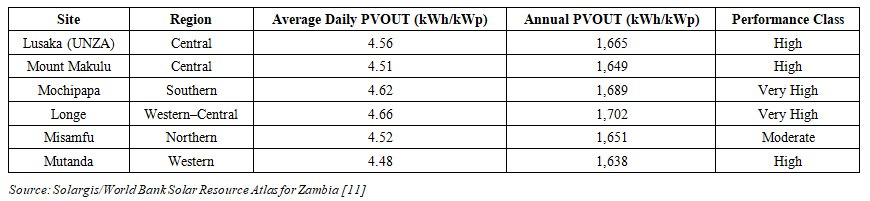 | Table 2. Long-Term Average Photovoltaic Output at Selected Sites in Zambia (1994–2017) |
3.3. System Configurations and Reliability Metrics
- Three system configurations are evaluated: (i) hydropower-only baseline representing current operational reality; (ii) hydro–solar hybrid incorporating utility-scale photovoltaic generation with existing hydropower assets; and (iii) hydro–solar–wind hybrid adding wind generation to exploit temporal complementarity. Energy storage is incorporated at conceptual level, with PHES considered for long-duration seasonal balancing and BESS for short-term flexibility and frequency regulation.Reliability assessment employs three probabilistic metrics. ELCC measures the incremental load each configuration can reliably support without increasing outage probability, expressed as percentage of installed capacity. LOLE quantifies expected annual outage duration in hours per year. EENS measures total unmet energy demand in GWh per year, capturing both frequency and severity of shortfalls. These metrics are calculated using standard industry methodologies adapted for benchmark-based analysis, with validation through comparison against ZESCO historical operational data.Techno-economic evaluation centres on Levelized Cost of Electricity (LCOE), calculated as total discounted costs divided by total discounted energy generation over project lifetime. Capital expenditure sensitivity analysis examines LCOE response to cost escalations of 5–20% associated with local content requirements, import duties, and financing conditions. Net Present Cost (NPC) and indicative Internal Rate of Return (IRR) provide supplementary investment appraisal perspectives.
4. Results and Discussion
4.1. Hydropower Performance Under Hydrological Stress
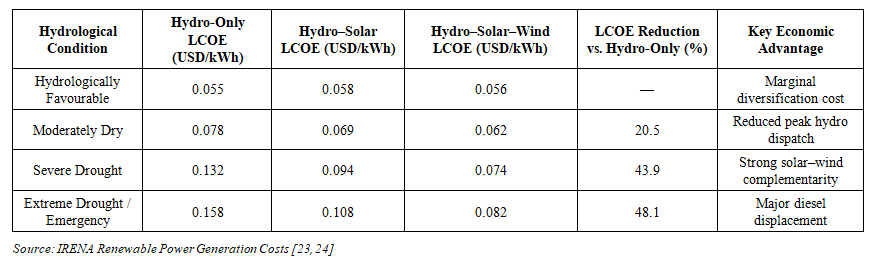
- Analysis of ZESCO operational data reveals systematic deterioration in hydropower system performance correlating with declining hydrological conditions. Between 2018 and 2023, Kariba average reservoir levels declined from 486.2 masl to 476.0 masl—a 10.2 metre reduction that approached the minimum operating level of 475.5 masl. Kafue River inflows decreased from 320 m³/s to 205 m³/s over the same period, whilst Itezhi-Tezhi live storage fell from 82% to 48%. These trends translated directly into operational classifications progressing from "Normal" (2018) through "Constrained," "Restricted," and "Critical" to "Emergency" (2023), with corresponding dispatch limitations and load shedding implementation.Table 3 presents the techno-economic performance of the hydropower-only configuration under varying hydrological conditions. During hydrologically favourable years, system LCOE remains approximately USD 0.055/kWh reflecting hydropower's low marginal cost. However, as conditions deteriorate to moderately dry, severe drought, and extreme drought scenarios, reliance on backup generation—primarily diesel and emergency imports—increases from 4% to 15%, 38%, and 46% of supply respectively. Corresponding system LCOE escalates to USD 0.078/kWh, USD 0.132/kWh, and USD 0.158/kWh, demonstrating extreme cost volatility driven by water availability rather than fuel price fluctuations. This volatility undermines tariff stability and increases financial risk for utilities and consumers alike.
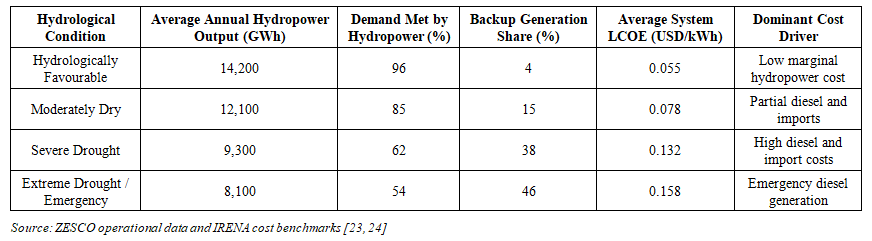 | Table 3. Techno-Economic Performance of Hydropower-Only Configuration |
4.2. Techno-Economic Performance of Hybrid Configurations
- The hydro–solar configuration demonstrates measurable improvements in cost stability and operational flexibility. As shown in Table 4, solar photovoltaic generation contributes 18–38% of daytime demand across hydrological scenarios, enabling 12–33% reductions in daytime hydropower dispatch and conserving 6–21% of reservoir water. These operational shifts translate into LCOE performance of USD 0.058/kWh (favourable), USD 0.069/kWh (moderately dry), USD 0.094/kWh (severe drought), and USD 0.108/kWh (extreme drought)—representing reductions of 5.5%, 11.5%, 28.8%, and 31.6% respectively compared to hydropower-only operation under equivalent conditions.
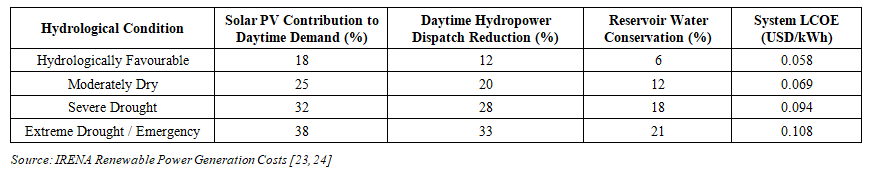 | Table 4. Techno-Economic Performance of Hydro–Solar Configuration |
 | Table 5. System-Level LCOE Performance of Hydro–Solar–Wind Configuration |
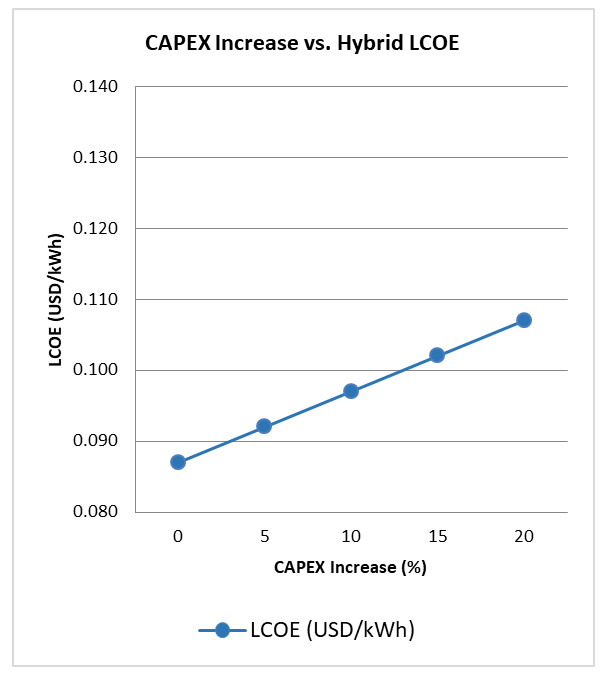 | Figure 1. Relationship between capital expenditure increases (associated with local content requirements) and levelized cost of electricity for hybrid hydro–solar–wind configuration. The near-linear relationship (R² = 0.9952) demonstrates predictable cost escalation within policy limits. Data source: IRENA cost benchmarks and author analysis |
4.3. Reliability Performance and Grid Stability
- Reliability metrics demonstrate transformative improvements from hybrid renewable integration. As shown in Table 6, the hydropower-only configuration achieves merely 42% ELCC under drought conditions, indicating that less than half of installed capacity contributes reliably to meeting demand. This limited firm capacity stems from hydrological constraints: minimum operating levels, storage depletion, and run-of-river limitations prevent full utilisation of physical infrastructure during stress periods.
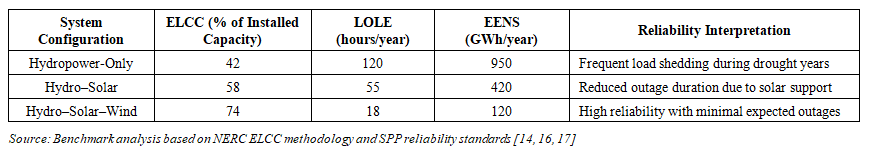 | Table 6. Reliability Metrics for Power System Configurations Under Drought Conditions |
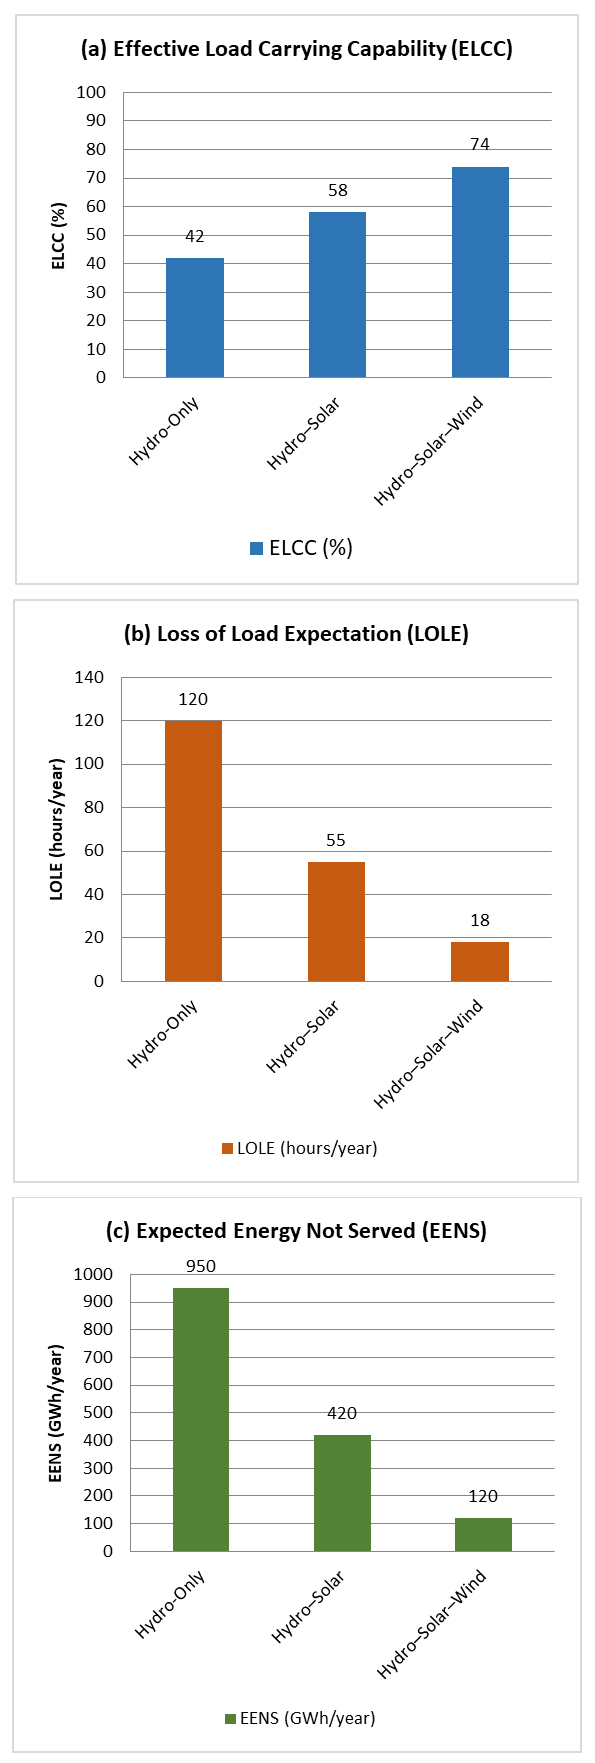 | Figure 2. Comparative reliability performance showing (a) Effective Load Carrying Capability, (b) Loss of Load Expectation, and (c) Expected Energy Not Served across hydropower-only, hydro–solar, and hydro–solar–wind configurations. Progressive improvements demonstrate the value of renewable diversification |
5. Conclusions
5.1. Principal Findings
- This study demonstrates that continued reliance on hydropower alone exposes Zambia's electricity system to unacceptable reliability and economic risks under current and projected climatic conditions. The benchmark-based assessment reveals that hybrid renewable integration—specifically coordinated hydro–solar–wind systems with appropriate storage considerations—offers a technically viable, economically competitive, and policy-aligned pathway for enhancing grid stability.The reliability improvements are substantial and transformative: ELCC increases from 42% to 74%, LOLE reduces from 120 to 18 hours/year, and EENS falls from 950 to 120 GWh/year. These gains are achieved whilst maintaining cost competitiveness, with hybrid system LCOE of USD 0.087/kWh remaining well below diesel generation alternatives and within national tariff benchmarks even under adverse capital cost assumptions. The economic benefits of hybridisation increase non-linearly with hydrological stress, precisely when hydropower vulnerability is greatest.
5.2. Policy and Planning Recommendations
- The findings carry significant implications for Zambian energy policy and regulatory frameworks, warranting specific recommendations across institutional, technical, and financial dimensions.Policy and Regulatory Reform. The Energy Regulation Board should refine the Renewable Energy Feed-in Tariff framework and associated grid codes to explicitly recognise the capacity value and reliability benefits of hybrid renewable energy systems. Current planning approaches evaluate renewable projects primarily on energy output and installed capacity, systematically undervaluing the reliability contributions demonstrated through ELCC analysis. Incorporating reliability-based metrics such as ELCC into tariff design and remuneration mechanisms would align investment incentives with grid stability objectives. The REFiT framework, designed for standalone renewable technologies, requires revision to explicitly recognise capacity value and hybrid system coordination benefits.Strategic Planning by ZESCO. ZESCO should systematically integrate hybrid hydro–solar–wind scenarios into national generation expansion plans and drought contingency strategies. The government's target of 6,200 MW additional capacity by 2030, with 90% from renewable sources, provides a favourable policy context [2]. Emphasis should be placed on hydro-firming strategies that conserve reservoir storage during periods of high solar and wind availability, thereby enhancing system resilience under hydrological stress. The utility should prioritise coordinated dispatch approaches that maximise complementarity between variable renewable generation and hydropower flexibility.Pilot Hybrid Projects. Pilot and demonstration hybrid projects should be prioritised to validate the technical, operational, and environmental benefits identified in this study. Floating photovoltaic installations on existing reservoirs such as Kariba and Kafue offer practical opportunities to test co-location benefits, including reduced evaporation losses, improved land-use efficiency, and enhanced grid reliability under real operating conditions. The 100 MW Chisamba Solar PV Project and 25 MW Mailo Solar PV Plant, completed in 2024, represent initial progress toward diversification, though substantially greater scale is required to address systemic vulnerability [25]. These early projects should incorporate explicit hybrid design features and monitoring protocols to generate operational data for future scaling.Financing and Investment Support. Government and development partners should promote blended financing instruments, concessional loans, and risk-mitigation mechanisms to reduce upfront capital cost barriers for hybrid renewable projects. Such support is particularly important for configurations involving energy storage technologies, where higher initial investment costs may otherwise limit deployment despite clear long-term reliability and economic benefits. Figure 3 presents the payback period analysis—demonstrating 5.4 years for base case hybrid configuration, 6.1 years with local content, and 6.8 years with storage expansion, all comfortably below the 8-year policy threshold—supporting investment attractiveness despite capital intensity. Development finance institutions should recognise the non-linear value of hybrid systems during drought periods when designing lending terms and risk instruments.
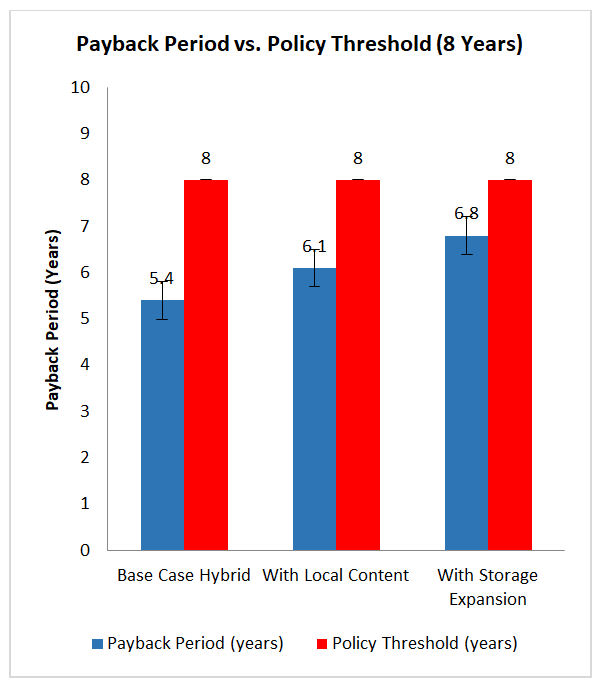 | Figure 3. Payback period comparison for hybrid system configurations relative to 8-year policy threshold. All scenarios demonstrate financial viability with adequate margin for investment risk |
5.3. Final Remarks
- For policymakers, the findings support revision of planning frameworks to prioritise renewable diversification and coordinated hybrid operation over incremental expansion of single-technology projects. For ZESCO and independent power producers, the results provide benchmarked evidence for hybrid project development and investment decisions. For the broader research community, the study demonstrates that robust planning insights can be derived through transparent, Excel-based analysis of secondary data—an approach particularly suited to developing country contexts where complex modelling capacity may be constrained.The transformation of Zambia's electricity system from hydropower dependency to diversified hybrid renewable generation represents not merely a technical transition but a fundamental reorientation toward climate-resilient development. The evidence presented in this study provides a foundation for that transition, demonstrating that reliability, economic efficiency, and sustainability can be advanced simultaneously through thoughtful integration of complementary renewable resources.
ACKNOWLEDGEMENTS
- The authors wish to express profound gratitude to numerous individuals and institutions whose contributions made this research possible. First and foremost, we acknowledge the Almighty God for the grace, strength, and divine guidance that sustained this academic endeavour throughout its execution.Our sincere appreciation extends to the supervisory team at the School of Engineering, University of Zambia, for their professional mentorship, insightful feedback, and unwavering commitment to academic excellence. Their patience and rigorous engagement significantly shaped the direction and quality of this research.We gratefully acknowledge the Zambia Electricity Supply Corporation Limited (ZESCO) for providing operational data on reservoir levels, hydrological inflows, and system performance that formed the empirical foundation of this study. The Energy Regulation Board (ERB) is recognised for making regulatory and statistical information available through their published bulletins and reports.Data provision by the Zambia Meteorological Department (ZMD), NASA POWER programme, World Bank/ESMAP Global Solar Atlas and Global Wind Atlas, and the International Renewable Energy Agency (IRENA) proved essential for resource assessment and techno-economic benchmarking. The Solargis team is acknowledged for their high-quality solar resource mapping work in Zambia, which provided validated ground-measurement data for model verification.The Copperbelt Energy Corporation (CEC), Itezhi-Tezhi Power Corporation, and other independent power producers are recognised for their contributions to sector data. We also thank the Ministry of Energy for their policy guidance and commitment to renewable energy diversification.Finally, we acknowledge the University of Zambia for providing the academic environment and research infrastructure that enabled this study, and our families for their patience and support throughout the demanding research period.