-
Paper Information
- Paper Submission
-
Journal Information
- About This Journal
- Editorial Board
- Current Issue
- Archive
- Author Guidelines
- Contact Us
International Journal of Energy Engineering
p-ISSN: 2163-1891 e-ISSN: 2163-1905
2026; 16(1): 1-13
doi:10.5923/j.ijee.20261601.01
Received: Jan. 24, 2026; Accepted: Feb. 15, 2026; Published: Mar. 7, 2026

Electricity Supply Planning Using the MESSAGE Model in Niger: A 2050 Horizon
 Abstract
 Reference
 Full-Text PDF
 Full-text HTML
Aboubakar Amadou Yansambou Mohamed1, Hamidine Mahamadou2, Arouna Saley Hamidou2, Makinta Boukar3
1Department Physics, Abdou Moumouni University, Niamey, Niger
2Faculty of Sciences and Technics, Dan Dicko DanKoulodo University, Maradi, Niger
3Faculty of Sciences and Technics, Abdou Moumouni University, Niamey, Niger
Correspondence to: Aboubakar Amadou Yansambou Mohamed, Department Physics, Abdou Moumouni University, Niamey, Niger.
| Email: |  |
Copyright © 2026 The Author(s). Published by Scientific & Academic Publishing.
This work is licensed under the Creative Commons Attribution International License (CC BY).
http://creativecommons.org/licenses/by/4.0/

This study assesses Niger’s electricity supply prospects to meet projected demand by 2050 using an integrated energy planning approach. Existing and planned power projects are evaluated and incorporated into the MESSAGE model developed by the International Atomic Energy Agency (IAEA). The electricity demand used in this model comes from four scenarios established using MAED (Model for Analysis of Energy Demand): Ambitious scenario, Nuclear-free scenario, Reference scenario, and Modest scenario. The results show that in 2050, all scenarios guarantee production exceeding demand excepted the Modest scenario. The balance between electricity production and demand remains satisfactory (1.09-1.10) in the Ambitious and Nuclear free (No Nuclear) scenarios, slightly tighter (1.08-1.09) in the Reference scenario, but falls dramatically in the Modest scenario with a ratio of 0.692 in 2050, creating a structural deficit of 30.8% (2,755 GWh of unmet demand). Analysis of cumulative emissions for 2021-2050 reveals that the Modest scenario, with around 17.3 million tons (577 Ktons per year), benefits from low ambition, which limits absolute emissions despite high carbon intensity. The ambitious scenario without nuclear power has the heaviest impact, with around 61.8 million tons (2,060 Ktons per year), which is 3.2 times more than the reference scenario and 2.4 times more than the ambitious scenario with nuclear power. The economic analysis reveals that the ambitious scenario, although generating significant volatility, demonstrates that bold planning can lead to very competitive prices in certain areas (US$6.8/kWyr in the Central Zone in 2036), potentially justifying the associated risks. The results highlight a direct correlation between socio-economic development and energy demand. The ambitious scenario is optimal for the balance between energy security (ratio 1.097), climate performance (25.8 Mtons CO₂ cumulative), and technological resilience (diversification of 7 sources, none exceeding 33%); its total estimated cost of between USD 16-18 billion appears to be the most suitable option for achieving sufficient energy coverage, supporting industrial and demographic growth, and committing the country to a sustainable transition.
Keywords: Electricity demand, Electricity production, CO2 emissions, Energy system, MAED software, MESSAGE software
Cite this paper: Aboubakar Amadou Yansambou Mohamed, Hamidine Mahamadou, Arouna Saley Hamidou, Makinta Boukar, Electricity Supply Planning Using the MESSAGE Model in Niger: A 2050 Horizon, International Journal of Energy Engineering, Vol. 16 No. 1, 2026, pp. 1-13. doi: 10.5923/j.ijee.20261601.01.
Article Outline
1. Introduction
- Niger faces a dual challenge in terms of its national electricity supply. On the one hand, the country must respond to rapidly growing electricity demand. According to a study conducted using the MAED model with projections up to 2050, electricity demand is expected to increase dramatically under all scenarios: (i) in the Ambitious scenario, demand increases by 1,975%, rising from 160 Megawatt-year (MWyr) in 2021 to 3,320 MWyr in 2050; (ii) in the Reference scenario, demand grows by 919%, from 160 MWyr to 1,630 MWyr over the same period; and (iii) in the Modest scenario, demand increases by 637.5%, reaching 1,020 MWyr by 2050 [1]. On the other hand, Niger must reduce its strong dependence on electricity imports while ensuring the sustainability of its energy supply in a context marked by significant economic, environmental, and political constraints. Currently, domestic electricity supply remains insufficient to meet national demand. Between 2010 and 2020, total electricity production increased from 852.1 GWh to 1,742.7 GWh, representing a growth of 104.5%, with an average annual growth rate of 7.5% [2]. Electricity generation relies predominantly on diesel- and fuel oil-fired power plants, which are both costly and highly polluting in terms of greenhouse gas emissions. Electricity imports from Nigeria remain the primary source of supply, accounting for between 54% and 65% of total electricity availability, despite a notable increase in domestic production from 303.0 GWh in 2010 to 634.9 GWh in 2020 [2]. The contribution of solar photovoltaic energy remains marginal, representing less than 1% of the electricity mix in 2020, with a total installed capacity of only 5,194.95 kWp in 2014. Access to electricity also remains a major concern. Between 2010 and 2020, the national household electrification rate increased from 8.63% to 15.72%, corresponding to an average annual increase of only 0.6%. In rural areas, access rose from 0.6% to 1.55%, while in urban areas it increased from 39.93% to 74.39%.These challenges are compounded by delays in the commissioning of major energy projects, such as the Kandadji dam, the Tarka wind farm, and the nuclear power programme. Furthermore, the national transmission and distribution network remains fragmented and weakly interconnected, leaving many areas isolated from the main grid. Limited domestic investment capacity further constrains sector development, making large-scale energy projects heavily dependent on external financing from international institutions such as the World Bank, the African Development Bank (AfDB), and the West African Development Bank (BOAD) [2].The objective of this study is to provide Niger with a long-term energy planning framework to support sustainable electricity sector development. Specifically, the study aims to: (i) estimate future electricity supply requirements to meet national demand by 2050; (ii) assess fuel consumption and electricity generation costs; and (iii) evaluate greenhouse gas emissions associated with electricity production.The originality of this work lies in the application of the MESSAGE model, specifically adapted to the characteristics and constraints of a developing Sahelian country. The 2050 time horizon is particularly ambitious for Niger and allows for the anticipation of major structural transformations required in the electricity sector. This study thus contributes to the formulation of strategies to support national energy policy development.Energy supply planning and prospective modelling have been widely addressed at national and regional levels using various tools, including MESSAGE, LEAP, EnergyPLAN, SPLAT-W, and OSeMOSYS. In Nigeria, studies such as [3] recommend a combination of renewable and non-renewable energy sources to address the electricity crisis affecting more than 80 million people without access to electricity. Their EnergyPLAN-based analysis of 99 scenarios places a strong emphasis on natural gas, with approximately 36,000 MW required, raising sustainability concerns due to methane emissions. By contrast, [4] advocate for a 100% renewable electricity mix, an ambition considered unrealistic by other studies. For example, the Portuguese experience demonstrates that while renewables were able to meet national electricity demand for one month, they could not sustain supply over an entire year [5]. In Algeria, [6] propose achieving 40% renewable electricity by 2030 while ensuring security of supply until 2062, in response to fossil fuel depletion and climate challenges. In Mali, [7] use the MESSAGE model to evaluate hydroelectric and solar potential in the Taoussa region, aiming to identify a low-cost, low-emission electricity mix that reduces import dependence and promotes job creation. In Macedonia, [8] apply MAED and MESSAGE to plan electricity supply and demand up to 2040, favouring imports over domestic generation expansion. Meanwhile, [9] combine Schwartz’s scenario method with the LEAP model to estimate sustainable electricity supply and demand in low-electrification countries, highlighting the importance of rigorous demand forecasting. In Chile, [10] use MESSAGE to assess the short-, medium-, and long-term impacts of new electricity generation capacity on the energy mix and electricity prices, highlighting risks associated with nuclear power and supply security. Similarly, [11] analyse future electricity supply in Syria for the period 2003–2030 using the MESSAGE model, with a focus on fossil fuels and their environmental impacts. In West Africa, [12] propose an electricity mix incorporating 48% renewable energy by 2030 using the SPLAT-W model, derived from MESSAGE, and accounting for scenarios such as drought years. Studies such as [13] apply MESSAGE to identify least-cost electricity generation options for 2030 and 2035 in the context of energy insecurity and sectoral underdevelopment. At the continental scale, [14] model the energy systems of 47 African countries using the TEMBA and OSeMOSYS frameworks, incorporating electricity and gas trade to identify optimal medium- and long-term solutions (2015–2065). Specifically for Niger, [15] estimate that between 512 MW and 682 MW of additional solar photovoltaic capacity will be required by 2030 to meet growing electricity demand and reduce the energy deficit.This review highlights the diversity of modelling approaches applied to electricity planning, with several studies employing the MESSAGE framework, which is particularly well suited to Niger’s context. However, studies specifically focused on Niger remain limited ([12], [13], [14], [15]) and relatively broad in scope. They do not sufficiently account for the current condition of the national electricity grid, regional interconnection constraints, seasonal variability in electricity production, or local economic and institutional realities. Consequently, there is a clear need for a Niger-specific modelling approach that integrates technical, economic, environmental, and political dimensions in order to develop robust electricity supply scenarios up to 2050.Given Niger’s vast energy resource potential, this study contributes to: identifying an optimal technology mix (solar, wind, hydropower, thermal, natural gas, and coal) to achieve electricity self-sufficiency and significantly reduce imports; determining the most economically viable investment pathways based on national resources; integrating at least 30% renewable energy into the national electricity mix by 2050; and analysing the environmental impacts and CO₂ emissions associated with different development scenarios.The methodology adopted in this study is presented in Section 2, while the simulation results and their discussion are provided in Section 3.
2. Methodology
2.1. Type and Approach of Research
- This study adopts a quantitative prospective approach based on modelling and energy optimisation. The research is part of a normative planning process aimed at determining the optimal development trajectories for Niger's electricity system by 2050.The methodological approach combines: (i) technical and economic modelling using the MESSAGE tool; (ii) scenario analysis to explore different possible trajectories; and (iii) linear optimisation to minimise system costs under constraints.
2.2. Presentation of the MESSAGE Model
- The IAEA MESSAGE model (Model for Energy Supply System Alternatives and their General Environmental Impacts) is a software package designed to develop optimization models for energy supply systems, with the objective of evaluating capacity expansion strategies and energy production policies. It enables the assessment of alternative pathways for the development of energy supply systems at the national, sub-regional, or regional level over the medium and long term, while explicitly accounting for their environmental impacts [16].MESSAGE provides a comprehensive framework for modelling energy supply systems based on the concept of the energy chain, also referred to as the Reference Energy System (RES). This framework encompasses primary energy resources and their extraction, energy imports and exports, energy conversion and transformation processes, energy transmission and distribution networks, and the delivery of final energy services such as lighting, motive power, transportation, and heat [16].Figure 1 presents the general structure of the MESSAGE model.
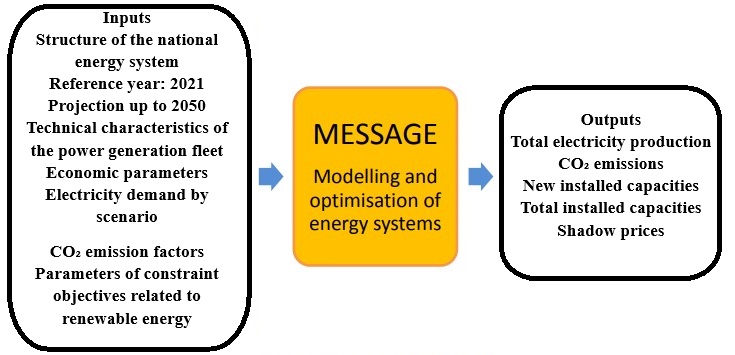 | Figure 1. Structure of MESSAGE |
2.3. Data Categories and Sources
- The data used to parameterize the MESSAGE model were collected from a wide range of national and international sources. In particular, the electricity demand inputs are derived from the three scenarios developed using the MAED model [1]. Additional key datasets include: (i) historical electricity consumption by sector over the period 2010–2022; (ii) current electrification rates in urban and rural areas; (iii) demographic statistics and long-term population projections; (iv) gross domestic product (GDP) data and economic growth prospects; (v) demand elasticity with respect to GDP and population; (vi) technical characteristics of the electricity generation fleet, including unit capacities, conversion efficiencies, operational lifetimes, availability factors, load factors, and construction lead times; (vii) economic parameters such as investment costs, fixed and variable operation and maintenance costs, fuel prices, transmission and distribution costs, and a discount rate set at 10%; (viii) CO₂ emission factors by fuel type (tCO₂/MWa); and (ix) national renewable energy resource potential, particularly solar (average irradiation in kWh/m²/day), hydropower (identified sites, river flow rates, and head heights), wind (average wind speeds), as well as national fossil fuel resources, including coal, oil, uranium, and natural gas.Energy sector data were obtained primarily from the Ministry of Energy and the Niger Electricity Company (NIGELEC). Demographic, economic, and macro-energy data were sourced from the National Institute of Statistics (INS), the World Bank, the International Monetary Fund (IMF), the Ministry of Economy and Finance, the Ministry of Planning, and other official national institutions. Information on solar and wind resources was provided by national meteorological stations.International databases consulted include SIE-Niger, IRENA, the IAEA, the International Energy Agency (IEA), and the African Development Bank. In addition, several national strategic and planning documents were reviewed, including the Sustainable Development and Inclusive Growth Strategy (SDDCI), the National Energy Policy, the Nationally Determined Contribution (NDC), the Economic and Social Development Plan (PDES 2022–2026), and the National Communication.
2.4. Architecture of the MESSAGE Model for Niger
2.4.1. Time Horizon and Temporal Resolution
- The year 2021 was selected as the base year for the MESSAGE model, as it represents the most recent period for which comprehensive and reliable statistical data are available and was not affected by major disruptive events in the energy or economic sectors. In addition, a complete and consistent set of national energy balances is available up to this year.The modelling horizon extends from 2021 to 2050, with a temporal resolution of one-year time steps.
2.4.2. Modelled Energy System
- Figure 2 illustrates the structure of the modelled energy system, representing energy flows across multiple levels: Resources, Primary, Secondary 1, Secondary 2, Tertiary, and Final consistent with the Reference Energy System (RES) approach [17], [18], [19], [20].
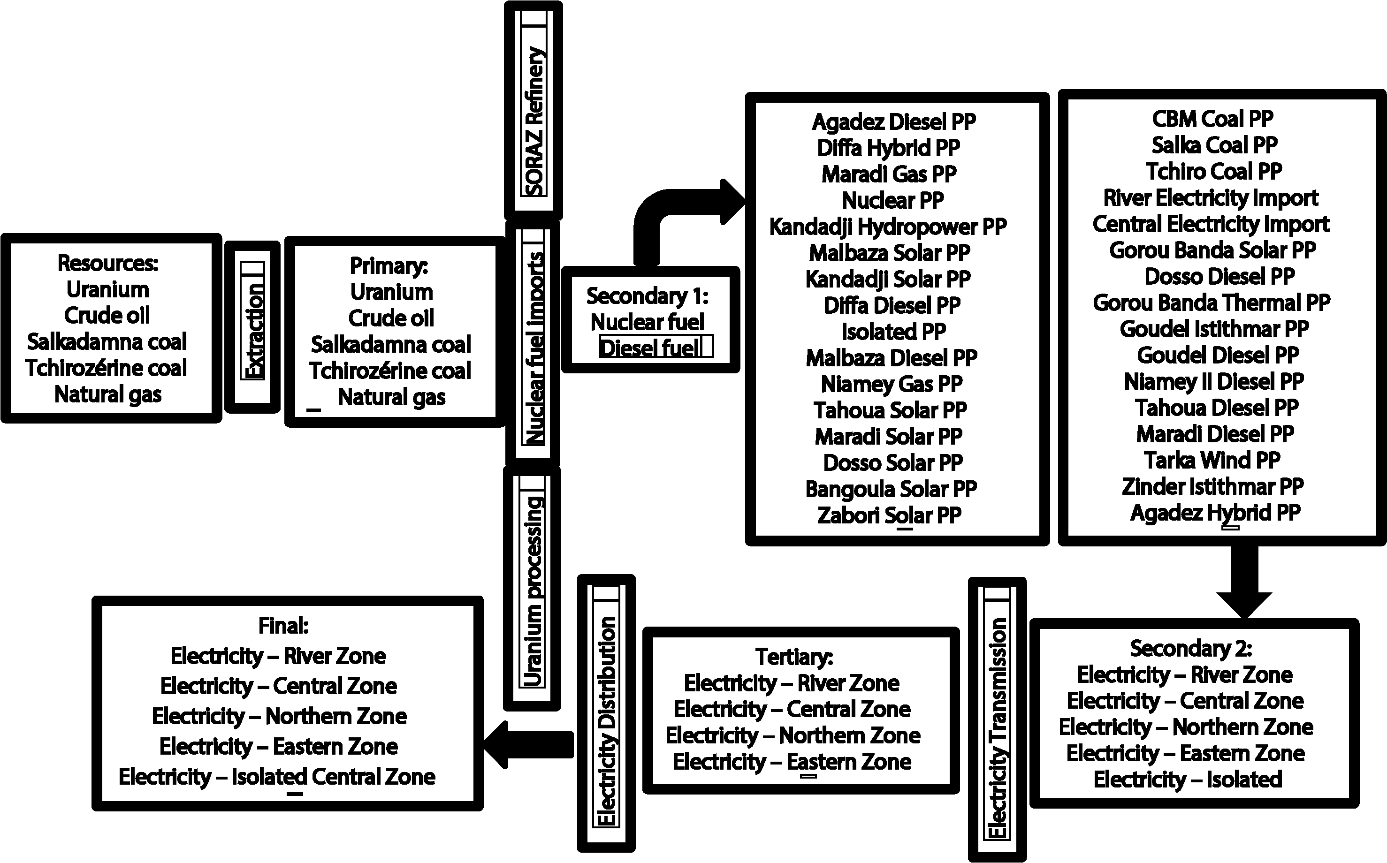 | Figure 2. Energy systems in Niger |
2.5. Scenario Assumptions
- The scenarios are developed using an exploratory approach that combines exogenous drivers (population growth, economic growth, and technological cost evolution), policy assumptions (electrification targets, renewable energy objectives, and carbon constraints), and scenario-specific technical limitations.In this study, the following scenarios will be considered: Reference scenario, Ambitious scenario, Nuclear-free scenario, and Modest scenario. In the Reference scenario, the electricity demand values from the MAED study's Reference scenario are considered, along with projects that have been decided upon or not decided upon. The Ambitious scenario is the scenario that considers the electricity demand of the “ambitious” scenario of the MAED model, in which both decided and undecided projects are considered. This is the scenario of strong economic growth. The Nuclear free scenario (No Nuclear) is the scenario that considers the electricity demand of the MAED model's “ambitious” scenario without the nuclear power program. In the Modest scenario, the electricity demand of the MAED study's “Modest” scenario is used.Common assumptions across all scenarios include a real discount rate of 10%, consistent with the 2011–2012 WAPP master plan. All monetary values are expressed in constant 2015 United States dollars (USD). Data reported in USD for other years are adjusted using the United States GDP deflator provided by the World Bank [21].
2.6. Calibration and Validation of the MESSAGE Model
- The MESSAGE model was calibrated using historical electricity production data from Nigelec (Société Nigérienne d’Electricité) for the River Zone over the period 2013–2022. The objective was to adjust the model's technical and economic parameters (efficiency, availability factors, operating costs, and reserve margins) in order to best reproduce the observed dynamics of the actual electricity system. Figure 3 shows the evolution of production in the MESSAGE model and actual production by Nigelec [17].
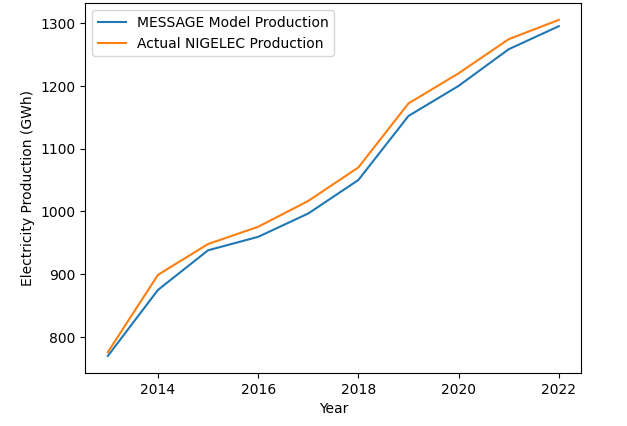 | Figure 3. Actual electricity production vs. simulated production |
|
|
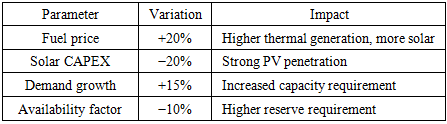
2.7. Uncertainty Analysis
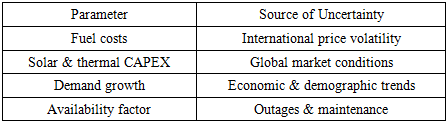
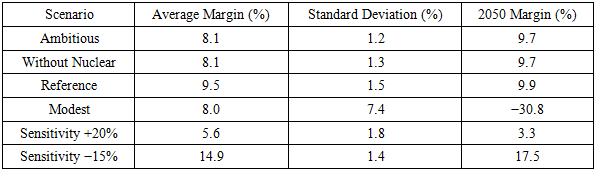
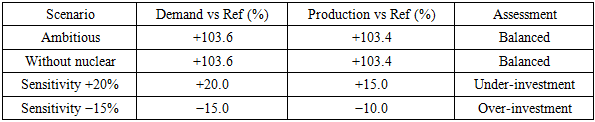
- An uncertainty analysis was conducted to assess the robustness of energy trajectories (2021–2050) in the face of variations in technical and economic parameters. The objective is to identify the critical variables influencing investment decisions, measure the impact on the total cost of the system, the structure of the 2050 mix, and cumulative CO₂ emissions, and inform risk management.Two complementary approaches were implemented:(i) Univariate sensitivity analysisEach key parameter (fuel prices, technology CAPEX, discount rate, carbon cost) is varied individually around its reference value (−30%, −15%, +15%, +30%), with the other assumptions remaining constant. The indicators analyzed are total discounted cost (2021–2050), energy mix in 2050, and cumulative emissions (2025–2050).(ii) Combined scenariosFour consistent scenarios were defined in order to integrate interaction effects: (i) Optimistic Renewables, (ii) Pessimistic Renewables, (iii) Fossil Shock, and (iv) Accelerated Nuclear. These scenarios reflect contrasting contexts in terms of technology costs, fossil fuel prices, and climate policies.The results identify natural gas prices, solar CAPEX, and discount rates (major economic impact) as critical parameters, along with carbon costs (decisive impact on emissions). Parametric variations lead to significant reallocations in the 2050 mix (up to 10–20 percentage points) and a wide range of economic and environmental outcomes.This approach confirms that the robustness of the system depends on technological diversification, strategic flexibility, and the explicit integration of risk into long-term energy planning.Table 3 presents a summary of the uncertainty analysis.
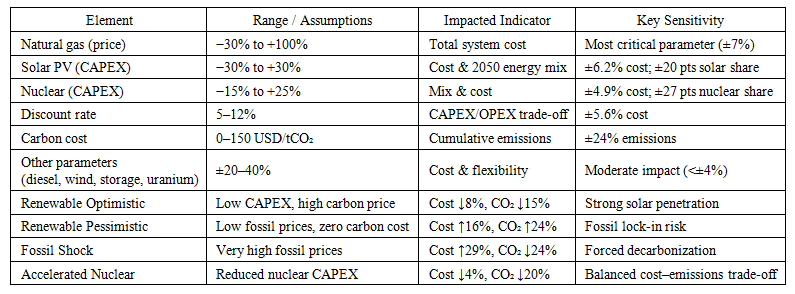 | Table 3. Summary of uncertainty analysis (2021–2050) [22], [23], [24], [25], [26] |
3. Results and Discussion
3.1. Trajectories of Installed Capacity and Supply-Demand Adequacy
- Figure 4 and 5 show the respective evolution of total installed capacity (MW) and electricity demand and total electricity production (GWh) according to the four prospective scenarios: Modest, Reference, Ambitious, and Without Nuclear for the period 2021-2050 for Niger's energy system.
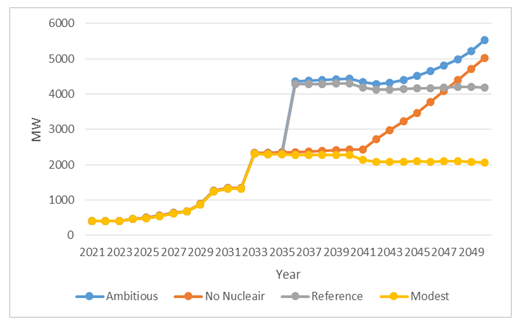 | Figure 4. Evolution of total installed capacity (MW) |
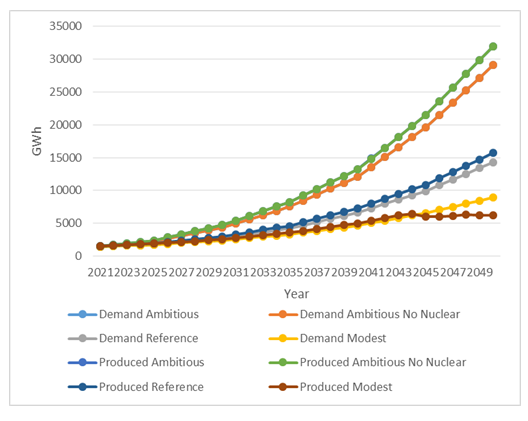 | Figure 5. Evolution of electricity demand and total electricity production (GWh) |
|
|
3.2. Analysis of Fictitious Fuel Prices for Different Electricity Zones
- The shadow price (or marginal price, also known as dual price or marginal cost) represents the marginal opportunity cost of electricity generation in each zone. It indicates the cost of generating an additional unit of electricity (kWh) at a given time, expressed in hundreds of US dollars per kWyr (US$'00/kWyr).Figure 6 shows the evolution of the shadow price by scenario.
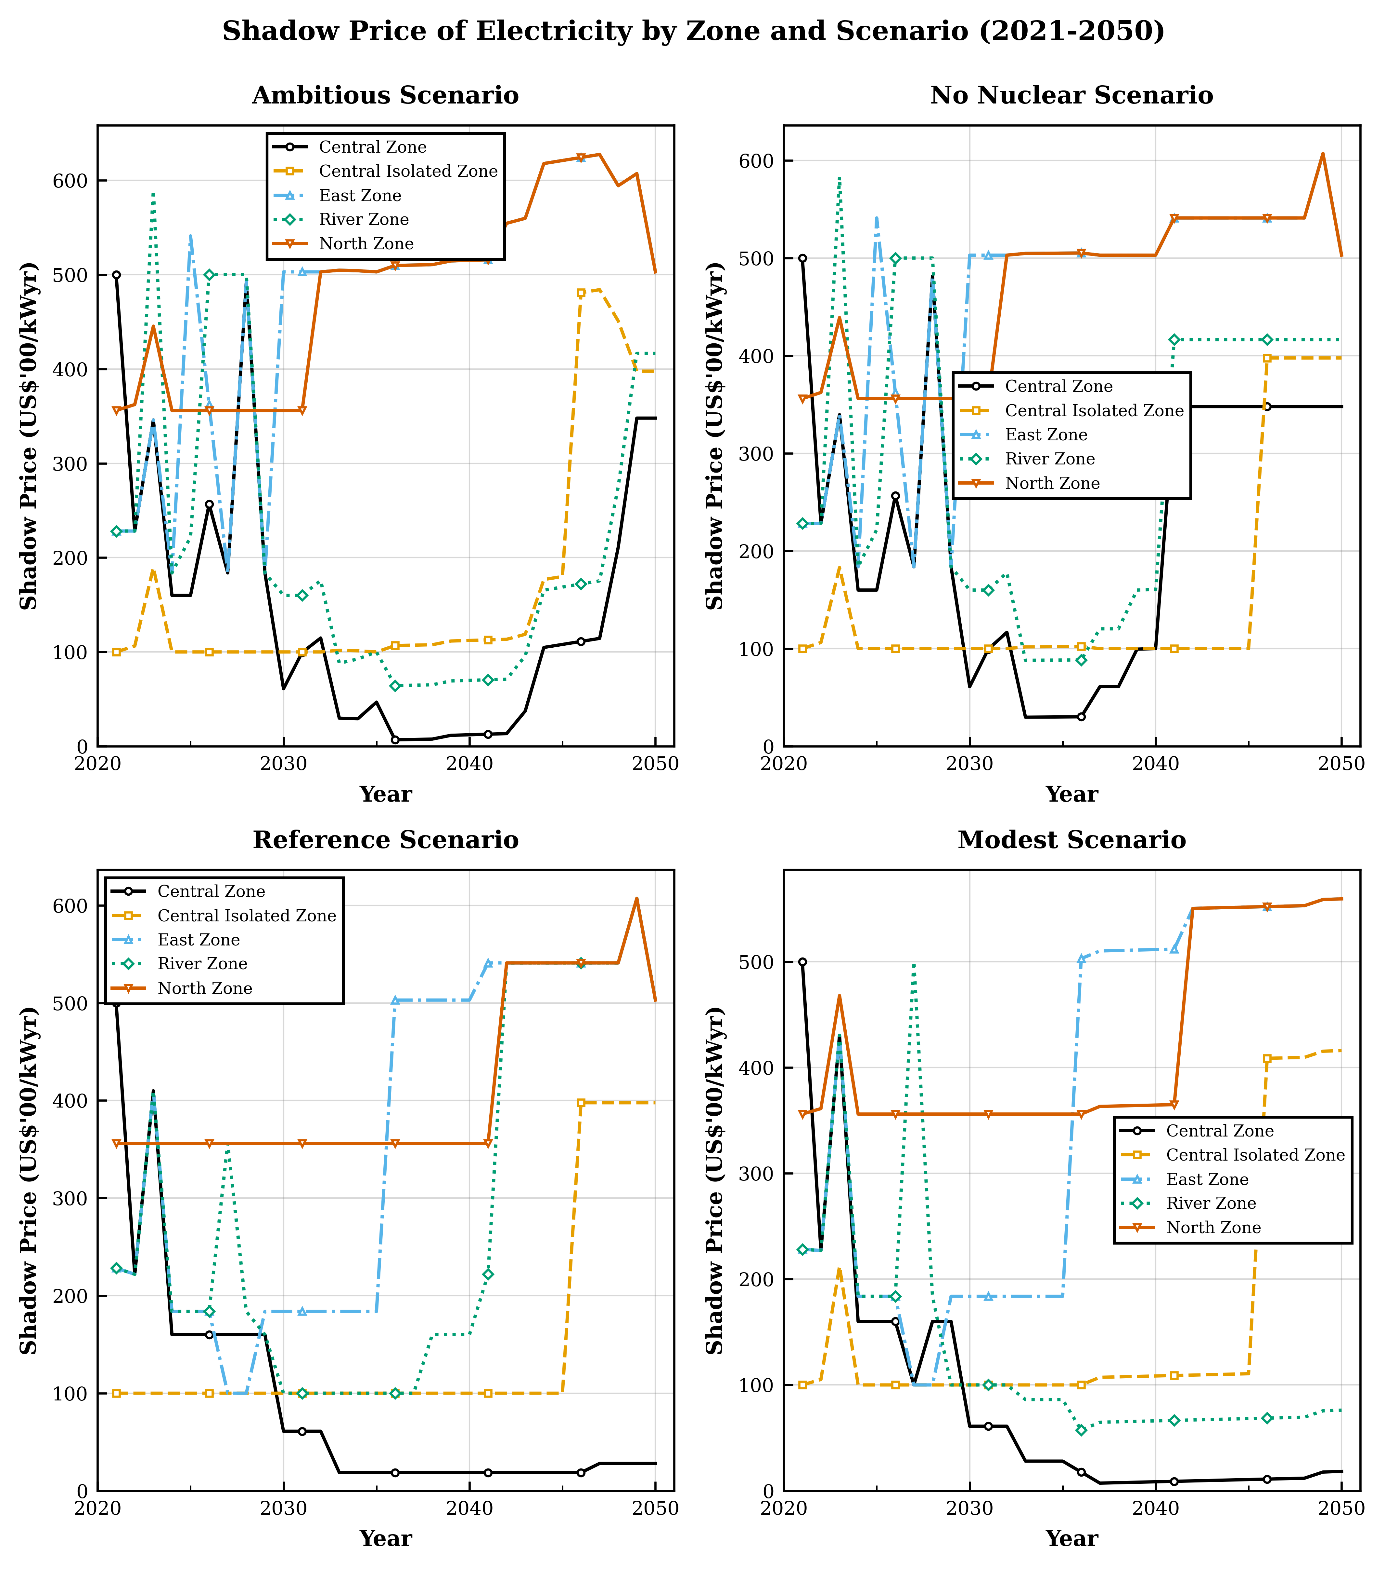 | Figure 6. Change in notional price by scenario |
3.3. Evolution of CO₂ Emissions
- Figure 7 shows the evolution of CO₂ emissions in the different scenarios from 2021 to 2050.
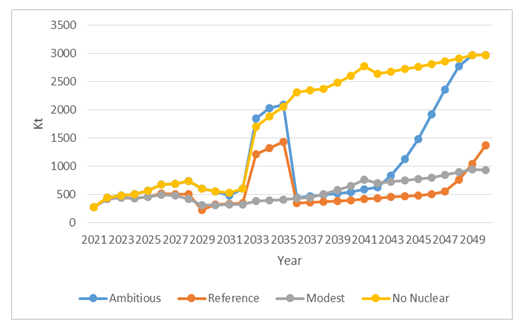 | Figure 7. Change in CO2 emissions by scenario from 2021 to 2050 |
3.4. Electricity Mix and Decarbonization Strategies
- The 2050 energy mixes reveal four distinct technological philosophies:Ambitious Scenario: the mix is balanced with Nuclear 32.9% (10,512 GWh), Solar 30.0% (9,563 GWh), and Coal 15.5% (4,950 GWh), creating a resilient architecture combining dispatchable baseload (55.6%) and intermittent renewables (35.1%). This diversification maximizes security of supply while enabling gradual decarbonization.Figure 8 shows the electricity mix for 2050 for the Ambitious scenario.
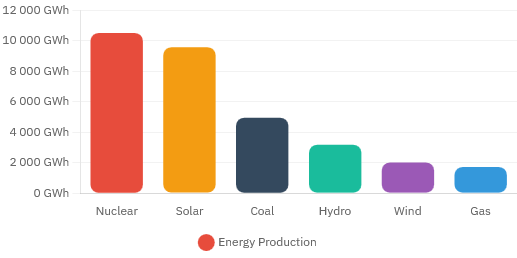 | Figure 8. Illustration of the electricity mix in 2050 for the Ambitious scenario |
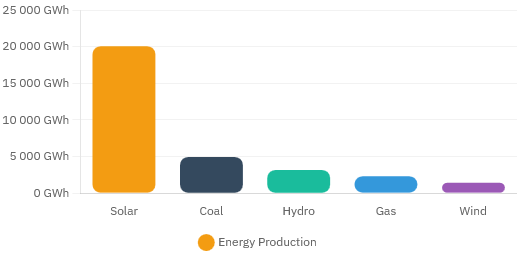 | Figure 9. Illustration of the electricity mix in 2050 for the nuclear-free scenario |
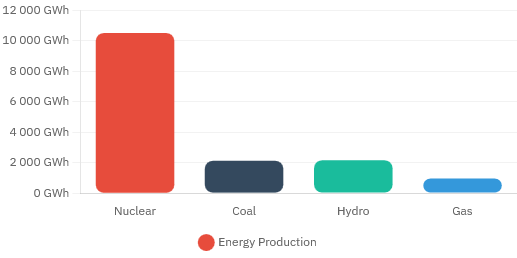 | Figure 10. Illustration of the electricity mix in 2050 for the Reference scenario |
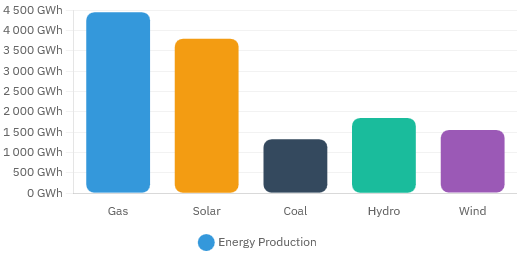 | Figure 11. Illustration of the electricity mix in 2050 for the Modest scenario |
3.5. Spatial Distribution and Territorial Imbalances
- Geographical analysis reveals critical territorial asymmetries in all scenarios except the Modest scenario. In 2050, the Central Zone accounts for 81-85% of national production (scenarios with nuclear power) compared to only 20% of demand, while the River Zone accounts for 70% of demand but only produces 10-16% locally, creating a structural dependency of 84.5% (Ambitious) to 91.1% (Reference) on inter-zone imports, notably the Center Zone-River Zone interconnection line.This center-periphery zone architecture requires massive transmission corridors: transporting 17-20 TWh annually over 300-800 km requires 2,000-2,500 MW of transmission capacity (investments of $600-1,200 million in high-voltage lines) with losses of 5-10% (1,000-2,000 GWh annually valued at $100-200 million). Failure of this single corridor would instantly paralyze 70% of the national economy, creating an unacceptable systemic risk unparalleled in modern energy systems.The Modest scenario presents an initial virtuous decentralization (River Zone 56.6% of production) but fails to maintain the necessary investments, with the national deficit of 30.8% concentrated exclusively in the River Zone (local deficit of 44.1%), affecting precisely the area that is home to 70% of the population and economic activity.All scenarios (except Modest) require urgent territorial rebalancing through the development of 2,000-3,000 MW in the River Zone by 2050 (costing USD 2.5 to 4.0 billion), reducing dependence on imports from 84-91% to a maximum of 50-60%. This rebalancing, combined with oversized transmission capacity (+30-50% redundancy) and a network mesh (3-4 independent paths), would drastically reduce systemic vulnerabilities while generating transmission savings of USD 1-2 billion over the life cycle.
3.6. Cost-Benefit Analysis and Strategic Recommendations
- The Ambitious Scenario is optimal for the balance between energy security (ratio 1.097), climate performance (25.8 Mt CO₂ cumulative), and technological resilience (diversification 7 sources, none exceeding 33%). Total estimated cost: $16-18 billion. Recommended if social/political acceptance of nuclear power is confirmed and international funding can be mobilized.Nuclear free Scenario: Technically viable but with additional climate and economic costs of $5.3-8.1 billion (climate 1.8-3.6 + integration 1.5-2.5 + replacement 2-3), potentially exceeding the initial savings of $8.25 billion (nuclear avoidance 12 - solar 3.75). Recommended only if: (1) political constraints make nuclear unacceptable, (2) international climate financing offsets the additional cost, (3) storage investments (USD 3-5 billion) are provisioned.Reference scenario: Economically optimal in the short term (19.5 Mtons CO₂, cost ~$14-15 billion) but suffering from five disqualifying strategic handicaps: technological rigidity (67% nuclear), carbon lock-in (1,375 Ktons in 2050), international obsolescence (0% solar), diesel inefficiency (930 GWh costing $230-370 million/year), inflexibility post-2050. Not recommended without the mandatory integration of 30-40% solar PV (additional investment of $5-7 billion).Modest scenario: Categorically rejected. The 30.8% deficit generates $1.4-2.8 billion in annual failure costs ($14-28 billion cumulative 2041-2050), exponentially exceeding the $5-7 billion in corrective investments required (cost/benefit ratio of 0.2-0.5). Empirically demonstrates that underinvestment in energy costs infinitely more than moderate overinvestment.Recommended optimal strategy: Hybrid mix of 1,000 MW nuclear (USD 6 billion) + 3,500-4,000 MW solar (USD 4.5-5 billion) + 2,000 MWh storage (USD 0.6 billion) = USD 11-12 billion, providing 53% dispatchable base + 47% renewables, balancing all criteria (security, climate, cost, resilience) and avoiding the extremes of pure scenarios. Projected cumulative emissions: 15-20 Mtons CO₂, stable production/demand ratio of 1.10, average cost of electricity $0.07-0.09/kWh.
3.7. Comparison with the Malian study on the Taoussa area (2020-2035)
- The Malian study on the Taoussa area (2020-2035) and the Niger study (2021-2050) both use the MESSAGE model but reveal contrasting approaches. The Malian case opts for a 100% renewable mix (hydroelectricity + solar PV) with annual growth of 8.13% to 12.56% depending on the scenario, maintaining a stable production/demand ratio of 1.02. PV capacity reaches 49.7 to 103.9 MW in 2035 depending on the scenario, while hydro peaks at 18.6 MW. Emissions avoided range from 942 to 1,520 ktons of CO₂ over the period [7].The Niger case explores more contrasting trajectories with installed capacities in 2050 ranging from 2,068 MW (Modest) to 5,533 MW (Ambitious). The Modest scenario presents a catastrophic deficit of 30.8% (2,755 GWh unserved) valued at USD 1.4-2.8 billion annually. The proposed optimal mix (1,000 MW nuclear + 3,500-4,000 MW solar + storage) would cost USD 11-12 billion for a 53% controllable/47% renewable balance, with cumulative emissions of 15-20 Mtons of CO₂.The comparison reveals that the Malian approach ensures perfect adequacy on a modest scale but does not include storage, failure cost analysis, or spatial dimensions. The generic case demonstrates that, on a large scale, the absence of controllable energy (nuclear) generates climate-related additional costs of USD 1.8-3.6 billion and integration costs of USD 1.5-2.5 billion, trade-offs not included in the Malian study.
3.8. Discussion of Results in Light of Niger's National Strategic Framework
- The results of modeling long-term energy scenarios must be interpreted in light of the ambitious political and strategic framework that Niger has set for itself. This perspective reveals encouraging convergences but also worrying discrepancies between the optimal trajectories identified and the reality of national commitments.The National Electricity Policy Document (DPNE) [19] sets a target of at least 850 MW of installed capacity by 2030, with 30% coming from renewable energies. Our scenarios, projected to 2050, show much higher capacities (2,068 to 5,533 MW), which is consistent with the longer time horizon. However, the Modest scenario (2,068 MW) already appears undersized compared to a simple extrapolation of the DPNE targets, and its 30.8% shortfall in 2050 disqualifies it as a viable option a result that confirms the relevance of the government's ambitious targets.The Nuclear-Free scenario, with 63% solar energy in 2050, far exceeds the 30% renewable energy target, while the Reference scenario (67% nuclear, 0% solar PV) directly contradicts it. The latter appears incompatible with the National Renewable Energy Strategy (SNER), which aims for 30% renewable energy by 2030, and with the Desert to Power initiative, which places solar energy at the heart of Sahelian development [27].The National Strategy for Access to Electricity (SNAE) [28] aims for universal coverage of the territory combining the grid (85%), mini-grids (5%), and individual systems (10%). Our results reveal a critical territorial asymmetry in all scenarios except the Modest scenario: the Central Zone accounts for 81-85% of production but only 20% of demand, while the River Zone (70% of demand) produces only 10-16% locally. This structural dependence on inter-zone imports of 84-91% contradicts the objective of balanced electrification of the territory and exposes the system to systemic risk (failure of the single corridor paralyzing 70% of the economy).Our spatial recommendations (2,000-3,000 MW in the River Zone by 2050 to reduce dependence to 50-60%) are in line with the logic of the PDAE but call for a massive acceleration of decentralized investments.Niger's Nationally Determined Contribution (NDC) [29] aims to reduce emissions by promoting renewable energy. Our scenarios show radically divergent cumulative emission trajectories: from 17.3 Mtons of CO₂ (Modest, but for much lower demand) to 61.8 Mtons of CO₂ for the No Nuclear scenario, and 25.8 Mtons for the Ambitious with Nuclear scenario.The climate differential of 36 Mtons CO₂ between the Ambitious with and without nuclear scenarios (valued at USD 1.8-3.6 billion) raises a crucial question that the national strategic framework does not address: how can the 30% renewable energy target be reconciled with the physical reality of a large-scale 100% renewable system? The Nuclear free scenario shows that a mix dominated by solar (63%) requires 32% fossil fuels for grid stability, maintaining structurally high emissions (2,312-2,970 Ktons over 2036-2050). This result directly challenges the SNER and the NDC commitments [29], [30].The DPNE and institutional reforms (ARSE, electricity code) [19] explicitly aim to attract independent private producers (IPP) and ensure the financial viability of the sector. Our results show that the recommended optimal scenario (a hybrid mix of 1,000 MW nuclear + 3,500-4,000 MW solar + storage) represents an investment of USD 11-12 billion for an average electricity cost of USD 0.07-0.09/kWh and a stable generation/demand ratio of 1.10.This balanced mix meets the requirements for project bankability: diversification of sources (none exceeding 33%), a controllable base of 53%, and competitive costs. It provides fertile ground for PPPs, which the new electricity code (pending since 2023) must secure.The guidelines of the International Renewable Energy Agency (IRENA) [30] emphasize the need to strengthen infrastructure resilience and integrate Sahelian specificities (panel cleaning, weather and energy forecasting). Our models incorporate these constraints through the analysis of fictitious prices and integration costs (estimated at USD 1.5-2.5 billion for storage and flexibility in the No Nuclear scenario). The development of electricity storage, identified as a priority in our recommendations, is in line with the concerns of the ECOWAS BEST project and the needs expressed by ANERSOL [31].Implications for national energy planningThree major lessons emerge for Nigerien decision-makers:First, the 30% renewable energy target must be re-examined in light of systemic constraints. While the Nuclear free scenario (63% solar) is technically feasible, it imposes additional costs related to climate (USD 1.8-3.6 billion), integration (USD 1.5-2.5 billion), and replacement (USD 2-3 billion) that could exceed the initial savings of USD 8.25 billion associated with avoiding nuclear power.Secondly, territorial balance must become an investment priority. The current concentration of production facilities in the Central Zone, while reflecting short-term economic logic, generates an unacceptable systemic risk in view of the universal electrification objectives of the Electricity Access Master Plan (PDAE). Rebalancing 2,000-3,000 MW in the River Zone (cost: $2.5-4.0 billion) is not an option but a strategic necessity.Thirdly, the optimal mix identified (1,000 MW nuclear + 3,500-4,000 MW solar + storage) offers a remarkable balance between security of supply (ratio of 1.10), climate performance (15-20 million tons of CO₂ cumulative) and economic viability (average cost of $0.07-0.09/kWh). This hybrid mix, with 53% controllable base load and 47% renewables, avoids the pitfalls of extreme scenarios while meeting the ambitions of the DPNE and the CDN. However, it requires an explicit political decision on the nuclear option a choice that the current strategic framework does not address, but which the reality of the orders of magnitude (36 Mt CO₂ differential) now makes it necessary to consider.General limitations of the study Despite its relevance, this study is subject to several limitations. The results are highly sensitive to assumptions about population and economic growth, as well as future changes in technology costs and fossil fuel prices. Niger's structural context, characterized by marked energy dependence on Nigeria and governance constraints, also affects the robustness of the conclusions. On a technical level, uncertainties remain regarding the large-scale integration of decentralized solutions and the development of regional interconnections. In addition, financial feasibility remains contingent on the ability to mobilize sufficient investment resources.
4. Conclusions
- This study establishes a long-term energy plan for Niger through 2050 using the IAEA's MESSAGE model to optimize electricity supply. Four prospective scenarios based on MAED's demand assessment were simulated: Ambitious, No Nuclear, Reference, and Modest. The results reveal divergent trajectories. The Ambitious and Nuclear free scenarios maintain satisfactory generation/demand ratios (1.09-1.10), while the Reference scenario shows a slightly tighter balance (1.08-1.09). In contrast, the Modest scenario collapses with a ratio of 0.692 in 2050, creating a structural deficit of 30.8% (2,755 GWh unserved). The climate analysis shows that the Nuclear free scenario generates the highest cumulative emissions (61.8 Mtons of CO₂ over 2021-2050), which is 3.2 times higher than the Reference scenario and 2.4 times higher than the Ambitious with Nuclear scenario. The Modest scenario, despite its high carbon intensity, limits its absolute emissions (17.3 Mtons CO₂) due to its low ambition. Economic analysis shows that the Ambitious scenario, although generating significant volatility, can achieve very competitive prices in certain zones (US$6.8/kWyr in the Central Zone in 2036). This scenario is the optimal option, striking a balance between energy security (ratio of 1.097), climate performance (25.8 Mtons of CO₂), and technological resilience (diversification across seven sources, none exceeding 33%). Its total estimated cost of US$16-18 billion makes it the most suitable strategy for ensuring sufficient energy coverage, supporting socio-economic growth, and committing the country to a sustainable transition. Future research should focus on adaptation to climate change in the Sahelian context, particularly the vulnerability of energy infrastructure and strategies for the resilience of Niger's electricity system in the face of increasing climate constraints.