International Journal of Energy Engineering

p-ISSN: 2163-1891    e-ISSN: 2163-1905

2025;  15(1): 14-23

doi:10.5923/j.ijee.20251501.02

Received: May 30, 2025; Accepted: Jun. 27, 2025; Published: Jul. 25, 2025


Energy Study of Gases Obtained by Gasification of Agroforestry Residues

Abdoulaye Hachi Alio1, Harouna Gado Ibrahim2, Doulla Seydou Nouhou1, Boukar Makinta1

1Department of Physics, Abdou Moumouni University, Niamey, Niger

2Department of Physics, Dan Dicko Dankoulodo University, Maradi, Niger

Correspondence to: Boukar Makinta, Department of Physics, Abdou Moumouni University, Niamey, Niger.

Email:

Copyright © 2025 The Author(s). Published by Scientific & Academic Publishing.

This work is licensed under the Creative Commons Attribution International License (CC BY).
http://creativecommons.org/licenses/by/4.0/

Abstract

Fossil fuels still dominate the global energy mix, while the use of these sources has harmful consequences for our environment. This requires a look at other, cleaner sources for the security of our planet. This is how biomass is perceived in Niger as one of the solutions for an energy transition with a significant agroforestry potential available for bioenergy. Hence the main objective of the present study, which focuses on the gasification of agroforestry residues. The gasifier used is of the co-current fixed bed type, and the three fuels used are peanut shell, Hyphaene thebaica shell and charcoal. The fuels were first characterized according to recommended standards and some correlations to estimate the higher calorific value. During the gasification, reduction temperatures were recorded, with averages ranging from 713.3°C for groundnut shell, 850°C for Hyphaene thebaica shell and 861°C for charcoal. The gases produced are well purified by the use of an exchanger. This is because the latter cools the gases to the point of optimal removal of impurities. Estimated gasification yields range from 60.7% for groundnut hull and 62.1% for Hyphaene thebaica hull and 37% for charcoal. The gasifier power varies respectively from 12.7 kWth for charcoal gasification, 38.6 kWth for the Hyphaene thebaica hull and 53.8 kWth for the peanut shell. These differences in results from one fuel to another are related to the different operating parameters and the characteristics of the fuels. The gas produced can be used directly as domestic gas to turn the shaft of a turbine.

Keywords: Gasification, Residues, Agroforestry, Co-current fixed bed, Peanut shell, Hull of Hyphaene thebaica, Charcoal

Cite this paper: Abdoulaye Hachi Alio, Harouna Gado Ibrahim, Doulla Seydou Nouhou, Boukar Makinta, Energy Study of Gases Obtained by Gasification of Agroforestry Residues, International Journal of Energy Engineering, Vol. 15 No. 1, 2025, pp. 14-23. doi: 10.5923/j.ijee.20251501.02.

1. Introduction

Global energy demand is currently growing by an average of 2% per year [1] and according to the IEA (International Energy Agency) report of 2022, this demand is based on a dominance of fossil fuels up to 80% [2]. While the use of these fossil sources contributes to the degradation of our planet and prevents developing countries from evolving because of their dependence on these sources. In addition, these energies are not renewable and their prices are constantly rising [3]. In addition, they are largely a source of greenhouse gas emissions that are at the origin of global warming, which massively disrupts ecosystems and threatens human societies [4].
In the case of Niger, final energy consumption estimated at 0.13 toe (ton oil equivalent) per capita in 2019 and is one of the lowest in the world (lower than the African average of 0.65 toe and the world average of 1.88 toe) [5]. This weakness could be explained mainly by a limited supply, very high population growth, a poorly developed industrial sector and very low purchasing power, and on the other hand by limited access of Nigerien households to modern energies because traditional biomass remains the first source of energy used to the tune of 80.65% [5].
Thus, in the face of these energy challenges, a synergy of alternatives is more than necessary, including the use of renewable energy sources, the improvement of energy efficiency, the reduction of greenhouse gas emissions and the promotion of the use of cleaner fuels; This is how biomass is perceived as one of the key solutions for the energy transition in Niger. Indeed, according to the FAO (Food and Agriculture Organization) in 2010, about 1204000 ha of Niger is forested, i.e. 1% of the national territory [6]. In addition, in a study carried out in 2011, it was reported that Niger recorded 2672 million tons of agricultural residues and that the use of 30% of these residues could make it possible to obtain a potential of 100MW [7]. Another study in 2020 reported that in Niger, on average over 10 years, the production of certain agricultural products dominated by millet followed by sorghum and groundnuts generated an estimated gross quantity of residues of 11,835,400 tons, of which 2,255,471 tons were available for bioenergy, i.e. 19% [8]. However, the production of residues of forest species such as Balanites aegyptiaca and Hyphaene thebaica amounts to 528580 tons and 17782 tons respectively, of which 88400 tons of these residues can be mobilized in bioenergy, i.e. 12.5% of the raw residues [8]. In view of the above, biomass (particularly agroforestry residues) can be an alternative source to support the use of LPG (Liquefied Petroleum Gas) gas as cooking gas in Niger.
Based on the energy potential in agricultural and forestry residues that Niger has and on the other hand on several studies carried out on the feasibility of valorizing the latter into biogas, the need arises to deal with this theme which would rule on an energy study of the gases obtained by gasification of agroforestry residues. This study aims first at the possibility of developing a gasification system for agroforestry residues and secondly at the evaluation of the energy quality of agroforestry residues.

2. Material and Methods

2.1. Material

2.1.1. Gasifier
The gasifier of the study is a co-current fixed-bed gasifier installed on the site of the Dan Dicko Dankoulodo University of Maradi. This system is made up of four (04) main parts (Figures 1 and 2):
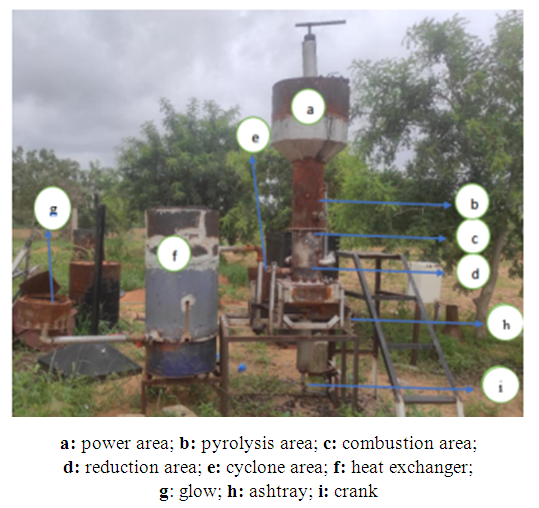
Figure 1. Study design
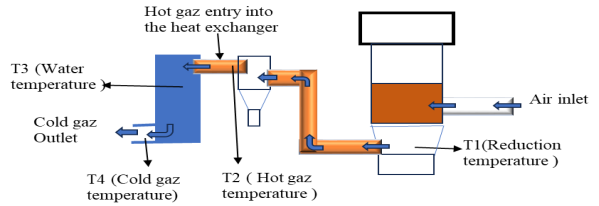
Figure 2. Schematic of the device
Ø Biomass feeding part: this is the upper part of the device at which the biomass is introduced into the device. This part consists of a flange through which the biomass is introduced into the device and a manual agitator that allows the biomass to descend into the combustion chamber.
Ø The biomass combustion and gas reduction zone: these two chambers are directly linked in a single block on the device. This part is directly coupled to the power supply part.
Ø Gas treatment part: this part starts as soon as the gas leaves the reduction chamber. It is made up of:
• A cyclone zone that allows the gas to deposit certain particles of impurities.
• A heat exchanger containing water that cools the gas and also captures certain impurities that escape the cyclone.
• Then a pipe that leaves the exchanger to send the gas cools to the flare where the gas is burned.
Ø A lower part (the ashtray) of the device that allows the evacuation of ashes.
2.1.2. Material for Immediate Analysis
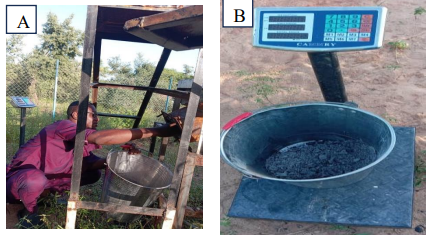
The immediate analysis was carried out at the physics laboratory level of the Faculty of Science and Technology of the Dan Dicko Dankoulodo University of Maradi. It consists of determining the moisture content, ash content, volatile matter content and fixed carbon level in the biomass. The main devices used are, among others:
Ø A 220g ± 0.1mg capacity scale was used to measure the masses of the samples analyzed;
Ø An oven to dry the biomass;
Ø A RESISTANCE FURNACA brand furnace which was used to determine the level of ash and volatile matter;
2.1.3. Fuels
The different fuels used in this study are groundnut shell, Hyphaene thebaica shell and charcoal (Figure 3). All these biomasses are dry and they were found at dealers in the city of Maradi.
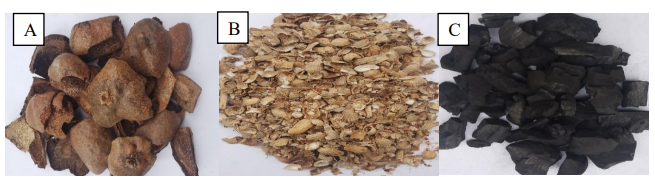
Figure 3. (A) Hyphaene thebaica shell, (B) Peanut shell, (C) Charcoal

2.2. Methods

2.2.1. Gasification Methodology
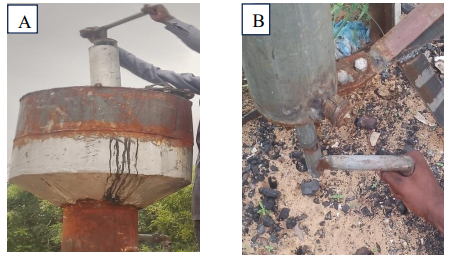
The methodology suitable for gasification tests is structured in different steps which are detailed below: The first gasification step is the loading of biomass into the gasifier. The biomass is first weighed and then introduced into the device through the flange at the top (Figure 4).
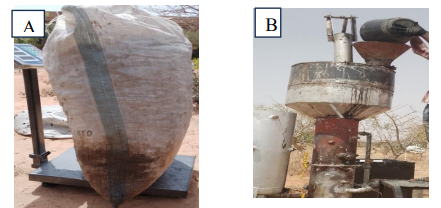
Figure 4. (A) biomass weighing, (B) biomass loading
Once the loading is finished, the temperature acquisition device (TESTO 176T4) is coupled to the four thermocouples that take the temperatures of the reduction zone (T1), the inlet of the gas in the exchanger (T2), that of the water in the exchanger (T3) and the outlet of the gas in the exchanger (T4). After plugging in, the next step is to turn on the device. Ignition is done by setting fire to the gasifier and then starting the fan (Figure 5).
Figure 5. Ignition of the gasifier
After the device is switched on, the temperature evolution of the reduction zone (T1) is monitored. Once the temperature exceeds 300°C, the flammability test of the gas is carried out at the flare (Figure 6). The time of onset of inflammation is noted.
Figure 6. (A) non-flammable gas; (B) Flammable gas
From the flammability time, the reaction chamber is supplied with fuel every 10 minutes for peanut and Hyphaene thebaica shells and every 15 minutes for charcoal by shaking the axis at the top (Figure 7A). The ash is evacuated every 20 minutes for peanut and Hyphaene thebaica shells and 30 minutes for charcoal by shaking the crank at the bottom of the device (Figure 7B).
Figure 7. (A) reactor feed, (B) ash removal
The end of gasification is marked by the flame stopping at the flare. At the moment we stop the blower and note the time. Immediately after the blower is stopped, the temperature logger (TESTO176T4) is disconnected from the device and connected to the software to stop the measurement and retrieve the data. After at least one day of the test, at this moment the device is cooled, the ash and the cyclone part are opened to collect the residues which will also be weighed (Figure 8).
Figure 8. (A) residues disposal, (B) Residue weighing
2.2.2. Fuel Characterization Methodology
Characterization consists of making an immediate analysis of the fuels by determining the contents of moisture, volatile matter, ash and fixed carbon and estimating the calorific value of the fuels based on the results of the immediate analysis.
2.2.2.1. The Moisture Content
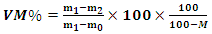
The moisture content of biomass is determined using EN 14774-3:2009 [9]. The procedure is that of first weighing the mass m0 (of the vacuum crucible), then a mass of sample is transferred to the crucible, then the mass m1 (of the crucible + the sample before drying) is weighed. The crucible that contains the sample is then placed in the oven and then set the temperature of the oven to 105°C until a constant mass is obtained. At the exit of the oven, the crucible is placed in the desiccant for 15 minutes and then the new mass m2 (crucible + the dehydrated sample) is weighed. Thus, the moisture content (in percentage) is calculated by the following relationship:
(1)
2.2.2.2. The Ash Content
The ash content is determined using EN 14775:2009 [10]. The test portions must be at least 1 g. The mass of the empty crucible and the mass of the crucible + sample are weighed respectively m0 and m1. Then the mass m1 is placed in the furnace at room temperature, then this temperature is set to 250°C. This temperature is maintained for 60 minutes to allow volatile substances to leave the sample prior to inflammation. Then it is still raised to (550 ±10) °C and maintained for 2 hours. After heating, the crucible is allowed to cool to room temperature and then transferred to the desiccant. The new mass m2 (of the crucible + the ashes) is weighed. Thus, the rate of ash on a dry basis is determined by the following relationship:
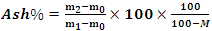
(2)
2.2.2.3. Volatile Matter Content
The level of volatile matter in the biomass is determined using the muffle furnace in accordance with EN 15148:2009 [11]. The procedure consists of weighing the 2 masses m0 (crucible + lid) and m1 (crucible + lid + sample before heating) then introduce m1 into the furnace at a temperature of 900°C ± 20°C for a time of 7 minutes. When it comes out of the furnace, the new mass m2 (crucible + lid + contents after heating) are weighed. The volatile matter content of the sample, expressed as a percentage by mass, is given by the following relationship:
(3)
2.2.2.4. Fixed Carbon Content
The quantity of carbon remaining after the removal of moisture, volatile matter and ash is deducted according to the formula:
(4)
2.2.2.5. Calorific Value
In the present study, the higher calorific values (HCV) of the two biomasses were estimated using equation (5):
(5)
For charcoal, the correlation used is as follows:
(6)
2.2.3. Gasifier Performance
This part consists of estimating the energy of the gas produced and the performance of the gasifier. To do this, it is necessary to know the net hourly consumption of the device, the biomass conversion rate, the energy available in the fuel.
2.2.3.1. Duration of Gasification
The duration of the gasification is the interval between the flammability test and the time when the flame has stopped.
2.2.3.2. Net Consumption
The Net Consumption (Cnet) is the difference between the mass of the fuel introduced and the mass of the residues collected after gasification.
(7)
2.2.3.3. Hourly Consumption
This consumption is determined by the ratio of the mass of fuel consumed to the gasification time. The expression is given by the relation (8):
(8)
2.2.3.4. Net Hourly Consumption
This quantity is determined by the ratio between the net consumption and the duration of gasification. It is denoted HCnet and given by the relation (9).
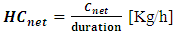
(9)
2.2.3.5. Fuel Energy
It is the energy contained in the fuel introduced into the gasifier. It is given by the relation (10).
(10)
2.2.3.6. Fuel Conversion Rate
It is the mass fraction of fuel converted at the end of gasification [28]. It is equal to:
(11)
2.2.3.7. Mass Yield
The mass yield is the mass fraction of the coal obtained at the end of gasification. It is obtained by the ratio between the mass of coal and the anhydrous mass of biomass introduced into the gasifier. It is determined by the relation (12).
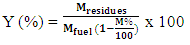
(12)
2.3.3.8. Net Energy
This is the amount of fuel energy consumed during gasification. It is obtained by the relation (13).
(13)
2.2.3.9. Gasification Efficiency
This efficiency is the ratio of the gas energy produced to the biomass energy consumed (net energy). It is given by the relation (14).
(14)
The energy of gas is calculated by the product between the energy efficiency of gas ηgas, the LCV of gas and the mass of the fuel consumed. Thus, it is expressed by the relation (15).
(15)
(16)
(17)
2.2.3.10. Thermal Power of the Gasifier
The thermal power of the device is calculated by the product of the specific gas production by the hourly consumption of the device.
(18)

3. Results and Discussion

3.1. Fuel Characterization

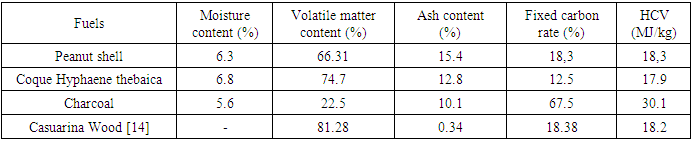
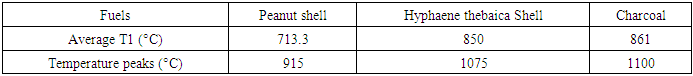
The fuel characteristics determined in this study are the parameters from the proximate analysis and the HCV. The results of this characterization are presented in Table 1:
Table 1. Fuel Characterization Results
     
These results first show that the moisture contents are slightly similar in the 3 fuels studied respectively 6,3% for the peanut shell 6.8% for the hull of Hyphaene thebaica and 5.6% for charcoal. In terms of volatile matter, we note that it is higher in the hull of Hyphaene thebaica (74.7%) than in the hull of groundnut and charcoal respectively 66,3% and 22,5%. The low volatility in the Charcoal is due to the fact that charcoal is already produced by a slow pyrolysis (carbonization) of wood. Indeed, some of this volatile matter is lost during this carbonization to improve its carbon content. This justifies a higher fixed carbon content in charcoal (67.5%) than in the two raw biomasses (18.3% and 12,5%). High volatile matter content in agricultural residues can promote biomass combustion at low temperatures [15], and when this content is low, it promotes the production of residues. The results of Fethya (2012) [16] came to the same conclusion. The ash contents for groundnut hull and Hyphaene thebaica hull are similar, 15.3% and 12.8%, respectively. These rates are very high compared to that of wood studied in the literature (Mahapatra et al. (2016), which was 0.34% [14]. Even if the 2 shells have almost the same calorific value as wood, based on their ash content, we can conclude that wood is more energetically interesting and more adaptive to the gasification process than the 2 shells studied. Because ash has undesirable effects in the gasifier such as clogging the air circuits and the passage of gas. This remark supports the idea of Chiang et al. (2012) who concluded that the ash content in agricultural waste causes agglomeration and corrosion during thermal conversion [17]. The same remark was made in the present study through the deformation of the ash evacuation grid.
The results of the HCV obtained show that charcoal has a higher HCV than those of hull peanut and Hyphaene thebaica hull respectively 30.1 MJ/kg against 18,3 MJ/kg and 17,9 MJ/kg. This difference is due to the high carbon content in charcoal, as charcoal has a very significant influence on the HCV [3].
For charcoal, the HCV of the present study (30.1 MJ/kg) is close to the results found by Joseph et al. (2020) [18], who found 28.85 MJ/kg, 30.02 MJ/kg and 32.51 MJ/kg for coals from the 3 different species. Based on findings from studies by Njenga et al. (2017) [19] and Joseph et al. (2020) [18], those Differences can be explained by the influence of charred tree species and also the mode of carbonization.

3.2. Gasification Test Results

3.2.1. Gasification Temperature Profiles (T1)
The temperature measured during gasification is the gas reduction temperature. Its profiles are presented by the curves in Figure 9. The letters A, B and C correspond respectively to the peanut shell, the hull of Hyphaene thebaica and charcoal.
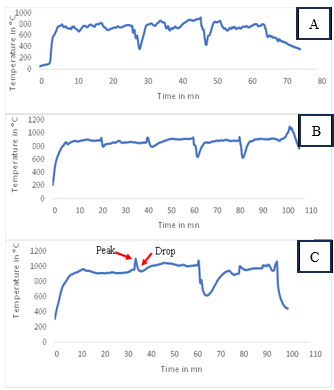
Figure 9. Evolution of the reduction temperature T1 (A) peanut shell; (B) Hyphaene thebaica shell; (C) charcoal
The temperature measured during gasification is the gas reduction temperature. Its profiles are presented by the curves in Figure 9. The letters A, B and C correspond respectively to the peanut shell, the hull of Hyphaene thebaica and charcoal. The temperature changes during gasification have almost the same appearance but with different temperature ranges. Curve A (peanut shell) evolves between 700°C and 800°C, B (Hyphaene thebaica hull) evolves between 800°C and 900°C with a peak of 1000°C towards the end and curve C (charcoal) its temperature range is between 800°C and 1000°C. On the three gaits, small peaks and drops in temperatures are observed almost every 20 minutes for the hulls and 30 minutes for the charcoal (see Figure 9C). These 2 phenomena occur respectively after evacuating the ash and feeding the reactor with fuel. The evacuation of ash leads to a increase in temperature, which is probably linked to the unclogging of the air circuits in the reactor. Hence the presence of small peaks on curves B and C. The drops in temperatures occur after powering the reactor just after the ash has been removed. The reactor bed, which has already been reduced following the evacuation of the ash, will further exchange its heat with the new fuel that arrives in the reactor. The heat available in the reactor that allows the new fuel to go through the drying and pyrolysis stages. This heat exchange leads to a drop in temperature at this time, hence the presence of falls. These temperature reductions due to biomass feeding have been observed in the Harouna et al. (2018) [20].
For peanut hull (figure 9A), the temperature drops are greater up to 400°C. These significant decreases are linked to the nature of the fuel. Its residues are not only smaller in size but also more friable than those of other fuels. When the grid is shaken, a lot of the residue can be evacuated. The new biomass that has descended finds a bed that has dropped significantly, and it dominates the rest of the hot tailings in the reactor. After heat exchange with this large quantity of the new biomass, the temperature drops sharply, sometimes until the flame stops at the flare. To do this, the characteristics of the grid must be reviewed to adapt to the characteristics of the peanut shell.
Based on the temperature development during gasification, the average at the level of each fuel is determined in Table 2.
Table 2. Average temperatures and reduction peaks
     
The average temperatures and peaks at the level of the hull of Hyphaene thebaica and charcoal are close, while they are low with the peanut shell. This large difference with the peanut shell at the average level can be explained by the large drops observed during the feeding of biomass to the reactor. These falls had a significant effect on the average.
Beyond average temperatures, the A, B and C points show that charcoal has a higher peak (about 1100°C) compared to the hull of Hyphaene thebaica and the peanut shell which have 1075°C and 915°C respectively. But these peaks can be undesirable for the device, as it can reach the melting temperature of the ash. According to Iwunze, (2021), the ash melting temperatures in the co-current fixed-bed gasifier are below 1250°C [21]. This melting was observed during a test with the peanut shell which reached a peak of 1031°C. This experiment shows that the peanut shell has a lower ash melting temperature than that of the Hyphaene thebaica shell and charcoal. This leads to the conclusion that high temperatures are not often favorable for the carbonation of groundnut shells. Figure 10 illustrates the image of the fused ash collected.
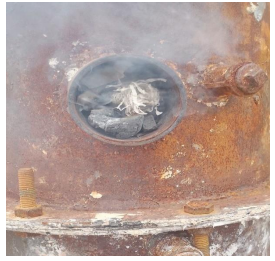
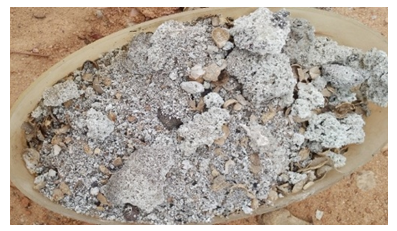
Figure 10. Ashes obtained from peanut shells
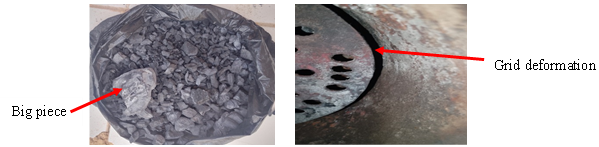
3.2.2. Operating Conditions for Gasification Tests
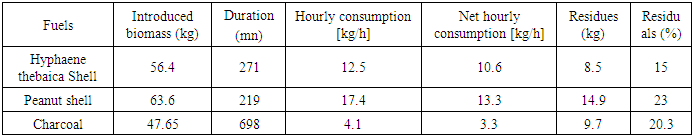
This section summarizes the information gathered during the 9 gasification tests. This information is summarized in Table 3.
Table 3. Summary of gasification tests
     
The results in Table 3 show that the gasifier has a higher hourly consumption with the peanut shell than with the hull of Hyphaene thebaica respectively 17.4 kg/h and 12.5 kg/h, a difference of 4.9 kg/h. But for the net hourly consumption, the difference is 2.7 kg/h. The peanut shell has a higher than the Hyphaene thebaica Shell with respectively 23% and 15%. The formation of the residues is proportional to the hourly consumption of the device on the fuel. The lower the hourly consumption, the longer the residence time of the fuels and the less formation of residues. Consequently, the peanut shell has a limited stay in the gasifier compared to the hull of Hyphaene thebaica, which explains its high residue content. To this end, the residence time acts on the biomass conversion rate. The studies of Fethya (2022) [16] have arrived at the same results. Also, the hull of Hyphaene thebaica has a higher reduction temperature than the peanut shell 850°C against 713.3°C. The coals (residues) are burned at high temperatures. This formation of residues in groundnut hulls can also be explained by its low volatile matter content compared to that of Hyphaene thebaica but also to its higher ash content.
Charcoal has a lower hourly consumption than the two hulls (4.1 kg/h), which corresponds to a longer residence time than the hulls. However, the latter has a higher residue rate (20.3%) than the hull of Hyphaene thebaica, although its reduction temperature remains dominant (861°C).
This significant deposition of residues in charcoal can be explained on the one hand by the time it takes to evacuate ash (30 minutes), which is insufficient, and on the other hand by the deformation of the grate. The effect of these two parameters was observed on the rate of residues collected after gasification. This is justified by the residues collected after gasification which contain large pieces that are not converted. Figure 11 illustrates this fact.
Figure 11. Charcoal residues and ash disposal grate
3.2.3. Gas Cooling
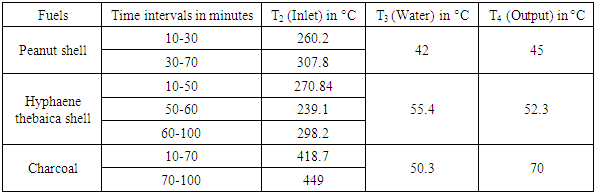
This section will focus on the treatment of the gas at the exchanger, in particular its cooling for later use. The aim is to monitor the evolution of the gas temperatures at the inlet (T2) and outlet of the exchanger (T4) and that of the water in the exchanger (T3). These gaits are shown in Figure 12.
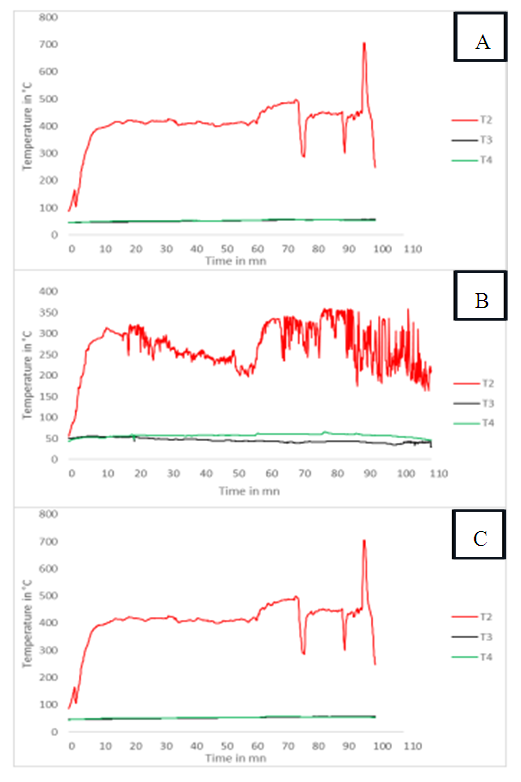
Figure 12. Temperature evolution T2, T3, T4: (A) peanut shell; (B) Hyphaene thebaica shell; (C) charcoal
The presence of the exchanger in the present study allows the cooling of the gas as indicated by the temperature profiles. In view of the different temperature fluctuations on the temperature curves at the inlet of the exchanger, the moving averages are determined to simplify the reading of the curves. For the water and the temperatures at the outlet of the gas from the exchanger, arithmetic averages have been made because the variations are not significant. These averages are presented in Table 4.
Table 4. Average temperatures T2, T3 and T4
     
Reading Table 4 tells us that the gas arrives in the exchanger at an average temperature of between 239.1°C and 449°C depending on the fuel and leaves the exchanger at a low temperature of between 45°C and 70°C. These results are close to those found by Solofoniaina (2009) which are 230°C before cooling and 45°C after cooling [3] and close to those of Mahadzir and Hefni (2018), with an inlet temperature between 300°C and 500°C and an outlet temperature between 39.1°C and 43.5°C respectively [15].
The need to cool the gas is related to its purification for proper use in engines. According to Richard (2020), a decrease in the temperature of the syngas below 100°C leads to the condensation of the tars [22]. In the same vein, the work of Reed and Das (1988) states that tars are removed at average temperatures below 100°C, and water is removed at temperatures between 30°C and 60°C [23]. So, the gas is dry at the exit of the exchanger and without tar. For illustrative purposes, Figure 13 shows of the Condensed tar and water at the bottom of the interchange.
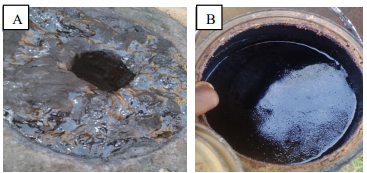
Figure 13. (A): tar (B): condensed water

3.3. Device Performance Estimation

The main performance points targeted in these parts are the power of the device, the mass yields and the gasification yields.
Table 5 provides an estimated overview of the performance elements of the gasifier.
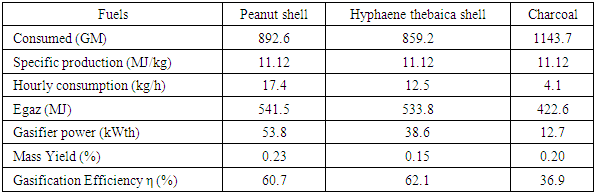
Table 5. Estimation of gasification performance
     
The specific production was estimated using the ratios found in the literature. indeed, according to studies conducted by Ramalingam et al., (2019) [24] et Olgun et al., [25] the average gas production in a competing fixed-bed gasifier is between 2.78 Nm3/kg and 2.86 Nm3/kg of biomass with a gas caloric value of between 4 MJ/Nm3 and 5.3MJ/Nm3. For the present study, the minimum values are used for the estimation of gas energy. That is to say a gas production of 2.78Nm3/kg with an LCV of 4 MJ/Nm3, which is equivalent to a specific production of 11.12 MJ/kg of biomass.
The results in Table 5 show that Hyphaene thebaica hull and groundnut hull have almost similar energy yields 62.1% and 60.7%. The slight difference observed may be linked to the influence of the various parameters mentioned above, including the reduction temperature, the residence time in the reactor and the ash content, which affect the quality of the gas produced. These same differences are found in the work of Saidou (2013) on rice husk, which was 66.9%, and 74.8%, who also concluded that the difference is related to the property of the gas [26].
The results show that charcoal has a lower gasification yield than the 2 shells. This low efficiency in the gasification of charcoal (36.9%) may be linked to the nature of the oxidizing agent, which is air. Charcoal gasification is more interesting with water vapor than with oxygen because, according to Mermoud (2006), among coal gasification reactions, the steam reaction is the most preponderant, with kinetics 2 to 5 times faster than that of gasification with CO2 [27]. These same results were found in the studies of Harouna et al. (2018) on stem gasification of raw cotton and Stems of raw carbonized cotton, the results of which were respectively 58.7% for raw stalks and 46.5% for charred stalks [20].
The power of the device is greater when gasifying the peanut shell (53.8 kWth) than for the Hyphaene thebaica shell (38.6 kWth) and charcoal (12.7 kWth). These power variations are linked to the hourly consumption of each fuel. The higher the hourly consumption, the greater the power of the device.
These results show that the performance of the device varies from one fuel to another depending on the properties of the gasified fuel.

4. Conclusions

Our work focuses on the thermochemical route through gasification to valorize agroforestry residues. The available gasification product is a syngas typically composed of CO, H2, CH4 in small quantities and tar which is undesirable, but their proportions depend on the operating parameters and the characteristics of the biomass.
For the specific case of the present study, the carbonated residues are peanut hull and Hyphaene thebaica husk and charcoal. Gasification was carried out using the co-current fixed-bed gasifier.
The two shells studied have significant energy potentials with 18.3MJ/kg for the peanut shell, 17.9MJ/kg for the Hyphaene thebaica shell, but charcoal is more energetic with 30.9MJ/kg. Gasification temperatures Gasification tests are more important with coal and the hull of Hyphaene thebaica than with peanut hull with averages of 861°C, 850°C and 713.3°C respectively. The gases produced are well purified thanks to an efficient response of the exchanger. This is because the latter cools the gases to the point of optimal removal of impurities.
The gasifier has gasification efficiencies estimated at 62.1% for the gasification of the Hyphaene thebaica hull and 60.7% for the peanut shell and 37% for the coal, respectively. So, the gasifier is more efficient for the gasification of the hull of Hyphaene thebaica and the hull of peanut compared to charcoal which has a low yield. These variations are related to the reactions present at the level of gas reduction.
The gasifier power varies respectively from 12.7 kWth for charcoal gasification, 38.6 kWth for the Hyphaene thebaica hull and 53.8 kWth for the peanut shell.
The variation in power is due to the hourly consumption of each fuel.
The operation of the device and the characteristics of the fuels affect the residue levels after gasification. The study also showed that groundnut hull has a higher residue rate (23%) compared to 15% for Hyphaene thebaica hull, 20.3% for charcoal.

References

[1]  Association négaWatt, «Reussir la transition énergetique». 2016. Consulté le: 4 novembre 2023. [En ligne]. Disponible sur: https://negawatt.org/Contexte-et-enjeux.
[2]  AIE, «World Energy Outlook 2022», 2022. Consulté le: 13 avril 2025. [En ligne]. Disponible sur: https://www.iea.org/reports/world-energy-outlook-2022/executive-summary?language=fr.
[3]  R. Solofoniaina, «VALORISATION DE LA BIOMASSE POUR PRODUIRE DE L’ELECTRICITE PAR GAZEIFICATION DE LA REGION D’ALAOTRA MANGORO», 2009.
[4]  Youmatter, «Energies-fossiles, definition, exemples, histoire et enjeux géographiqueset écologiques». 14 avril 2023. [En ligne]. Disponible sur: https://www.google.com/url?q=https://youmatter.world/fr/definition/energies -fossiles-definition-exemples-histoire-reserves/d=.
[5]  «Premier Rapport Biennal Actualisé du Niger», Niger, 2022. [En ligne]. Disponible sur: https://unfccc.int/sites/default/files/resource/RIN_BUR-2022_VF%2011-07-2022%20FINAL.pdf.
[6]  «Information et données sur les forets au Niger», 2010. Consulté le: 13 avril 2025. [En ligne]. Disponible sur: https://worldrainforests-com.translate.goog/deforestation/2000/Niger.htm?_x_tr_sl=en&_x_tr_tl=fr&_x_tr _hl=fr&_x_tr_pto=rq#:~:text=According%20to%20the%20U.N.,148%2C000%20ha%20of%20planted%20 forest.
[7]  S. Dasappa, «Potential of biomass energy for electricity generation in sub-Saharan Africa», Energy Sustain. Dev., vol. 15, n° 3, p. 203-213, sept. 2011, doi: 10.1016/j.esd.2011.07.006.
[8]  M. T. G. Mahamadou, «Thème: Evaluation du potentiel énergétique des résidus agricoles au Niger et Essai préliminaire de gazéification», 2020.
[9]  EN 14774-3, «Solid biofuels – Methods for the determination of moisture content – Oven dry method – Part 3: Moisture in general analysis sample». 2009.
[10]  EN 14775, «Solid biofuels - Method for the determination of ash content». 2009.
[11]  EN 15148, «Solid biofuels - Methods for the determination of the content of volatile matter». 2009.
[12]  A. Adekiigbe, «Determination of Heating Value of Five Economic Trees Residue as a Fuel for Biomass Heating System», Nat. Sci., n° 10(10), p. 26-29, 2012.
[13]  D. R. Nhuchhen et P. Abdul Salam, «Estimation of higher heating value of biomass from proximate analysis: A new approach», Fuel, vol. 99, p. 55-63, sept. 2012, doi: 10.1016/j.fuel.2012.04.015.
[14]  S. Mahapatra, S. Kumar, et S. Dasappa, «Gasification of wood particles in a co-current packed bed: Experiments and model analysis», Fuel Process. Technol., vol. 145, p. 76‑89, mai 2016, doi: 10.1016/j.fuproc.2016.01.032.
[15]  M. M. Mahadzir et M. Hefni, «The Design and Fabrication Heat Exchanger for Small Downdraft Gasifier in UiTM Pulau Pinang», 2018.
[16]  S. Fethya, «Conception et expérimentation d’un gazéificateur pour le traitement thermique des déchets organiques», 2022.
[17]  K.-Y. Chiang, K.-L. Chien, et C.-H. Lu, «Characterization and comparison of biomass produced from various sources: Suggestions for selection of pretreatment technologies in biomass-to-energy», Appl. Energy, vol. 100, p. 164-171, déc. 2012, doi: 10.1016/j.apenergy.2012.06.063.
[18]  Z. M. Joseph et al., «Carbonization techniques and wood species influence quality attributes of charcoals produced from industrial sawmill residues in Eastern Cameroon», BOIS FORETS Trop., vol. 345, p. 65-74, oct. 2020, doi: 10.19182/bft2020.345.a31831.
[19]  M. Njenga et al., «Quality of charcoal produced using micro gasification and how the new cook stove works in rural Kenya», Environ. Res. Lett., vol. 12, n° 9, p. 095001, sept. 2016, doi: 10.1088/1748-9326/aa7499.
[20]  G. I. Harouna, S. Oumar, K. O. Salifou, D. Tizane, et K. Jean, «Impact of pre-treatment by torrefaction and carbonization on temperature field, energy efficiency and tar content during the gasification of cotton stalks», J. Eng. Technol. Res., vol. 10, n° 2, p. 7-18, mai 2018, doi: 10.5897/JETR2018.0636.
[21]  P. Iwunze, «Benchmarking et selection des technologies de pyrolyse et de gazéification adaptées à la valorisation des CSR et du Bois-B sous forme du gaz», 2021.
[22]  C. H. Richard, «Modelisation et validation experimentale de la production de syngaz par gazeification des matieres residuelles», 2020.
[23]  T. B. Reed et A. Das, «Handbook of biomass downdraft gasifier engine systems», SERI/SP-271-3022, 5206099, mars 1988. doi: 10.2172/5206099.
[24]  S. Ramalingam, B. Rajendiran, et S. Subramiyan, «Recent advances in the performance of Co-Current gasification technology: A review», Int. J. Hydrog. Energy, vol. 45, n° 1, p. 230-262, janv. 2020, doi: 10.1016/j.ijhydene.2019.10.185.
[25]  H. Olgun, S. Ozdogan, et G. Yinesor, «Results with a bench scale downdraft biomass gasifier for agricultural and forestry residues», Biomass Bioenergy, vol. 35, n° 1, p. 572‑580, janv. 2011, doi: 10.1016/j.biombioe.2010.10.028.
[26]  A. L. Saidou, «Caractérisation des performances de l’unité pilote de la gazéification de biomasse», 2013.
[27]  F. Mermoud, «Gazéification de charbon de bois à la vapeur d’eau: de la particule isolée au lit fixe continu», 2006.