-
Paper Information
- Paper Submission
-
Journal Information
- About This Journal
- Editorial Board
- Current Issue
- Archive
- Author Guidelines
- Contact Us
International Journal of Energy Engineering
p-ISSN: 2163-1891 e-ISSN: 2163-1905
2025; 15(1): 1-13
doi:10.5923/j.ijee.20251501.01
Received: May 5, 2025; Accepted: Jun. 2, 2025; Published: Jul. 3, 2025

Economic and Environmental Sustainability for BRT Systems: A Comparative Analysis of Electric and Diesel Buses Based on Comprehensive LCC Model
 Abstract
 Reference
 Full-Text PDF
 Full-text HTML
Erick P. Massami
Faculty of Maritime and Petroleum Technology, National Institute of Transport, Dar es Salaam, Tanzania
Correspondence to: Erick P. Massami, Faculty of Maritime and Petroleum Technology, National Institute of Transport, Dar es Salaam, Tanzania.
| Email: |  |
Copyright © 2025 The Author(s). Published by Scientific & Academic Publishing.
This work is licensed under the Creative Commons Attribution International License (CC BY).
http://creativecommons.org/licenses/by/4.0/

The provision of green public transport services is vital for enhancing the socio-economic development of any country. In support of environmentally sustainable public transport, a number of cities including Dar es Salaam city, have deployed Bus Rapid Transit (BRT) systems. Nevertheless, most of the BRT buses in developing countries are powered by diesel fuel which poses a potential environmental damage through the emission of Greenhouse Gases (GHGs) and Criteria Air Pollutants (CAPs). To curb the problem of emission of GHGs and CAPs, electrification of BRT buses is proposed. Ironically, the high investment cost of the bus, battery and charging infrastructure makes electric buses unattractive for transit agencies. This study explores the economic and environmental cost of using Battery Electric Buses (BEB) for BRT in Dar es Salaam City. The in-depth comparative analysis of a 12m BEB and a 12m diesel bus is carried out by the application of the Comprehensive Life Cycle Cost (CLCC) model based on the Present Worth (PW) to find out the feasibility of switching from diesel buses to electric buses. The CLCC model considers the external costs of local pollutants and uses the data collected from the local transit agency and other similar studies conducted globally. The computational results reveal that the CLCC over the investment cycle of 8 years is 17.54% less than that of the diesel bus. More specifically, if emissions associated with lubricants and GHGs were modelled, the CLCC could be significantly lower than that of the diesel bus. Furthermore, BEBs are expected to become more attractive than diesel buses because the price of diesel fuel keeps increasing while the price of batteries is decreasing. Based on both the economic and environmental benefits, the future of electric buses for BRT systems is promising for most cities in the world.
Keywords: Economic Sustainability, Environmental Sustainability, Battery Electric Bus, Diesel Bus, Life Cycle Cost, Bus Rapid Transit
Cite this paper: Erick P. Massami, Economic and Environmental Sustainability for BRT Systems: A Comparative Analysis of Electric and Diesel Buses Based on Comprehensive LCC Model, International Journal of Energy Engineering, Vol. 15 No. 1, 2025, pp. 1-13. doi: 10.5923/j.ijee.20251501.01.
Article Outline
1. Introduction
- The provision of an effective and efficient transport service is vital for enhancing economic and social activities in any country. Transportation connects consumers and service providers by sea, air or road. However, the transportation of goods and/or passengers by road is the most efficient way when short distances are involved. In addition, sustainable road transportation is crucial for both current and incoming generations because it is safe, efficient, affordable, resilient, and acceptable especially when greenhouse gases and environmental damages are considered. Nonetheless, the transportation of goods and/or passengers is associated with the emission of about a quarter of global greenhouse gases (GHGs). Dasgupta et al. [1] explicate that the GHGs which include carbon monoxide, sulphur dioxide, nitrogen oxides, ozone, and fine particulates have notably undesirable effects on human health, animal health and vegetation. Specifically, a study undertaken by OECD [2] expounds that the damage costs resulting from deaths and illness caused by concentrated air pollutants in OECD countries in the year 2010 approximated USD 1.7 Trillion. The World Bank [3] approximates the damage from ozone and fine particulate to be 4.8% of GDP in East Asia, 3.5% of GDP in South Asia, 2.1% of GDP in the Middle East and North Africa, 1.6% of GDP in Latin America and 1.5% of GDP in Sub-Saharan Africa. Unfortunately, road transport accounts for about 50% of GHGs [4]. To reduce the negative effects of road transport public transportation is preferred in big cities. Hence, recent years have seen significant developments as most governments led by China, Europe and North America are moving towards the use of public transport. Wólek et al. [5] contend that the deployment of public transportation in a country is among of effective strategies to reduce environmental damage and improve sustainability and transport resilience. Public transportation enables mobility of many commuters at once thus reducing congestion and GHGs emissions. A number of cities in the world including Dar es Salaam have deployed BRT systems in order to improve the quality of urban mobility by reducing commuting times and enhancing accessibility of basic services. The BRT system has dedicated road lanes that cannot be used by vehicles other than large buses operated by BRT companies. It is a public transport system designed to improve capacity and reliability in congested cities. Also, BRT systems have been reported eco-friendly in terms of massive reduction of environmental emissions in cities of developing countries. The recent years have seen significant developments in BRT technology led by China, Europe and North America. Many cities are moving from conventional BRT technology to deployment of much cleaner technologies involving the use of biofuels, natural gas and electricity. To a large extent this move is attributed to increased awareness of climate change and concerns about local emissions, making diesel buses unattractive for public transport. Also, the finite fossil fuel reserves present uncertainties among major cities with regard to the long-term availability of diesel as a sustainable fuelling option.Currently, about 16 BRT systems are operating in Africa. Nine projects are in South Africa and others in Nigeria, Tanzania, Morocco, Senegal, and Egypt. In Tanzania, the Dar es Salaam Rapid Transit (DART) also known as UDA Rapid Transit (UDART) system began operations in 2016. Since then, UDART has operated a fleet of buses providing safe and reliable passenger transport to thousands of commuters. Today UDART has a fleet of 300 buses serving about 400,000 commuters daily [6]. So far, most of the BRT systems in Africa including UDART use diesel fuel posing a potential environmental damage through the emission of GHGs and CAPs. Glotz-Richter and Koch [7] argue that a single 18 metre bus takes about 40,000 litres of diesel per year, equivalent to 100 tons of carbon dioxide (CO2). To reduce the environmental damage from GHGs and CAPs, alternative fuels are proposed for BRT buses [8,9]. Although alternative fuels exist, electrification remains the most practical approach to combat urban air pollution [10,11]. The use of electric buses for sustainable public transportation is a contemporary agenda of cities, globally. Many cities of developed countries including United Kingdom, Germany, Norway, France, and Sweden are planning a total ban of fossil fuelled vehicles in exchange for electric buses. According to Zhang et al. [12], the electrification of public transport is a promising approach to reduce the emissions from GHGs. Similarly, ÓDea [13] elucidates that electric buses support measures taken globally to reduce climate change effects in contrast to diesel buses. Electric buses offer climate benefits, quiet operation, low maintenance cost, and good air quality to the local community due to zero-tail pipe emissions [14,15,16]. Despite the increased attention to zero emission buses, to date, BRT agencies in developing countries have purchased electric buses in small quantities. Various reasons are given to defend this position including higher upfront cost, operational issues, and unknown or new risks [17]. In Tanzania for example, the high initial cost of electric fuelled buses remains a barrier to overtaking diesel fuelled buses. Several studies have been conducted around the world to inform the decisions to implement electric BRT for urban transportation [7,10,12,18,19,20,21]. Du and Kammalapati [21] contend that many cities worldwide are promoting or planning to replace diesel buses with electric buses for public transportation in order to reduce and control air pollution in metropolitan areas. However, most studies have been conducted in developed countries and transition economies like China and India. In addition, the factors under consideration vary across studies and locations, leading to mixed results which justify specific and context based studies. For instance, Miraftabzadeh et al. [19] argue that electric buses are not consistently optimal solutions, diesel buses are more feasible options in some cases. Despite electric buses showing great potential to reduce emissions during their operational phase, the switching from diesel buses to electric buses would require in-depth analysis of their economic and environmental life cycle costs [20]. To know the feasibility of transformation from diesel buses to electric buses for BRT system in Dar es Salaam city, this study adopts CLCC model which compares the LCC of diesel and electric buses taking into account the cost of externalities. Although the environmental impacts and life cycle cost of electric buses have widely been investigated [8,22,23,24,25], there are still gaps in the existing literature on assessing the feasibility of switching from diesel buses to electric buses in Tanzanian cities. Currently, comparative studies on economic analysis and environmental impacts in Dar es Salaam city are non-existent. The aim is to promote a sustainable BRT system in Dar es Salaam and other cities of Africa, especially at a time when public transport is highly needed to improve human life on this earth. Dar es Salaam is the largest city in Tanzania with a remarkable population growth and it is expected to be the fifth largest city in Africa by 2030 [26]. The high population growth coupled with increased industrial and commercial activities demands more reliable, efficient and clean public transport services free from GHGs and CAPs. The paper is outlined as follows: Section 2 reviews relevant studies. The overview of CLCC model is presented in section 3. Application of CLCC model and results are presented in section 4. Lastly, section 5 provides concluding remarks.
2. Review of the Relevant Studies
- Scholars around the world, have proposed the use of electric buses in cities to curb the emission of GHGs from public transportation. An electric bus (EB) is a bus propelled by an electric motor and it can store the needed electric energy on board (e.g. battery electric buses) or be fed continuously from an external source (e.g. trolley bus). Several studies have been conducted focusing on the merits and demerits of electric buses. Kouridis and Vlachokostas [27] approximate environmental and social benefits related to the promotion of electric vehicle fleet. The results reveal that the use of electric vehicles saves more than EUR730 Million as a social benefit due to avoidance of particulate pollution. Aldenius et al. [28] explore the challenges and strategies for the implementation of electric buses in English and Swedish cities. The results reveal that passenger demand, route characteristics, and government support for financing and regulations have significant influence on the implementation of electric buses. The findings of this study are context based and hence not generalizable. Pelletier et al. [17] propose a fleet replacement model for organizations to meet their fleet electrification targets in a cost-effective way. Though the results cannot be generalized, the model gives insights into fleet transition from one bus technology to another. Gallet et al. [29] use real data sets in Singapore to model energy demand for electric buses. The findings reveal a discrepancy in energy requirements among bus routes and at different day times. Jakub et al. [14] examine the environmental impact of using electric buses in urban areas using the Polish city of Krakow as a case study. The findings reveal that the use of electric buses in urban areas is highly beneficial in terms of human health, ecosystem quality, and climate change provided the electricity is produced from low or zero-emission energy sources. Poɫom [30] reviews the development of electric public transport in Poland. The results show that the low energy density of batteries and the long recharging times is a significant barrier for the use of electric buses. Kubański [31] proposes the introduction of electric buses in public transport in the city of Czechonice-Dziedzice, Poland. The study shows a probable widespread use of electric buses in public transport. Manzolli et al. [32] review an extensive literature on electric bus studies. The examination show that potential studies on electric buses will be based on sustainability, energy management strategies, and fleet operation. Borėn et al. [33] test and verify the energy efficiency and silence of electric buses for deployment in public transport. Using eight Swedish municipalities, their findings prove that electric buses are preferable alternative for public transport. Regardless of their high cost and limited capacity of on-board batteries, researchers demonstrate the potentiality of BEBs.Several studies have been conducted to inform decisions to implement BEBs for urban transportation. Dirks et al. [15] use a Mixed Integer Programming (MIP) model to identify a cost-effective plan for integrating BEBs into urban bus networks in the city of Aachen, Germany. The analysis shows that the integration of BEBs is feasible and economically beneficial since it reduces the operator’s Total Cost of Ownership (TCO). Gorosabel et al. [34] evaluate the construction of electric bus charging station in Stockhalm city. The examination show that the efficiency of charging infrastructure is vital for the increase in supply of electric buses. The major pitfall of the study is the focus on only one cost component (i.e. charging infrastructure) of the LCC. Hjelkrem et al. [35] propose a strategic energy consumption model for BEBs using China and Norway as a case study. Their findings reveal that the model is able to predict the energy consumption on a trip level comparison. Ironically, the model cannot give insights on the LCC between diesel and electric buses for BRT. Du et al. [36] assess the technological development of battery electric buses in China. The findings depict that heavy-duty BEBs perform better than light-duty models. However, these results give little inputs with regard to the choice of diesel and electric buses for public transport services. Zhang et al. [37] propose an optimal strategy of short turning lines for the BEBs. The limitation of the undertaken study is that it is based on the operation of BEB system which can be altered depending on the prevailing circumstances. Zhang et al. [37] compare and analyse BEB charging approaches considering the levelized cost of electricity (LCOE) in Beijing. Despite of the findings that the use of BEBs promote the reduction of CO2 emissions, the major pitfall of the proposed study is the exclusion of other factors which influence the LCC. Lee et al. [38] present an optimization framework which determines the electric bus fleet size, the battery capacity, and the number of chargers using the data collected from electric bus operations in Jeju, Korea. Regardless its contribution to the literature, the study gives limited decision-making information for transit agents who are still using diesel buses particularly in developing countries. Liu and Song [39] propose an optimization model for the allocation of dynamic wireless charging facilities for BEBs. The major pitfall of the proposed study is the lack of detailed information on how an optimal allocation of charging facilities influence the social-economic cost of the bus technologies. Liu and Ceder [40] use an optimization procedure for battery-electric vehicle scheduling problem with charging facilities at bus terminals based on a real-life case study in Singapore. Nonetheless, the proposed study is silent on how the optimal allocation of charging facilities reduces the social economic cost. Estrada et al. [41] use an optimization algorithm to compare the efficiency between charging at bus garage facility and charging at on-street chargers in the city of Barcelona. The results depict that charging at on-street is more efficient than charging at bus garage for small battery packs. The proposed study however assumes an unlimited battery capacity, a scenario which is not always true. Basma et al. [42] propose a battery sizing framework for BEBs with respect to city, intercity, shuttle, regional, and rapid-transit bus services in Paris city considering the driving conditions, passenger occupancy, and weather conditions. Their findings indicate that battery size for BEB is sensitive to bus capacity and trip generated. Rodrἱgues and Seixas [43] argue that the implementation barriers for BEBs in public transport is associated with battery cost, charging strategies, interoperability of charging stations, driving range, people’s willingness to pay, and the integration of e-buses on the grid. This study however doesn’t show how each of the barrier affects the LCC of a transit agency. Zaneti et al. [44] propose an optimization model for sustainable charging schedule for BEBs in the public transport system of the University of Campinas, Brazil. The findings reveal a significant reduction in operational costs when photovoltaic panels are included in the energy storage system. In addition, the results show that the operational costs of the charging and swapping are linked to both regulatory and technical issues. Xylia and Silveira [45] examine the conductive and inductive charging technologies and strategies (slow, fast) for BEBs deployment. The revealed strengths of the conductive charging include higher maximum charging power and the maturity of the technology whereas the strengths of inductive technology include minimal visibility of the charging equipment and the lack of moving parts. Zhang and Chen [46] apply the cost-benefit theory to compare the economic benefits of battery charging and swapping station (BCSS) for BEBs under different power purchase models. The findings indicate that the use of clean energy has better environmental benefits than the use of coal power generation. The list is extensive. However, these studies provide limited insights for choosing between diesel and electric buses for sustainable BRT systems. for more informed decisions it is imperative to review studies that compare diesel and electric bus technologies.The adoption of electric buses is motivated by the falling of bus and battery purchase prices. Hence, several studies have analysed the potential of implementing electric buses over diesel buses [14,18,19,20,21]. For instance, Adheesh et al. [47] quantify the benefits of replacing diesel buses with electric buses (e-buses) in Bengaluru, India. Their findings reveal that the introduction of e-buses will be more economically and environmentally beneficial. Their study falls short in quantifying the social cost of ownership of each of the bus technologies. Marcon [48] determines the feasibility of swapping diesel fleet with e-buses in the city of Edmonton. The results show that an e-bus emits 38-44% less CO2 than its diesel counterparty. However, it is not practicable to implement a policy decision relying only on the amount of emissions from diesel or electric buses. Other factors need to be considered. Figen [49] analyses the TCO between battery electric vehicles (BEVs) and gasoline vehicles with the goal of diffusing BEVs in the Norwegian transport services. The findings demonstrate that BEVs have more favourable TCO than gasoline vehicles. The potential pitfall of this study is the exclusion of the externality costs in the TCO model. Ayetor et al. [50] explores the impact of swapping internal combustion engine buses with electric buses in Ghana. The analysis of the lifetime costs favour operating electric buses. This study however doesn’t show categorically all costs associated with the TCO model. ÓDea [13] uses the climate change criterion to investigate the best option among electric, diesel and natural gas technologies in California. The results reveal that BEBs have 70% lower global warming emissions than diesel or natural gas buses. Jakub et al. [14] apply the Life Cycle Assessment (LCA) to explore the impact of deploying electric bus fleet in the Polish city of Krakow. It is revealed that increasing the share of electric buses for urban public transport would improve ecosystem quality, human health, and minimize the disastrous effect of climate change. That said, the findings of this study could be pegged against the results of another study conducted in other areas preferably in African countries. Campos et al. [51] use a model to compare the limitation of operating BEBs charged at the bus garage against diesel/hybrid buses using data collected from a bus line in Barcelona. The analysis show that diesel/hybrid buses are more competitive than BEBs given the high charging costs of BEBs. Their study however explores the total cost of bus operations as opposed to the total life cycle cost of the bus. Thorne et al. [52] use TCO model to compare E-buses and diesel buses in facilitating the development of public transport policy in Oslo. The results reveal that by year 2025 E-buses will become more competitive than diesel buses in Oslo. Despite its contribution to the body of knowledge, the study does not show the social cost of carbon. Ma et al. [53] examine determinants of energy consumption for electric and diesel buses using data from public transit networks in Beijing. Their study suggests that route characteristics and operational conditions are the prominent determinants of energy consumption. Gabriel et al. [54] analyse the environmental impact of electric, natural gas and diesel buses based on LCC model in Bangkok, Thailand. The findings show that an emission reduction of 18% and 21% can be realized if the whole fleet of Bangkok buses is converted to electric technology. In Africa, only a few countries have started efforts to adopt environmentally friendly technologies by either converting the existing fleet or purchasing new electric buses. These countries are Nigeria, Egypt and Uganda. However, most studies addressing gaps of clean bus technologies have been conducted in developed countries and transition economies like China and India. Dedicated efforts in Africa are limited. Specifically, studies providing reliable and sustainable public transport options for Dar es Salaam city are much more limited. Nevertheless, a limited number of studies which have quantified the environmental hazards of conventional bus technologies are worth mentioning. For instance, Dasgupta et al. [1] analyse the impact of traffic, air pollution, and spatial distribution in Dar es Salaam city and reveal that air pollution emanating from vehicular traffic is a major source of health damage in urban areas. Krüger et al. [55] analyse the impacts of the BRT on city development and livelihoods in Dar es Salaam city. The results reveal that the BRT system has reduced commuting times which to some extent has reduced vehicular emissions. The major shortcoming of this study is the failure to quantify the life time cost resulting from BRT operations. Given the improved electric bus technology and the limited number of context based studies, the current study applies the CLCC model to evaluate the economic and environmental feasibility of implementing an electric BRT system in Dar es Salaam city compared to the diesel BRT system. The LCC model is a comprehensive approach that can compare the costs of alternative projects over the life cycle of a project. In most cases, clean technologies have higher initial costs than conventional technologies but offer operational savings over time through decreased operation, maintenance, and disposal fees. Thus, the LCC model is preferred because it covers the entire life of the investment project, considering the costs of purchasing, operating, maintaining, and disposing of project assets. Although the TCO model has frequently been used to reveal the potential benefits of electric buses in lowering operational costs as compared to diesel buses, its application in capturing environmental externalities like GHGs and CAP emissions is limited. Thus, for a holistic and comparative analysis of electric and diesel BRT systems, the use of LCC model provides a full picture of the economic and environmental potentials in both options over the investment project’s life cycle. The application of the LCC model is not new. Jakub et al. [14] apply the LCC method whose effectiveness is validated based on the findings of a study conducted in the city of Krakow, Poland to assess the environmental impact associated with the deployment of e-buses, diesel buses and diesel hybrid buses. Gabriel et al. [54] use the LCC approach to compare the environmental damage resulting from the operations of electric, natural gas and diesel buses in Bangkok, Thailand and found useful results. Zhao et al. [56] deploy LCC model whose effectiveness is validated based on the results of a study conducted in the city of Sydney to calculate the magnitude of GHGs by the implementation of electric bus charging stations into existing bus depots. Borėn [57] apply the LCC approach which is validated by the findings of a research study undertaken in five Swedish cities to compare societal and total cost of ownership of electric, biogas and diesel buses. Figen [49] conducts a comparative analysis of diesel and electric buses using the LCC model which is validated by the results of a case study based on the Norwegian environment. Thorne et al. [52] validate the LCC model based on the findings of a comparative study of electric and diesel buses in Oslo, Norway. Tong et al. [8] validate the LCC model based on the results of a research study whose objective is to estimate the total cost of ownership including environmental externality costs of fuel options for transit buses in Pittsburgh, United States of America. Paudel et al. [20] apply the LCC model to assess the economic, environmental and social impacts of diesel and electric buses in different regions of Canada. The results validated the effectiveness of the developed LCC model. The LCC of a bus transit system covers all costs throughout the system life span [58].
3. Overview of Comprehensive LCC Model
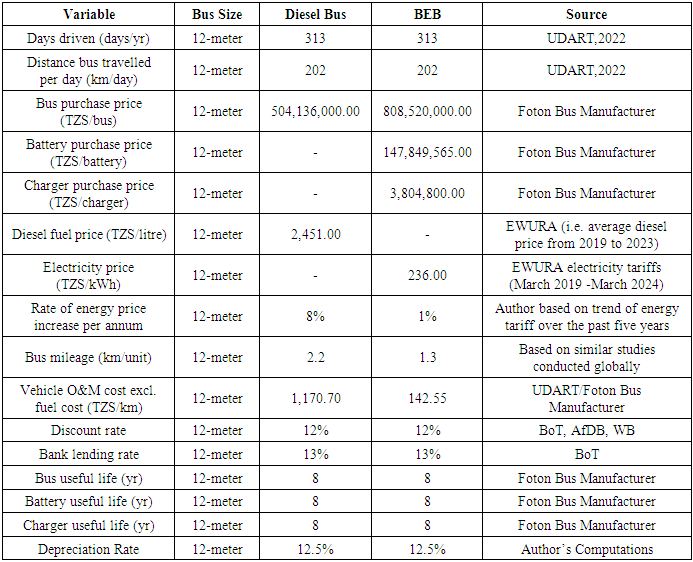
- This study uses the LCC to compare the economic and environmental cost of implementing an electric BRT system over the diesel system which is currently being operated in Dar es Salaam city. The LCC data components considered for this study are obtained from UDART, the operator of diesel BRT system in Dar es Salaam and BEB manufacturer through the Tanzania Embassy in Beijing China. Other related data are obtained from relevant sources as indicated in subsequent sections. The assumptions of LCC model are detailed hereafter.
3.1. Model Assumptions
3.1.1. LCC-related Assumptions for Diesel and Electric Buses
- The following assumptions will be considered during the life cycle of diesel and electric buses:• Bus size and number: A 12-metre bus is proposed for both diesel bus and BEB. The assumption is harmonious with a research study undertaken by Szymska et al. [59].• Fund availability: It is assumed that 100% of the capital investment cost to acquire fixed operating assets for both technologies to come from local commercial banks as loans.• Average life cycle of bus technology: 8 years is proposed for bus life cycle, adopted from a study conducted by Ntziachristos and Samaras [60].• Discount rate: The rate of 12% as proposed by the BoT [61] and ADB [62] for investment of transport projects in Tanzania.• Interest rate: The rate is the average lending rate offered by local commercial banks in Tanzania from 2003 to 2023 [63].• Exchange rate: The exchange rate is a function of exchange rates from 2019 to 2023 and is computed as the arithmetic mean of exchange rates over the period plus the average exchange rate estimated over this period i.e. 2,378 TZS/USD [64].• Bus travel distance per annum: The average vehicle kilometres per annum were collected from the UDART and is fixed for both diesel and electric bus.• Vehicle operating days: The number of days driven per annum is obtained by deducting the number of days off-hire (e.g. vehicle maintenance days) from the vehicle annual days as per UDART vehicle maintenance policy.• Rate of Depreciation: The annual depreciation rate is based on the reducing balance method and is given by the equation (6). Since the bus useful life is 8 years, equation (6) is used to deduce the rate of 12.5% per annum.• Cost related to BEB ownership: The cost components of the LCC model was collected from Foton bus manufacturer. The Foton bus manufacturer was selected due to its competitive rates in the e-bus market. Generally, BEBs are bought cheaper in China than in US and EU [65]. Nevertheless, the prices of BEBs vary from one production area to another. • Electricity price: The electricity price per kWh is computed based on the published electricity tariffs over a period from March 2019 to March 2024 as tariff approved by the Energy and Water Utilities Regulatory Authority (EWURA) in Tanzania. Occasionally, electricity price rises due to inflation and other factors. This is taken into consideration and propose a 1% tariff increase per year. The proposed rate is not significant since electricity price is one of the political agendas. • The number of chargers: There are various ratios proposed by researchers and practitioners. Nevertheless, this study adopts the ratio proposed by Seth and Sarkar [24] whereby one BEB is served by one charger.Using the stated assumptions, the technical and economic values are deduced as presented in Table 1.
|
3.1.2. Emission-related Assumptions
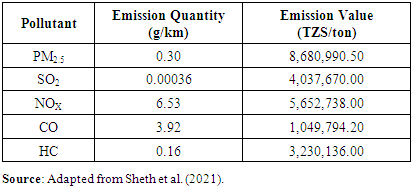
- The following assumptions are considered:• The amount of pollution emitted by the BEB is assumed to be zero [66,67].• The amount of pollution for pollutants resulting from diesel bus operations is adopted from studies conducted in developing countries. In particular, the data are deduced from studies proposed by Sheth et al. [9] and, Sheth and Sarkar [24].• The external costs of pollutants are obtained from the literature.• Only diesel fuel related emissions for key pollutants are considered.• Emissions generated during electricity production from non-renewable sources are excluded.• Lubricant related emissions (i.e. lead, arsenic, cadmium, copper etc) are excluded.• Pollutants associated with carcinogenic species (PAHs, POPs), toxic substances (dioxins, furans), and heavy metals (Pb, Cu, Ni, Cr etc) are not considered. Also, GHGs (CO2, CH4, N2O) are not considered because the effects are global and localizing the effect is almost impossible. The relationship between the quantity of emissions for each pollutant from the diesel bus and its corresponding externality cost is presented in Table 2.
|
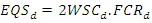 | (1) |
 Emission quantity of SO2 per diesel fuel (g)
 Weight-related sulphur content in the diesel fuel (g/g diesel fuel)
 Diesel fuel consumption(g/km)
3.2. LCC Model
- Based on the emission-related assumptions the LCC Model is developed. The LCC gives the life cycle ownership costs when a certain bus technology is owned and operated by a transit agency. Hence, the LCC model for bus technology b over Y years is given by equation (2).
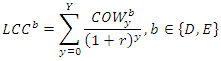 | (2) |
 Cost of ownership for bus technology b in year y.
 The discount rate.
 Diesel bus technology.
 Electric bus technology.Generally, the cost of ownership (COW) of a public transit agency is composed of capital investment cost (CAC) for bus equipment, charger and battery; energy cost (ENC); operation and maintenance cost (OMC) including insurance, scheduled and non-scheduled maintenance; and the salvage value (SAV). For comparative analysis, we neglect insignificant cost items (i.e. the cost of retraining drivers and conductors for BEBs) and fixed cost items incurred by each bus technology. Thus, equation (2) is written in expanded form as equation (3).
 | (3) |
 Discounted life cycle cost of ownership incurred by a transit agency when procuring, operating and disposing bus technology b over time period Y years.
 Capital investment cost incurred for fixed operating asset i when bus technology b is procured in year y and the loan interest paid by the transit agency over time period Y years.
 Energy (i.e. Fuel/Electricity) cost incurred for fixed operating asset i when bus technology b is operated in year y.
 Operation and maintenance cost incurred for fixed operating asset i when bus technology b is operated in year y.
 Salvage value for fixed operating asset i when bus technology b is disposed in year y.The cost of energy for bus technology b (ENCb) is a product of bus energy consumption (BECb), the energy unit cost (EUCb), and bus distance travelled (BDTb) as given in equation (4).
 | (4) |
 Rate of energy (i.e. fuel/electricity) price increase for bus technology b per annum.The salvage value after year (y+1)
  is obtained by deducting the depreciation from the acquisition cost of the fixed operating asset at year y as given by equation (5).
  | (5) |
 Rate of depreciation for the fixed operating asset i per annum.The rate of depreciation is a percentage of an investment cost in fixed operating asset that the transit agency claims as a tax-deductible expense over the asset’s useful life. This rate is given by equation (6).
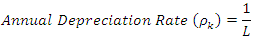 | (6) |
 The useful life of fixed operating asset i per annum during the use of bus technology b.When the Life Cycle External Costs (EXC) are considered, the LCC model becomes the CLCC model.
 3.3. Comprehensive Life Cycle Cost (CLCC) Model
- The CLCC model that considers the EXC is developed. The EXC consist of costs related to bus operation (tailpipe exhaust, brake and tire wear, fuel production and delivery process when powering a bus, upstream activities related to energy extraction), and fossil fuels used in energy production processes. Equation (2) is therefore extended to consider the social costs caused by the emission of CAPs giving the CLCC model as indicated by equation (7).
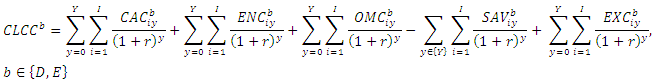 | (7) |
 represents externality costs incurred for fixed operating asset i when bus technology b is operated in year y. The
  is computed by using equation (8).
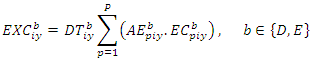 | (8) |
 Distance travelled by fixed operating asset i when bus technology b is operated in year y.
 Amount of p emission in tons/km generated by fixed operating asset i when bus technology b is operated in year y.
 Cost of p emission in TZS/ton generated by fixed operating asset i when bus technology b is operated in year y.The comprehensive life cycle cost for bus technology b during year y
  is given by equation (9).
 | (9) |
4. Application of LCC Model to Evaluate the Economic and Environmental Costs of Electric and Diesel Buses for BRT System in Dar es Salaam City
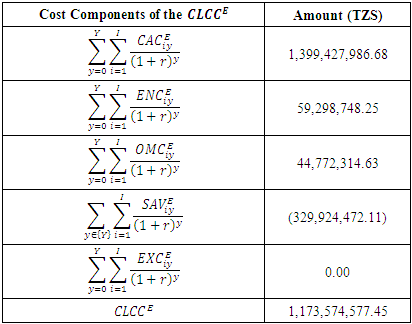
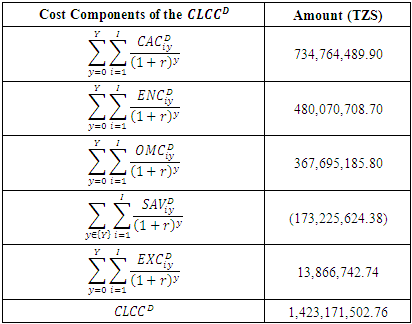
- The CLCC model is used together with the data in Tables 1 and 2 to get the cost components of the CLCC for a hypothetical 12m BEB travelling 202km per day and driven for 313 days in a year as depicted in Table 3. It is observed in Table 3 that the capital investment cost (TZS 1,399,427,986.68) is the most significant cost element of the CLCC whereas the cost for the energy component (TZS 59,298,748.25) and the cost for the operation and maintenance component (TZS 44,772,314.63) are relatively mediocre. The high upfront cost makes electric buses unattractive to transit agencies. In addition, it is a significant obstacle to achieving SDG 11 which aims to make sustainable cities and communities [19]. To counteract this challenge, a number of policy options are suggested. For a public transit agency envisaging the use of electric buses for BRT should consider analyzing critically the sources of capital investment. Alternatively, the government can offer grants to the public transit agency to cover the upfront and operational costs. These grants can either be in terms of tax breaks, cash or subsidies in the form of transport fares. Similarly, green bonds can be used to raise capital to finance climate related investment (i.e. e-buses). Also, funds can be provided by private bus operators who can finance both the acquisition and operation of e-buses through concessional loans obtained from the commercial banks.
|
|
|
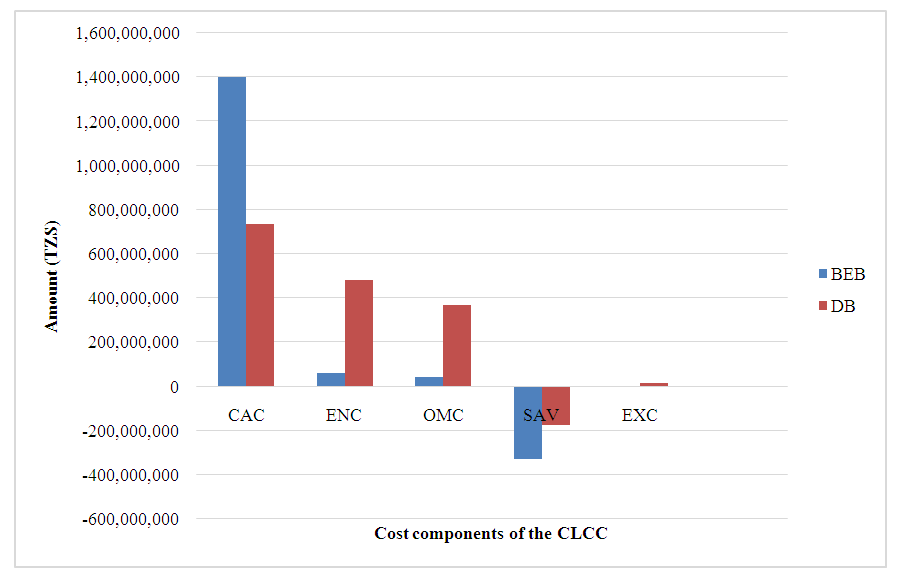 | Figure 1. Pairwise comparison of cost components of the CLCC between BEB and diesel bus |
5. Conclusions and Recommendations
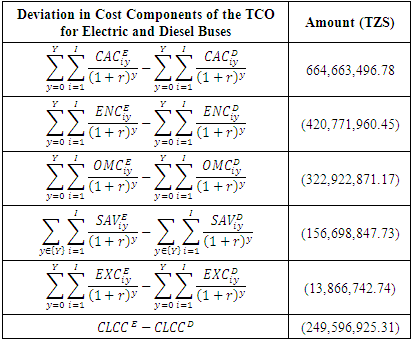
- The objective of this paper was to explore the feasibility of switching from diesel buses to electric buses for BRT operations in Dar es Salaam City. In-depth analysis has been carried out by the application of the comprehensive LCC model based on the PW to find out the feasible option. The modelled life costs include external costs emanating from local pollutants. From the analysis, a number of observations are identified. Firstly, the cost of capital investment (i.e. bus unit, battery and charging infrastructure) for the BEB is 90.46% higher than that required for the diesel bus. Secondly, the cost of energy for operating the BEB is 87.65% less than that applicable for operating the diesel bus. Thirdly, the cost of operation and maintenance for the BEB is 87.82% less than that of the diesel bus. Fourthly, the environmental externality cost of the BEB is significantly less than that of the diesel bus, considering that the emissions resulting from the generation of electricity were not modelled. Lastly, the life cycle cost of the BEB is 17.54% lower than that of the diesel bus. Based on these findings, the deployment of BEBs presents a viable strategic option for BRT operations in the Dar es Salaam city. The economic and environmental analysis of electric and diesel buses based on the LCC model indicate that BEBs are promising alternatives for BRT in cities of developing countries. Specifically, BEBs are recommendable options for parties who are responsible for the provision of public transport service including transit agencies, the government and bus manufacturers. Nevertheless, it is unlikely that a transit agency can immediately switch from diesel buses to BEBs given the limited strategic resources (i.e. financial and human resources). It is therefore suggested that transit agencies should consider both short-term and long-term objectives and strategies on fleet replacement. Any transit agency wishing to invest in BEB fleet should get prepared for changes in supporting infrastructure, reliable energy supply, initial capital investment, operation and maintenance, and planning and scheduling. In addition, transit agencies are alleged to use intelligent transport technologies to enhance the performance of BEBs. The BEBs have now reached a stage of giving key information such GPS locations and the state of battery charge which facilitate real-time scheduling and charging operation. The government, on the other hand, should promote investment in BEBs through fiscal policy mechanism by amending tax regulations to eliminate taxes and duties (e.g. VAT, import duties) on BEBs imported in the country for public transportation.
5.1. Implications for Research
- The findings of the study have theoretical and practical implications. Theoretically, this study appears to be the first to provide a comprehensive LCC model that captures critical cost components including acquisition cost, energy cost, operation and maintenance cost, salvage cost, and externality cost over the life cycle of a bus technology. The tendency has been to model one or few of these cost components and thus provided limited understanding on the choice of sustainable bus technology. In addition, the study adds theoretical knowledge with regard to investment of BEBs for BRT operations. Practically, results shed light on what makes one bus technology more attractive than another considering the escalating society demands on green transportation. Specifically, this study makes transit agencies aware of the key components of the LCC that enable them make informed investment decisions.
5.2. Limitations and Directions for Future Research
- While this study discloses valuable insights into the planning and designing of urban bus transit systems, it still suffers from several limitations. Due to various assumptions and simplifications, albeit inevitable for tractability, the developed comprehensive LCC model cannot fully capture the diversity of bus transit system and city characteristics. For instance, the assumption of a uniform bus useful life for each BRT system renders the model unsuitable for practical transit agencies with variant depreciation policies. Moreover, the costs associated with the investment in charging infrastructure and emissions generated during the production of electricity were not modelled, thus limiting the applicability of the proposed comprehensive LCC model. Nevertheless, the study provides in-depth and significant investment information to the transit agencies, government, city bus manufacturers, Financiers, and other stakeholders interested in deeper understanding of green transportation. Future studies should incorporate more parameters including modeling upstream emissions of electricity to give more reliable results and generalizability.
Declarations
- The author declares that he has no conflicts of interest.