Amarjit Singh1, Bailey Hopkins2
1Professor, Dept of Civil Engineering, Univ of Hawaii at Manoa, Honolulu, HI, USA
2Grad Student, Dept of Civil Engineering, Univ of Hawaii at Manoa, Honolulu, HI, USA
Correspondence to: Amarjit Singh, Professor, Dept of Civil Engineering, Univ of Hawaii at Manoa, Honolulu, HI, USA.
| Email: |  |
Copyright © 2020 The Author(s). Published by Scientific & Academic Publishing.
This work is licensed under the Creative Commons Attribution International License (CC BY).
http://creativecommons.org/licenses/by/4.0/

Abstract
Landfills near communities place a significant burden on residents that are exposed to the environmental hazards and health risks, especially in locations where land is limited. The paper explores how Plasma Arc Gasification (PAG) can be applied to the City and County of Honolulu in the State of Hawaii, where construction of a new landfill is currently necessary in the coming decade, restricting the already strained land. Potential economic and environmental impacts of PAG with the City and County of Honolulu’s current waste-to-energy program are explored to find a conceivable solution to an ongoing problem. It is seen that PAG technology can reasonably reduce the landfill footprint in Honolulu down to 2%, consume existing landfill waste for fuel thus increasing the longevity of a landfill, and produce 56.65 MWh electricity and 91,000 tons of aggregates as a byproduct for use in concrete and asphalt. The pollution generated by PAG is lower than the minimum permitted, and far lower than existing H-Power plants that burn waste for electricity. Having two PAG plants, instead of one, in conjunction with the already established H-Power is the more optimal explored solution.
Keywords:
Municipal Solid Waste, H-Power, Alter NRG, Fly Ash, Byproduct analysis, Feedstock
Cite this paper: Amarjit Singh, Bailey Hopkins, Feasibility and Economic Analysis for Plasma Arc Gasification in Honolulu for Converting Waste to Energy and Reducing Landfill Footprint, International Journal of Energy Engineering, Vol. 10 No. 4, 2020, pp. 102-116. doi: 10.5923/j.ijee.20201004.02.
1. Introduction to Waste in the City and County Of Honolulu
The population in the City and County of Honolulu generates over 1.2 million short tons1 of municipal solid waste (MSW) annually. Of this waste, approximately 400,000 short tons of MSW is recycled while the other 800,000 short tons of MSW needs to be managed (R.M. Towill Corporation and SMS Research Services 2017). There are currently two landfills located on the west coast of Oahu, the Waimanalo Gulch Sanitary Landfill (WGSL) is designated for MSW and the second landfill is the privately owned PVT landfill located in Nanakuli designated for C&D debris. Additionally, located in Campbell Industrial Park on the west side of Oahu is a waste-to-energy (WTE) plant that processes approximately 2000 tons of MSW daily and generates approximately 10% of the island’s electricity demand. This facility is known as Honolulu Program of Waste Energy Recovery or H-POWER (Department of Environmental Services 2005). See Figure 1 for a location map of these facilities. H-POWER uses combustion (Refused Derived Fuel - RDF and Mass Burn Unit -MBN) to process the MSW.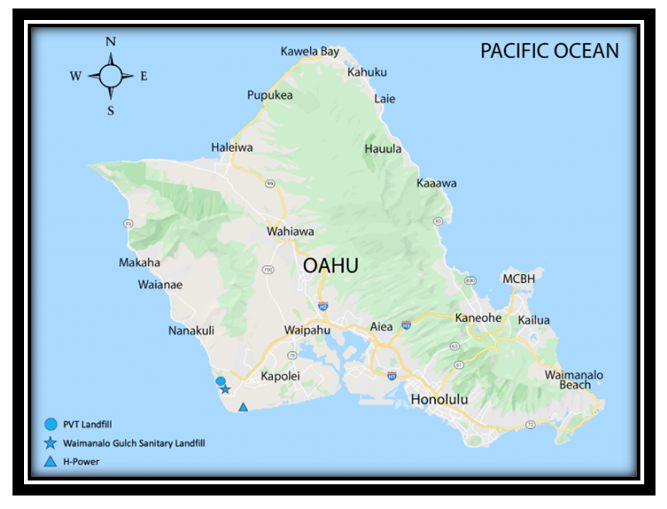 | Figure 1. Locations of PVT Landfill, WGSL, and H-Power |
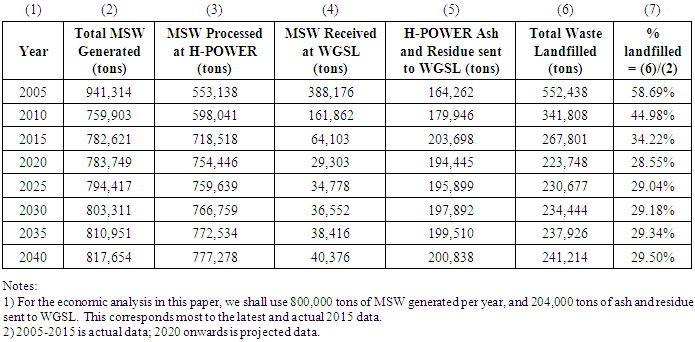
An assessment of MSW requirements in Oahu was prepared by R.M. Towill Corporation and SMS Research Services in 2017 for the Department of Environmental Services. Using de facto population data conservatively (median projections in Table 1), 817,000 tons of MSW annually may need to be managed by the City and County of Honolulu by year 2040. Of this 817,000 tons of MSW, 777,000 tons of MSW will be processed at H-POWER in 2040, while 241,000 tons of MSW and H-POWER ash would need to be disposed of via landfill. The waste that goes directly to landfill includes medical waste, dead animals, wastewater sludge and grit from wastewater treatment plants, sandblast grit, auto shredder residue, and other homeowner drop-off waste. In addition, when H-POWER is down for maintenance, waste is redirected to WGSL based on H-POWER’s status of storage (approximately 10% of the waste generated). Using these projections and the values provided in Table 1, about 29% (230,677 tons) of the MSW generated in Oahu (794,417 tons) will end up each year in the WGSL landfill after 2025, whether it be unprocessed MSW or H-POWER ash and residue. 759,639 tons are expected to be processed at H-Power in 2025. The WGSL has the capacity to accept MSW until the year 2038 with this projection of MSW generation (R.M. Towill Corporation and SMS Research Services 2017).Table 1. Median Waste Handling Actual and Projections on Oahu from 2005 – 2040 (Modified from R.M. Towill Corporation and SMS Research Services 2017)
 |
| |
|
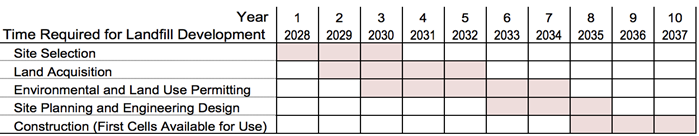
In 2012, the Mayor of Honolulu put together a committee to analyze future landfill sites in Oahu that ranked 11 different potential landfill locations. The committee estimated a timeline of 10 years to develop a new landfill in Oahu (Table 2). The City and County of Honolulu should begin planning by the year 2028 with the current projected lifespan of WGSL to last until 2038 (R.M. Towill Corporation and SMS Research Services 2017). Table 2. Estimated Timeline for Landfill Development on Oahu (Modified from R.M. Towill and SMS Research Services 2017)
 |
| |
|
1.1. Introduction to Literature Review
This study was focused for the island of Oahu. Because there are not many islands in the world afflicted by this matter of limitations in landfill space, the literature is limited on this topic. Other states and countries have substantive land spaces where they can locate landfills. Beck (2003) undertook a short study for Honolulu, but without delving into a deep life cycle cost analysis. Studies in other parts of the world are available, as are the actual construction of physical plants for PAG. Other islands with high population densities, such as Hong Kong and Manhattan are not using PAG. The Gerald Ford class aircraft carriers use PAG on a small scale. However, the one defining literature source that sheds light on PAG economics is Ducharme (2010).
2. Honolulu Program of Waste Energy Recovery (H-POWER)
The H-POWER plant began operations in 1990 with two RDF units, and in 2012, the facility was upgraded with a Mass Burn Unit (MBN) to process an additional 900 tons per day. Today, H-POWER is capable of processing 3,000 tons of MSW per day and has the capacity to produce 90 megawatts of installed electric power – 7.5% of Oahu’s needs. H-POWER reduces the amount of MSW that ends up in WGSL by up to 90%, and H-POWER processes on average 2000 tpd of MSW generating approximately 68.5 MWh of electricity for sale to Hawaiian Electric Company (HECO) (Covanta Holding Corporation 2018, Lanuevo 2018). However, H-POWER puts back about 25% of the waste in the form of fly ash into the landfill.The WTE technology used in the facility is the conventional combustion grate system. MSW is converted to energy using two Refuse Derived Fuel (RDF) furnace/boilers with combustion engine traveling grates and a Mass Burn Unit (MBN). The grates travel through a furnace where the waste is combusted. The combusted air is used to generate steam that powers a steam turbine generator. Emissions are controlled and regulated using semi-dry flue gas scrubbers injecting lime, fabric filters, and continuous monitoring systems.
3. H-POWER Economics
Gate fees at H-POWER generate up to $45 million annual gross revenues for the City and County of Honolulu. In the 2014 and 2016 SWANA Excellence Award entries it is published that H-POWER charges $45/ton for municipal and $81/ton for commercial waste, further confirmed by Honolulu’s Chief of Refuse, Lanuevo (2018). Using the rates of $45/ton and $81/ton for the cost of municipal and commercial MSW respectively and a gross revenue of $45 million, the average gate fee cost for intake of waste into H-Power equates to ~ $68/ton of MSW, as shown below in Eqn. 1 (where x = amount of municipal waste, and y = amount of commercial waste).2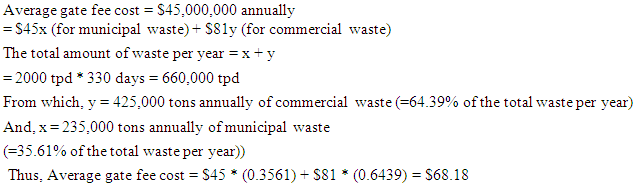 | (1) |
The city also produces income by selling electricity that H-POWER generates to Hawaiian Electric Company at approximately $0.20/kWh. Covanta, the operating company of H-POWER receives 18.5 percent of this income under contract (SWANA Excellence Award Entry 2014). Hawaiian Electric Company (HECO) estimates an average 68.5 MW per hour is input into Oahu’s energy grid from H-POWER, generating approximately $88 million annually3. Additional revenue is generated through the recycling of ferrous and non-ferrous revenues of approximately $5 million where Covanta receives approximately half (SWANA Excellence Award Entry 2014). The August 2018 maintenance bill charged to the city by Covanta was $3,131,0064. This bill includes labor, daily operating, and maintenance costs. The capital costs and budget are paid for through a different funding source, which is roughly 2.5% to 3.5% of the operation and maintenance bill, or $78,275 to $109,585 per month5. An additional expense that the H-POWER budget carries is the disposal of the ash byproduct from the combustion of MSW. WGSL charges H-POWER $62 per ton of fly ash to be disposed of in the landfill. Approximately 180,000 short tons of fly and bottom ash is sent to Oahu’s WGSL landfill each year (Lanuevo 2018).The 2014 SWANA Excellence Award entry also states that the H-POWER annual budget is up to $100 million. “That number is actually everything (i.e., capital + operation, maintenance & reimbursable costs + debt service and other services done by other agencies within the City, such as legal & purchasing to name a few) per year” (Lanuevo 2018). The City and County of Honolulu reported in its 2016 SWANA Excellence Award Entry a net revenue of $90/ton of MSW. A cost per ton analysis of the budget is conducted later in this paper that confirms the net revenue reported.
4. Plasma Arc Gasification (PAG)
Plasma is the fourth state of matter -- an electrically conductive gas consisting of a mixture of ions, electrons, and neutral particles. In its natural state, it is found on the surface of the sun and in lightning. In its man-made state, charged gas molecules are forced into high energy collisions to conduct an electric charge. This is achieved by passing the charged molecules through a gas such as oxygen, although several different gases may be used. The reaction dissociates the gases into ions and electrons that significantly raises the temperature of the reaction to temperatures from 10,000 to 25,000 degrees Fahrenheit (U.S. Department of Energy n.d.; Hosansky n.d). Due to the extremely high heat of plasma, it can destroy and vaporize all chemical bonds of any material, including hazardous materials, excluding nuclear waste. Gasification is the process where organic matter is broken down into syngas that consists of hydrogen and carbon monoxide, which are then used to drive the turbine to produce energy using an Integrated Gasification Combined Cycle (IGCC). Plasma arc gasification is the method of using the heat from the plasma arc to melt and break down organic matter into syngas and vitrify the inorganic residue into a glass-like slag aggregate. (Beck 2003, Ducharme 2010, Juniper Consultancy Services Ltd. 2008).
5. Alter NRG Westinghouse PAG Process
A 1000 tpd Alter NRG Westinghouse Plasma Gasification facility6 will be used in this analysis. Westinghouse Electric Corporation has more than 30 years of experience in plasma technologies (Alter NRG 2018). The PAG facility to process MSW would consist of four main parts, as shown in Figure 2: (1) feedstock which includes hazardous waste, C&D debris, ash, biomass, and MSW. (2) The plasma gasification reactor where feedstock is turned into dirty syngas and slag. (3) Syngas clean-up and gas cooling. When syngas is first formed it is contaminated with hazardous materials that need to be removed before the gas can be used to generate electricity. (4) Syngas to energy conversion unit (R.W. Beck 2003). 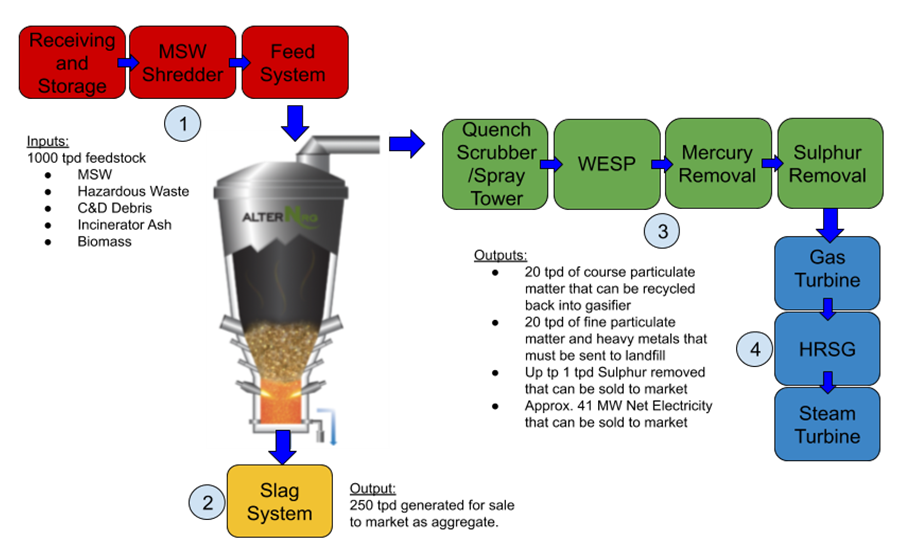 | Figure 2. Inputs/Outputs of 1000 tpd Alter NRG PAG Facility (Modified image from Alter NRG) |
5.1. Benefits of PAG
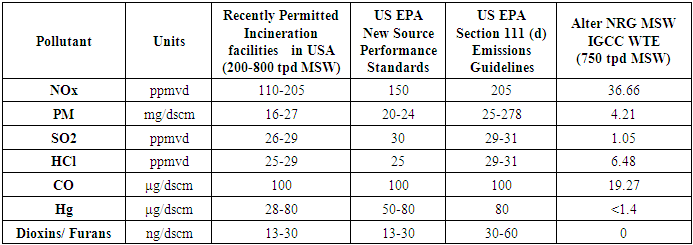
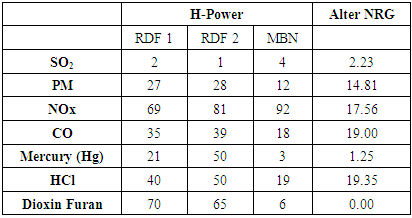
There are multiple environmental benefits that result from a PAG plant. These benefits include reduced emission levels, reduced greenhouse gases, beneficial use of byproducts, and a reduction in waste that would be landfilled. A third-party environmental consultant agency compared the lifecycle greenhouse gas emissions between incineration, landfill energy capture, natural gas combined cycle, and PAG IGCC facilities. Their 2010 report concluded: “The results of this analysis show that the Plasma gasification Combined Cycle (“PGCC”) system provides the lowest greenhouse gas emissions of the evaluated systems for waste disposal … Reduced emissions, reduced amounts of solid wastes that need to be landfilled and reduced greenhouse emissions - plasma gasification has better environmental performance in all areas” (Westinghouse Plasma Corporation 2014). Emission comparisons between allowable values, H-Power, and Alter NRG can be found in Tables 3 & 4. For instance. NOx fumes, particulate matter, Hydrochloric acid, and carbon monoxide are 1/4th to 1/5th less than the EPA standards; Mercury emissions are about 2% of the EPA standards, while dioxins and furans are eliminated. Compared to H-Power, the greatest emission reductions are on sulfur dioxide, nitrogen oxides, mercury and dioxins and furans. Other benefits of PAG include the multiple avenues of revenue streams such as intake gate fees, sale of electricity generated, and the sale of slag byproduct to construction industry. Table 3. Emissions Comparison Between Recently Permitted Incineration Facilities and Alter NRG PAG Facility (Modified from Alter NRG 2010)
 |
| |
|
Table 4. Percent of Emissions Limit Allowable Emitted by H-Power and Alter NRG
 |
| |
|
6. Economic Analysis of H-Power
This economic analysis assumes that H-Power works for 330 days a year and consumes 2000 tpd on average, which is the stated capacity of the H-Power plant. This is a fair number, given that there is a yearly variability to the intake. Moreover, this also accounts for additional downtime at H-Power at its plants which is also variable. Generally, H-Power runs at 2/3rd capacity.
6.1. Capital Costs
Capital costs7 are approximately 2.5% to 3.5% of the operating cost of $3,131,006 per month (Lanuevo 2018). This will be averaged to 3%. The average rate of incinerating 2000 tpd of MSW will be used to break down costs into cost per ton of MSW processed. Using the same model provided in Ducharme (2010), it will be assumed that the plant operates at 90% availability (to account for shutdowns due to maintenance and repair), or 330 days of the year. Using these variables, the calculations of capital payments per ton are as follows (Eqn. 2):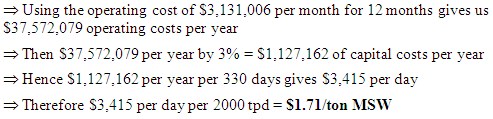 | (2) |
6.2. Fly/Bottom Ash Disposal Cost
H-POWER sends approximately 180,000 tons of fly ash to WGSL each year. Therefore, the cost per day is calculated in Eqn. 3.8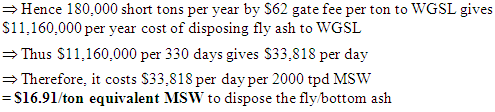 | (3) |
6.3. Operating Costs
Using the August 2018 Covanta payment, operating costs including labor and maintenance total $3,131,006 (Lanuevo 2018).Using these variables, the calculations of operating costs per ton are as follows in Eqn. 4:  | (4) |
6.4. Legal, Debt, and Miscellaneous Service Costs
The costs of legal, debt, and costs incurred from other agencies within the city is the remaining of the $100 million annual budget of H-POWER. 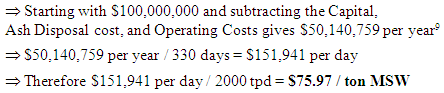 | (5) |
6.5. Revenue from H-Power
Processing an average of 2000 tpd H-POWER generates approximately 68.5 MWh of electricity a day. Hawaiian Electric Company’s average cost of $0.20 per kWh will be used in this analysis. An average intake gate fee of $68/ton MSW10 will be used. Data regarding the income generated through renewable energy credits is unknown;11 therefore, the same assumption made under the Ducharme (2010) thesis of $1 per MWh will be used. Further, H-POWER generates approximately $5 million annually from recycling ferrous and non-ferrous metals (SWANA Excellence Award Entry 2014). Using these variables, the calculations for electricity revenue are as follows in Eqns. 6 to 8: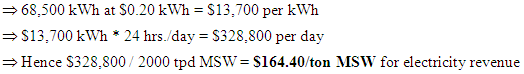 | (6) |
Using these variables, the calculations for renewable energy credits revenue are: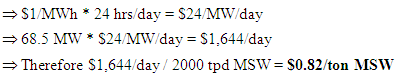 | (7) |
Using these variables, the calculations for recycled metal revenues are: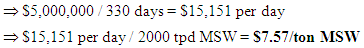 | (8) |
These costs and revenues of H-Power are displayed in Table 5, which is essential to view the cost estimates in summary form. Table 5. Economic Analysis of H-POWER
 |
| |
|
7. Economic Analysis of Alter NRG
7.1. Capital Costs
According to the 2015 Alter NRG corporate presentation, a 1000 tpd IGCC facility would cost an estimated US $248 million in an unknown location in the U.S. Gulf Coast. Transferring the costs to Honolulu and inflating to 2018 gives us an updated capital cost of $363.8 million. Plant availability is at an estimated 90% a year to account for maintenance and repairs, or 330 days a year.12 The year of start-up may have more downtime than average due to the learning curve, calibration, and optimization of the plant. However, for the purpose of this analysis and simplicity, this was not considered. Using these variables, the calculations of capital payments per ton are as follows (Eqn. 9):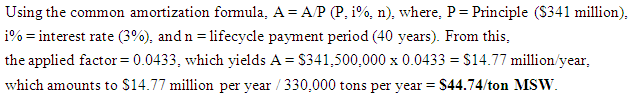 | (9) |
7.2. Operating Costs
Alter NRG claims that the personnel and labor required to maintain a PAG facility is similar to that of a grate combustion facility, such as H-Power. The personnel and labor that H-POWER is under contract with COVANTA, which includes labor, operation, and maintenance, processing approximately 2000 tpd is $3,131,006 monthly. This operation cost will be cut in half due to the 1000 tpd capacity of the PAG facility. An additional operating cost that will be needed for the PAG facility is the metallurgical coke that is added at 4% by weight of the MSW feedstock, 330,000 tons per year, which equates to 13,200 tons of metallurgical coke annually. The metallurgical coke is necessary as it acts as a bed that the MSW rests on while it is gasified. Alter NRG estimated $300/ton for metallurgical coke in the Gulf Coast area. This price cost would be adjusted using the RS Means (2017) area cost index to account for transportation and stockpiling costs from Gulf Coast (City Cost Index, 85.7) to Honolulu (city Cost Index 118). Plasma torch replacement costs are typically $1 to $2 million annually (assume $2 million for this exercise).Using these variables, the calculations of operating costs per ton are as follows (Eqns. 10 to 13): Personnel and Labor Costs | (10) |
Met Coke | (11) |
Torch Maintenance | (12) |
Summary of Operating Costs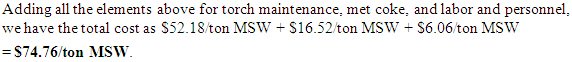 | (13) |
7.3. Fine Particulate and Heavy Metal Disposal
Ultimately, 20 tons per 1000 tons of MSW of fine particulate and heavy metals would need to be disposed of via landfill and cannot be recycled back through the PAG facility (Refer Fig. 3). The costs for this recycling will be calculated using the $81/ton charged at WGSL for commercial waste. The costs of collecting the fine particulate matter and heavy metals are included in the labor costs.Using these variables, the calculations of fine particulate and heavy metal disposal costs per ton are as follows (Eqn. 14): | (14) |
7.4. Revenues
Alter NRG estimates that 1000 tpd will yield 41 net MWh of usable energy to the grid. Hawaiian Electric Company’s average cost of $0.20 per kWh will be used in this analysis. To further reinforce this cost for coarse aggregate, Honolulu Construction and Draying Co., Ltd. (HC&D) 2016 price for fine and coarse aggregate for concrete and asphalt ranged from $40.05 to $54.75, depending on quarry location (Honolulu Construction and Draying Co. 2016). Using this information, a price of $50 per ton of aggregate will be used to calculate slag revenue.Gate fees can be generated from residential MSW, commercial MSW, fly and bottom ash, C & D debris, and hazardous waste. Using the same intake gate fees as H-POWER at $45/ton for residential waste and $81/ton for commercial waste, a weighted average of $68/ton MSW will be used for this analysis. Following the Ducharme (2010) model, an assumed $1 per MWh can be gained by the plant through Renewable Energy Credits. Ferrous and non-ferrous metals would be separated prior to processing and revenue would be the same as a grate combustion plant. Generating at the same rate as H-POWER would bring in recycled metals at a rate of $7.57/ton MSW.An additional expense that will be avoided in the future is the cost to build an additional landfill in Oahu at an average of $3/ton (R.M. Towill and SMS Research Services 2017). This avoided expense would be considered revenue, or else can be taken as a negative expense. Eqns. 15 to 17 spell out these calculations.Using these variables, the calculations for electricity revenue are: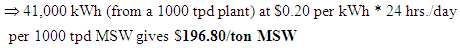 | (15) |
Using these variables, the calculations for slag revenue are: | (16) |
Using these variables, the calculations for Renewable Energy Credits revenue are: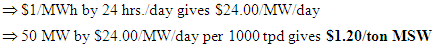 | (17) |
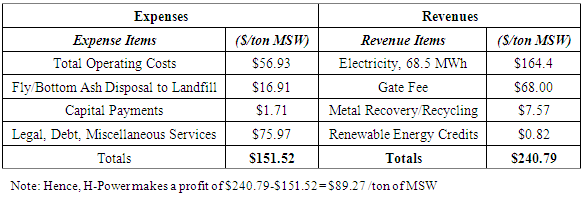
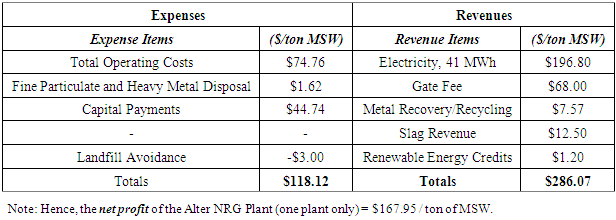
These costs and revenues of Alter NRG are displayed in Table 6, which is essential to view the cost estimates in summary form. Table 6. Economic Analysis of 1000 tpd PAG IGCC Alter NRG Plant (ONE Stand-alone PLANT)
 |
| |
|
8. Economic Comparison: Burning (H-Power) V. Plasma Arc (PAG)
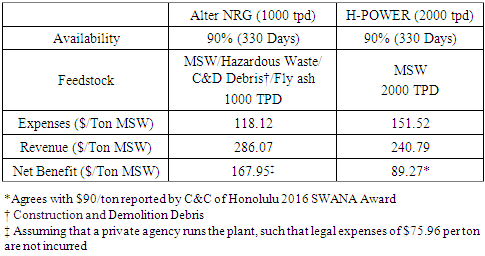
In a side by side economic comparison, summarizing Tables 5 & 6, PAG using Alter NRG’s Westinghouse Technology appears to be the more economic option than the traditional grate combustion technology used by H-POWER (Table 7). Table 7. Economic Comparison Between Alter NRG and H-POWER Facilities
 |
| |
|
As seen in the analysis, the major difference between H-POWER and Alter NRG is the sources of revenue. The efficiency of an IGCC power plant is significantly higher with a gas turbine and steam turbine generating electricity. The increased power generation efficiency allows the Alter NRG plant to generate about $78.6813 more per ton of MSW processed than H-POWER. Another variable that makes this revenue so beneficial is the relatively high $0.20 per kWh cost of electricity. Another source of income that the Alter NRG plant has over H-POWER is the sale of the byproduct. The Alter NRG plant would generate $12.50 per ton of MSW, as shown in Table 6, through the sale of the slag aggregate that H-POWER would not. One development to note is that H-POWER is currently in the process of developing a facility that would process the fly ash so it can be sold to be used in construction applications like the slag aggregate is. This would be another source of income for H-POWER in the future. An expense that H-POWER must pay, that Alter NRG does not, is the cost to dispose of the fly ash. With 180,000 short tons of fly ash to dispose each year at a gate fee to WGSL of $62 per ton, H-POWER spends over $11 million of its annual budget on fly ash disposal alone. The source of where the main expense comes from between H-POWER and Alter NRG is different. H-POWER’s largest expense comes from management expenses from other city departments, legal fees, and other miscellaneous costs. This accounted for approximately 50% of H-POWER’s budget, at $75.97 per ton (refer Table 5 - Legal, Debt, Miscellaneous Services). The total expenses for an Alter NRG plant have been taken directly from the Alter NRG corporate presentations. Those presentations do not include cost for legal, debt, and miscellaneous expenses such as are apparently incurred by H-POWER. Hence, no additional expense for legal and debt services were added to the Alter NRG expenses. However, should the expense be similar or equivalent to H-POWER if it was under the operation of the City and County of Honolulu, an Alter NRG facility would still have a net benefit of $91.99 per ton of MSW processed14. At a $91.99 per ton MSW net benefit for Alter NRG and $89.27 per ton MSW net benefit for H-POWER, the net benefit between the two facilities is relatively the same. However, should this economic endeavor be undertaken through a private venture, rather than under the city, the legal, debt, and miscellaneous management expenses may differ. The expense that is significantly different between the two facilities is the capital cost. The PAG facility capital costs roughly $44.74 per ton of MSW vs. only $1.71 for H-POWER. A 3% interest rate over a 40-year life cycle period was used to calculate Alter NRG’s capital payments. Moreover, it is known that H-POWER’s capital cost equates to roughly 3% of its monthly operating bill. An additional factor that adds to the capital cost is the area cost index. The cost of labor, equipment, and material in Hawaii raises the capital cost by almost $94 million than what was quoted for a facility in the Gulf Coast area of the United States. The PAG facility has a significantly higher capital cost than H-POWER. This statistic is consistent with the findings in Ducharme (2010), where the traditional grate combustion facility had lower capital costs than all the PAG facility options presented in that study. The higher capital cost of a PAG plant would require higher upfront costs to construct the facility. Capital costs did not consider government incentives for clean energy that would likely be available to the developer.
9. Impact on Hawaii
9.1. H-Power Byproduct Used as a Feedstock to One PAG Plant
9.1.1. Savings by Gate Fee Avoidance
One of the benefits of a PAG facility is its ability to process practically any feedstock, including the toxic fly and bottom ash byproduct generated from a grate combustion WTE facility such as H-POWER. Should the City and County of Honolulu build a PAG facility and use the H-POWER fly ash as the feedstock, the City and County could drastically reduce the $11 million that they spend each year in disposal fees by processing it through the PAG facility. Since only 2% of what is processed is sent to landfill through PAG, only 3,600 tons will be sent to landfill of the 180,000 short tons of fly ash created from incineration. The cost of disposing the fly ash via landfill will reduce from over $11 million, to $223,200 dollars -- a savings of $10,936,800. This is shown in the calculations in Eqn. 18. 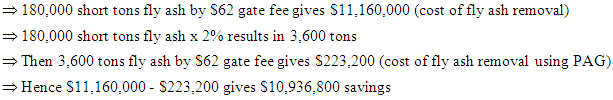 | (18) |
9.1.2. Additional Revenue from the Slag from Fly Ash
The other benefit of using a PAG facility to process the fly ash from H-POWER is that it will be converted into usable slag that can also be sold by the city. Of the 180,000 short tons of fly ash processed would come 45,000 tons of slag aggregate that could be sold to generate revenue. At $50 a ton15, the slag could be sold to generate $2.25 million annually from processing the fly ash from H-POWER (Refer Eqn. 19). | (19) |
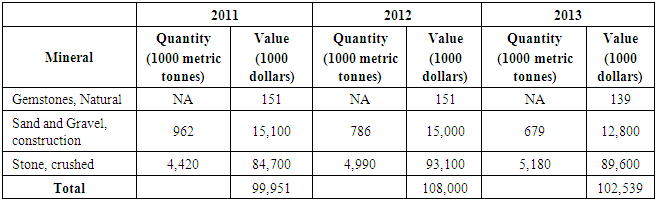
The next question to answer is whether there is a demand for aggregate in Hawaii. “In 2013, three were 21 stone quarries, 20 processing plants, and 15 sand-and-gravel processing plants”, and as indicated in Table 8, 5859 thousand metric tons16 (=6,456,618 short tons) of construction sand, gravel, and crushed stone was mined in 2013 (USGS 2016). If the trend of 2011-2013 in Table 8 continues, the demand and amount of aggregate mined will only increase. Table 8. Mineral Production in Hawaii from 2011-2013 (Source: USGS 2016)
 |
| |
|
From processing 180,000 short tons of fly ash per year through an Alter NRG PAG facility would produce 45,000 tons of slag aggregate. This is only 0.68% of the aggregate mined in Hawaii in 2013 (calculations in eqn. 20 below), which establishes there is demand for the slag aggregate.  | (20) |
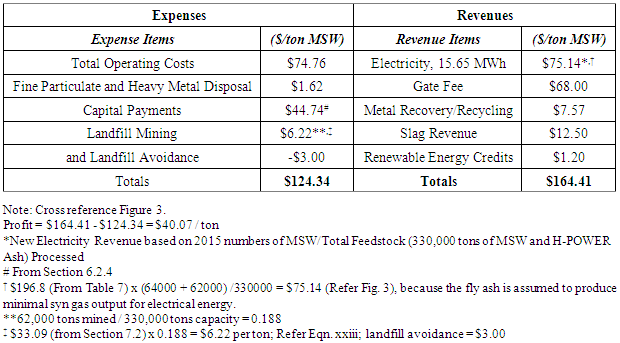
An important factor to note is that ash contains very little organic content. Hence, it would provide minimal syngas output for electricity generation. Should the feedstock material processed contain ash from H-POWER that does not contribute to positive electricity output, the economic net benefit of the PAG facility would be $40.07/ton of feedstock (Table 9 / Figure 3). The electricity output is reduced corresponding to the 204,000 tons of fly ash and residue brought from H-Power. This fly ash and residue is assumed to produce negligible energy because it carries very little organic matter. Subsequently, the total electricity output comes only from the 62,000 tons of waste from WGSL and the 64,000 tons from direct MSW17. Hence, this will reduce the electricity output from 41 MWh to 41*(62,000 + 640,000)/330,000 = 15.65 MW, which leads to $75.14/ton. The essential change, shown in Table 9, over Table 6, is that the electricity revenue is reduced commensurate to the actual electricity-producing feedstock taken in.Table 9. Economic Analysis of a single 1000 tpd PAG IGCC Alter NRG Plant taking in MSW and H-POWER Ash Feedstock
 |
| |
|
 | Figure 3. Flow Chart Should C&C of Honolulu Operate one 1000 TPD PAG Facility (Annual Data) |
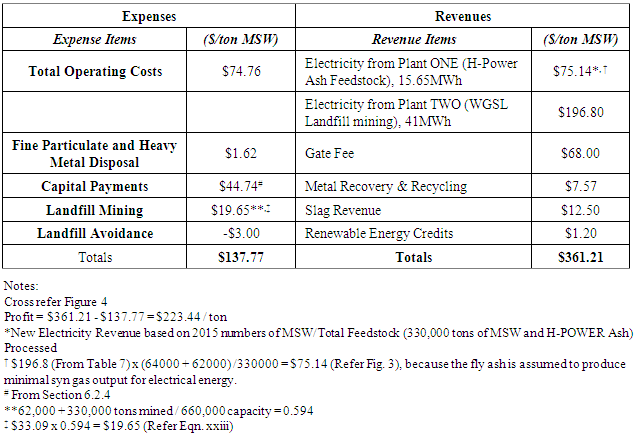
The other added benefit here is the reduction in landfill volume that would be consumed by fly ash. It would be reduced to a quarter of what is currently being sent to landfill, as well as immobilizing the heavy metals that are present in incinerator ash that could potentially leak into the environment. Should the city build two 1000 tpd facilities to process more MSW, they could generate more revenue from electricity by processing more MSW with a net benefit of up to $223.44/ton of feedstock (Table 10 / Figure 4). Depending on the city’s goals, whether it be landfill footprint reduction, or revenue generation, operators would need to adjust the ratio of MSW to fly ash input into the PAG facility. An input of higher MSW to ash would generate more electricity that leads to higher revenues, whereas a higher input of ash would reduce the footprint of the landfill consumed by incinerator residue.Table 10. Economic Analysis of 2 x 1000 tpd PAG IGCC Alter NRG Plant taking in MSW and H-POWER Ash Feedstock
 |
| |
|
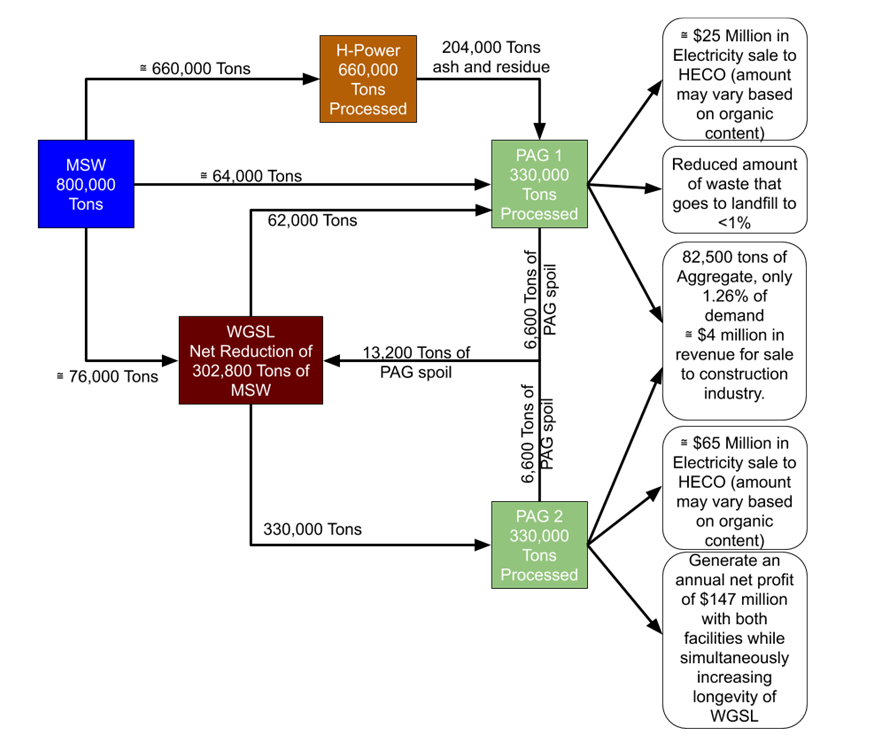 | Figure 4. Flow Chart Should C&C of Honolulu Operate two 1000 TPD PAG Facilities |
9.2. WGSL Feedstock Analysis in Conjunction with H-Power and One PAG Plant
9.2.1. Savings in Landfill Capacity
An ideal location for a PAG facility would be adjacent to the WGSL to use the MSW in the landfill as feedstock. If H-POWER only burns 90% of the MSW in Hawaii, and still sends 180,000 short tons of fly ash per year to WGSL to be landfilled, this leaves a remaining 80,000 tons of MSW that is still landfilled18, totaling approximately 260,000 tons of MSW landfilled. A more detailed table of MSW projections in Honolulu can be seen in Table 11 (Department of Environmental Services, City and County of Honolulu 2017), knowing that waste generation fluctuates as a result of different reasons. Table 11 shows that given a median or high projection for waste generated in Honolulu, additional waste management systems are needed. Should a PAG plant operate 365 days, 24 hours a day, an additional 105,000 tons of MSW19 can be taken from WGSL as feedstock to generate more electricity for sale while simultaneously increasing the longevity of WGSL. Based on current projections, WGSL is expected to have a lifespan until 2038. Using the already mined MSW from WGSL as feedstock would increase the capacity of WGSL and eliminate the need for another landfill to service Honolulu. Below are calculations using 2015 data of C&C of Honolulu MSW should MSW, fly ash, and existing MSW already in WGSL be used as feedstock for a PAG facility that operates at 90% capacity throughout the year, implying that the facility works 330 days a year (SMS Research Services, R.M. Towill Corporation 2017). See Eqn. xxi. Next, the 2015 data from the notes in Table 1 is used where a rounded number of 800,000 tons of MSW are assumed to be generated while 204,000 tons of ash and residue are produced by H-Power: 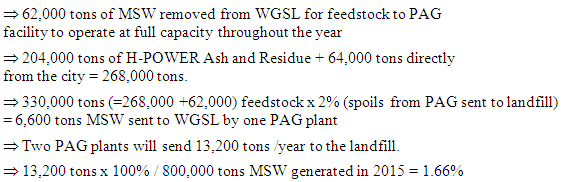 | (21) |
The amount of MSW sent to landfill would be reduced from over 30% sent to landfill to less than 2% of total MSW sent to landfill in Oahu. In addition, it would free up approximately 55,400 tons20 of MSW by volume from the WGSL landfill.Table 11. Waste Received at H-POWER and WGSL 2016-2040 (Department of Environmental Services, City and County of Honolulu 2017)
 |
| |
|
9.2.2. Slag Revenue from 2nd PAG Plant
Below are slag revenue calculations using the same data from previous calculations (Eqn. 22):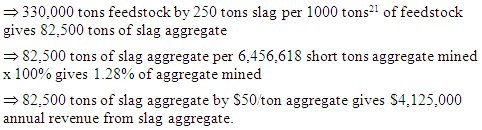 | (22) |
The potential revenue from slag sales from a PAG facility that operates a full capacity using the waste from H-POWER and MSW from WGSL as feedstock can generate an excess of $4 million annually.
9.2.3. Landfill Reclamation
Mining the WGSL feedstock would require what is called landfill reclamation. The purpose of landfill reclamation is to extend the life of a current MSW landfill. The costs of landfill reclamation are often recovered through the sale of processing the recovered materials for recyclables, usable soil, and burning (in this case using PAG) to generate electricity of revenue (Environmental Protection Agency 1997). Other benefits to landfill reclamation is a reduction in the landfill footprint, the avoidance of landfill closure costs due to the extended life, as well as the expenses avoided and saved from acquiring land and opening a new landfill. The downsides of landfill reclamation include having to manage hazardous materials that may have been previously disposed of in the landfill, controlling the release of gases and odors from decomposing MSW, affecting the structural integrity of the landfill, and increasing wear on the landfill equipment. Landfill reclamation has been successfully conducted in the past in Florida, New York, and Pennsylvania. At the Frey Farm Landfill in Lancaster County, PA, 300,000-400,000 cubic yards were mined from 1991-1996 for WTE fuel and to increase landfill capacity (Environmental Protection Agency 1997). Benefits from this project included reclaimed landfill space. A brief landfill reclamation cost estimate was conducted using the RSMeans cost of excavation per cubic yard and EPA volume to weight conversion factors of MSW. See Eqn. 23. This cost was added to Tables 9 and 10 economic analysis should the PAG feedstock consist of H-POWER ash and mined MSW.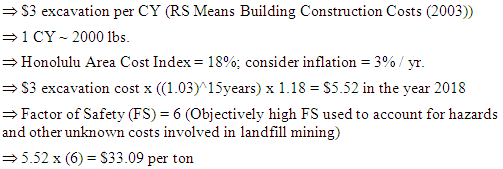 | (23) |
9.2.4. Optimum WTE Construction
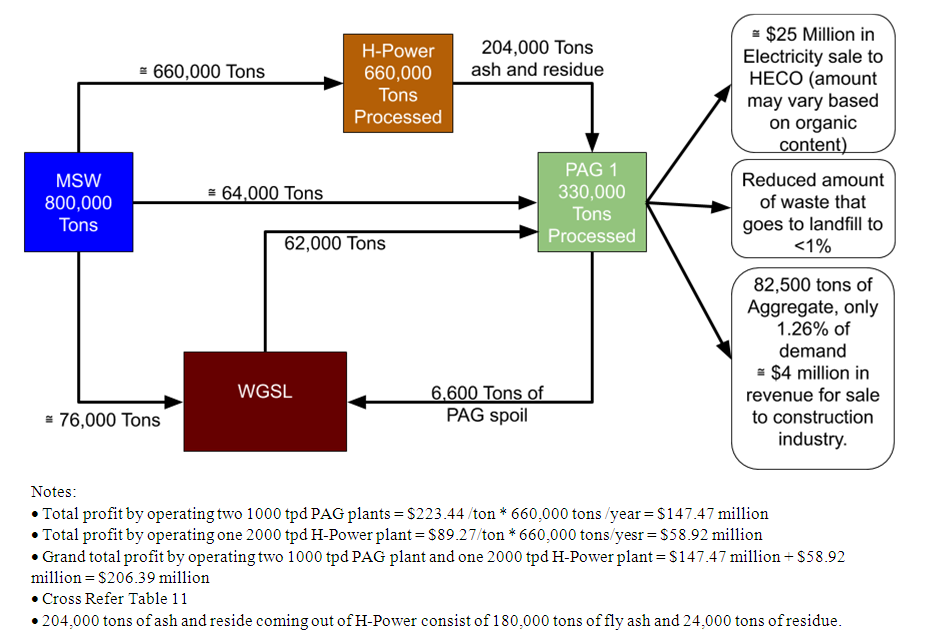
The optimal and ideal scenario regarding PAG in Oahu is to have two PAG facilities, one adjacent to H-POWER to process the ash normally sent to WGSL, and one adjacent to the WGSL to increase the longevity of the landfill (Table 10/Figure 4). This scenario would allow for more revenue generated by the City and County of Honolulu and would increase the landfill capacity of WGSL by over 302,800 tons annually. It would also decrease transportation costs of fly ash to WGSL, since there would be a PAG facility adjacent to H-POWER to dispose of the incineration byproduct. Furthermore, the total amount being set to landfill would become 1.66% of what is currently sent. Overall electricity produced daily would be 41MW (2nd plant) +15.58 MW (1st plant) = 56.58 MW, for a net revenue of $271.94 per ton from electricity sales. Once other forms of revenue are accounted for and expenses taken out, the profit of operating two PAG facilities would be $223.44, three and a half times the current profit from only H-Power22.Another benefit to a location on the west side of Oahu is the abundance of industrial and construction businesses located around WGSL and H-POWER that could use the slag for engineering and construction applications. PAG is also an opportunity that can be taken advantage of through a private venture such as the PVT landfill, since the technology can process the hazardous and C&D debris that the facility already receives.
10. Results
In 2015, over 843 million tons of MSW, Construction and Demolition (C&D) debris, and hazardous waste combined was generated by the United States alone (Environmental Protection Agency 2018). Of this waste, over 1.2 million tons of MSW was generated by Oahu in 2015. After recycling and incineration, approximately 268,000 tons of MSW ended up in Oahu’s WGSL landfill that has an expected capacity to last until 2038. As population increases, an estimated 1.37 million tons of MSW will be generated annually by the year 2040, and the number of processed MSW will increase (R.M. Towill and SMS Research Services 2017). The City and County (C&C) of Honolulu would need to consider building another landfill in the near future that would consume valuable and limited land, or consider other alternatives for handling waste that would prolong the life of the City’s existing landfill. In addition, it would face the community opposition that comes with landfill development that burdens a community with a landfill in their backyard. Hence, plasma arc gasification (PAG) can be a potential solution to this important issue. While PAG is not a new technology, it has emerged in recent years as a viable way to dispose of municipal solid waste with significant environmental and byproduct benefits that the state could profit from in multiple ways.
10.1. Handling Waste that Goes to Landfill
PAG has the capability to handle other waste streams such as C&D debris, hazardous wastes, medical wastes, automotive waste, biomass, incinerator ash, a benefit that current WTE methods do not have. C&D debris is currently disposed of at the private PVT landfill, while MSW is processed at the City and County of Honolulu’s H-POWER plant. There are currently no hazardous waste landfills on Oahu.23 Of the MSW generated, approximately 800,000 tons of MSW needs to be disposed of after recycling. Of this waste, an estimated 9.5% goes directly to WGSL, while the rest is processed (average 2000 tpd) by H-POWER for incineration. The incinerated material allows for H-POWER to generate 68.5 MW of electricity, about 10% of the State’s energy demand. However, approximately 204,000 short tons of fly ash and residue as a result of the incineration is sent to WGSL, resulting in about 43% of the City and County’s trash still ending up in a landfill. A PAG facility in Oahu would be able to process the fly ash and MSW that would end up in landfill. If MSW was processed by both H-POWER and an Alter NRG PAG facility, the amount of MSW and ash that would end up in landfill could be only 20,400 tons24, which is 5.9%25 of the present amount going to landfill. If two PAG plants are used, there is a net reduction of 302,800 tons. Thus, the landfill would slowly deplete over the years. This is a massive reduction in what is currently disposed of via landfill, which would significantly prolong the life of WGSL, firmly eliminating the need to build a new landfill.
10.2. Reduction in Emissions by PAG cf. H-Power
If constructed correctly, both traditional WTE plants such as H-POWER and new WTE plants can operate to meet and exceed the current environmental standards. However, there are environmental advantages that PAG has over incineration. Since PAG operates at such extremely high temperatures, the process destroys all waste so that the result is a syngas that can be used as fuel for energy, and an inert vitrified slag that is less likely to leach contaminants into groundwater and soil. The slag byproduct produced far exceeds the environmental standards for leachate and whatever contaminants that are left in the syngas, hydrogen and carbon monoxide mixture, are cleaned prior to use for energy conversion. The integrated gasification combined cycle system typically consists of a gas and steam turbine combination to create an optimal amount of electricity. Studies have shown that PAG emits CO2 emissions below average levels as compared to other WTE and landfill energy capture methods. If designed and operated correctly and optimally, NOx, CO, and other volatile organic compounds are typically lower than incineration. Another dangerous emission that is practically eliminated through PAG is the dioxins and furans, a known human carcinogen.
10.3. Electricity and Slag Aggregates Produced
The electricity generated from a PAG facility could then be sold for revenue. An Alter NRG G65 1000 tpd facility that operates 90% of the year could generate 41MW per 1000 tons of MSW. If sold to HECO at an average of $0.20 per kWh 330 days out of the year, $197 per ton of MSW can be generated or approximately $65 million dollars annually. Additionally, the slag byproduct is inert with no harm to the environment and can be sold for construction applications. With the cost of crushed aggregate at approximately $50 per ton, under the same plant conditions previously stated, one can generate $12.50 per ton of MSW processed. At full plant capacity, over 91,000 tons of slag aggregate can be generated and sold to the construction industry to generate over $4.5 million dollars a year. This amount of aggregate would satisfy less than 1.5% of the aggregate mined in 2013 in Hawaii, justifying the demand for aggregate. The environmental benefits and revenue generated from PAG does not come at a cheap price. A large price tag of approximately $363.8 million dollars is estimated to construct a 1000 tpd facility in Honolulu. In addition, with large application and experience minimal in the field of PAG and processing MSW, comes the increased risk and potential errors due to lack of technical expertise. This may lead to further increased capital and operating downtime and costs. However, the high cost of electricity in Hawaii along with the sale of the slag byproduct offsets the capital and estimated operating costs by a positive net revenue of $168 per ton of MSW. While the cost of electricity is felt on the end of the consumer, it creates an economic recipe for success for communities that can generate a constant supply of feedstock. In addition to the economic benefit, the environmental benefits could remove economic and environmental costs that the C&C of Honolulu would incur in the future from building another landfill and move closer to a greener future that is less dependent on fossil fuels.
10.4. Optimal Scenario and Profits
If it was possible to go back in time to pick between PAG and H-POWER, PAG would have been the better alternative. More energy and power could be generated with less trash, and less MSW and ash would have ended up in landfill, resulting in an extended lifespan of WGSL. In addition, the city would have had the option to dispose of hazardous waste and C&D debris generated on the island. H-POWER is an award-winning facility that has fulfilled its purpose to process MSW and reduce the volume of waste that is landfilled. With H-POWER’s recent upgrade in 2012, it makes sense to apply PAG with H-POWER and WGSL to extend the life of Oahu’s only operating MSW landfill. The analysis showed that the profit from running the existing 2000 tpd H-Power facility on Oahu is $89.27 per ton26. In comparison, a smaller, 1000 tpd Alter NRG plant generates $168 per ton if operated by a private company that does not incur the equivalent of Honolulu’s $75 per ton of legal, debt, and miscellaneous services.27 However, the reality is that one 1000 tpd PAG plant will intake 204,000 tons of ash and residue from H-Power, which will reduce its electricity output, because ash and residue have little to no syngas output. This will bring the total profit down from $167.95 per ton to $40.07 per ton.Should the C&C of Honolulu build a 1000 tpd PAG facility and process both ash and MSW as feedstock, they could generate profit up to $40.07 per ton of feedstock. This comes from revenue generated by slag byproduct, renewable energy credit, and the sale of electricity. Since H-Power is also operating, this $40.07 per ton is an additional profit for the city and therefore is added to the profit generated by H-Power. One 1000 tpd plant however does not take full advantage of the available waste in WGSL. Therefore, a second 1000 tpd PAG facility is advised to be constructed to maximize the use of resources. The second plant would generate an additional $183/ton in profit on top of the first plant. This makes the total additional profit of two 1000 tpd PAG facilities equal to $223.44 per ton. All told, with two PAG plants and one H-Power plant, the total profit = 312.74/ton, which amounts to $206 million per year.
11. Assumptions Made
The major assumptions made – which represent reality -- is that H-Power actually operates at 60% capacity, while Alter NRG operates at 90% capacity. In addition, the costs of residue are assumed absorbed in other operations. By further fine-tuning the estimates, the overall result for net profit or electricity consumed are not expected to change significantly.
12. Conclusions and Benefits
The reality is that the C&C of Honolulu cannot go back in time with the knowledge that we know now of the emerging methods of waste disposal. Hence, H-Power has to be a part of the solution. Officials need to look at the new technologies available today that will responsibly dispose of the waste generated. Through this study, depending how the C&C of Honolulu prioritize their goals, whether it be landfill footprint reduction, revenue generation, or electricity generation, PAG could be a viable option in achieving all three of these goals. The total electricity contributed by H-Power is already 68.5 MWh. The additional electricity generated by two PAG plants of 1000 tpd capacity, would be 15.65 MWh for the first PAG plant and 41 MWh for the second PAG plant. This equals a total of 125.15 MWh hours of energy input to the grid, representing a contribution by PAG plants of 56.65 MWh.The great advantages of adding two PAG plants are:• Reduction of landfill footprint deigned to deplete landfills by 302,800 tons /year.• No new landfill construction required ever again.• No need for a separate hazardous waste landfill.• Production of additional 56.65 MWh energy at a time when the world is looking to use sustainable sources of energy.28• Production of slag for concrete and asphalt aggregate, thereby reducing the environmental impact of mining aggregates.• Massive profit potential that can be used for other public projects.• Lesser emissions, in general, by PAG plants compared to H-Power.
Notes
1. The research was done in USA using imperial units.2. $68/ton calculated under the assumption that H-POWER is operating 330 days out of the year and processing on average 2000 tpd of MSW.3. Using 81.5% of 68.5 MW/h for one year at a rate of $0.20 kW/h.4. Via interview with Manny Lanuevo, Chief of Refuse, City and County of Honolulu.5. $3,131,006 x (2.5% to 3.5%) = $78,275 to $109,585.6. The use of Alter NRG in this paper is solely based on available information about the Alter NRG system. The authors have no vested interest in the Alter NRG system.7. principal + interest.8. H-Power sends 24,000 tons of residue annually, adding an additional $2 per ton, which is not taken into account at this part of the analysis.9. $100,000,000 -$1,127,162 – 11,160,000 – 37,572,079 = $50, 140,759.10. Note that $68/tonrevenue generated by intaking MSW at H-Power and not the fee that WGSL charges as their gate fee. WGSL charges $62 per ton as their gate fee.11. Largely because it varies continuously.12. Alter NRG is assumed to have a higher operating efficiency than H-Power.13. Using net benefit difference ($/Ton MSW) of Alter NRG (167.95) and H-Power (89.27).14. $167.95 – $75.96 = $91.99/ton.15. Compared to the average costs of aggregate in Hawaii at $63 a ton.16. = 5,180,000 metric tons from crushed stone + 679,000 metric tons from.17. This assumes that both the waste pulled from GSL and what comes from direct MSW is all organic matter.18. 10% MSW remaining from the 800,000 tons per year generated on Oahu.19. 105,000 tons = 2,000 tpd * 35 days from H-Power + 1,000 tpd Alter NRG System *35 days; the additional 35 days is owing to working 365 days a year instead of 330 days a year.20. (= 62,000 tons taken from WGSL minus 6,600 tons put back to WGSL).21. Refer eqn. 16.22. Using H-Power profit of $89.27 and two plant profits of $223.44 making the net profit for the city equal to $312.71 / ton.23. It was observed that the cost of shipping hazardous wastes to mainland USA would be avoided. These savings were not included in this study.24. 6,600 + 76,000 – 62,000 = 20,400 tons.25. = 20,400 tons / (204,000 + 76,000 +64,000) =5.9%.26. This agrees very closely with the official $90 per ton profit put out by the City and County of Honolulu.27. The “legal, debt, and miscellaneous services” is an undefined expense that does not stand to scrutiny. Even the person in-charge of H-Power could not explain this expense. The overall profits could be higher if this amount was transparent.28. Oahu’s energy demand is in the vicinity of 800 MWh.
References
| [1] | Alter NRG. (2010). “Plasma Gasification vs. Incineration”. Westinghouse Plasma Corporation, a Division of Alter NRG Corporation. <http://energy.cleartheair.org.hk/wp-content/uploads/2013/05/Incineration-vs-Plasma-Gasification.pdf> (accessed Oct. 15, 2018). |
| [2] | Alter NRG. (2016). “Alter NRG Plasma Gasification Environmental Performance.” Deep Dive Workshop on Waste-To-Energy Session C, 2016 Asian Clean Energy Forum. <http://suo.im/6a5avh> (accessed Sep. 8, 2018). |
| [3] | Alter NRG. (2018). “Our Company.” Alter NRG Westinghouse Plasma Corporation. <http://www.alternrg.com/about_us/> (October 12, 2018). |
| [4] | Beck, R W, “City of Honolulu Review of Plasma Arc Gasification and Vitrification Technology for Waste Disposal,” Final Report, R W Beck, 2003. |
| [5] | Covanta Holding Corporation. (2018). “Covanta Honolulu.” Covanta Powering Today, Protecting Tomorrow. <https://www.covanta.com/Our-Facilities/Covanta-Honolulu> (Aug. 21, 2018). |
| [6] | Department of Environmental Services, City and County of Honolulu (2005). “How the City Manages our Waste.” Department of Environmental Services. <http://www.opala.org/solid_waste/archive/How_our_City_manages_our_waste.html> (Aug. 21, 2018). |
| [7] | Ducharme, Caroline. (2010). “Technical and Economic Analysis of Plasma-assisted Waste-to-Energy Processes.” Dept. of Earth and Environmental Engrg., Earth Engineering Center, Columbia University. |
| [8] | Environmental Protection Agency. (2018). “Advancing Sustainable Management 2015 Fact Sheet.” <http://suo.im/5FfKBw> (Aug. 21, 2018.) |
| [9] | Environmental Protection Agency. (1997). “Landfill Reclamation.” <https://www.epa.gov/sites/production/files/2016-03/documents/land-rcl.pdf> (November 27, 2018). |
| [10] | Honolulu Construction and Draying Co. 2016. “Contractor Price Schedule, Aggregate Sizes and Prices.” <https://www.hcdhawaii.com/assets/docs/Aggregates-and-Sand-Price-Schdule-Oahu.pdf> (Oct 11, 2018). |
| [11] | Hosansky, D. (n.d.). “Plasma Arc Gasification,” Encyclopedia Brittanica, https://www.britannica.com/technology/plasma-arc-gasificationaccessed May 13, 2020. |
| [12] | Lanuevo, M. “Personnel Communication.” Department of Environmental Services, Chief of Refuse Division. Honolulu, Hawaii. September 26, 2018. |
| [13] | R.M. Towill Corporation, SMS Research Services. (2017). “Assessment of Municipal Solid Waste Handling Requirements for the Island of Oahu.” Department of Environmental Services, City and County of Honolulu. <http://www.opala.org/solid_waste/pdfs/WGSL%20Assessment%202017.pdf> (8-21-18). |
| [14] | RSMeans Online. 2017. “MASTERFORMAT City Cost Indexes Year 2017 Base. <http://suo.im/5G0kWj> (October 11, 2017). |
| [15] | SWANA Excellence Award Entry. (2014). “H-POWER: Honolulu Program of Waste and Energy Recovery.” Solid Waste Association of North America. <http://swana.org/portals/0/awards/2014/Waste%20to%20Energy/Honolulu%20_Waste-to-Energy.pdf> (Aug 21, 2018). |
| [16] | SWANA Excellence Award Entry. (2016). “2016 Excellence Award Entry, City and County of Honolulu, H-POWER: Honolulu Program of Waste and Energy Recovery.” Solid Waste Association of North America. <https://swana.org/Portals/0/awards/2016/winners/CityandCountyofHonolulu_WastetoEnergy.pdf> (Aug 21, 2018). |
| [17] | Tramontano, R, and Singh, A., Plasma Arc Gasification Application to the City and County of Honolulu, Hawaii, Tech. Rep., UHM/CEE/2018-01, University of Hawaii at Manoa, Dec 2018, 67 pp. |
| [18] | U.S. Department of Energy. n.d. “Plasma Gasification.” National Energy Technology Laboratory. <https://www.netl.doe.gov/research/Coal/energy-systems/gasification/gasifipedia/westinghouse> (8-27-18). |
| [19] | USGS. (2016). “2012-2013 Minerals Yearbook Hawaii [Advance Release].” USGS: Science for a Changing World. <https://minerals.usgs.gov/minerals/pubs/state/2012_13/myb2-2012_13-hi.pdf> (October 15, 2018). |
| [20] | Westinghouse Plasma Corporation. (2014). “Summary of Qualifications: Westinghouse Plasma Gasification Technology.” <http://suo.im/5G5WtT> (Aug 21, 2008). |

 Abstract
 Reference
 Full-Text PDF
 Full-text HTML