-
Paper Information
- Next Paper
- Paper Submission
-
Journal Information
- About This Journal
- Editorial Board
- Current Issue
- Archive
- Author Guidelines
- Contact Us
International Journal of Energy Engineering
p-ISSN: 2163-1891 e-ISSN: 2163-1905
2020; 10(3): 67-79
doi:10.5923/j.ijee.20201003.01

Nanoshaped CeO2 and SiO2 Supported Ru Catalyst for Plasma Catalysis Chemical Looping Reactions
 Abstract
 Reference
 Full-Text PDF
 Full-text HTML
Rajagopalan V. Ranganathan1, Zhongqi Liu2, Harigovind Menon1, Shaon Talukdar1, Ruigang Wang2, Mruthunjaya Uddi1
1Mechanical Engineering, The University of Alabama, Tuscaloosa, AL
2Metallurgical and Materials Engineering, The University of Alabama, Tuscaloosa, AL
Correspondence to: Mruthunjaya Uddi, Mechanical Engineering, The University of Alabama, Tuscaloosa, AL.
| Email: |  |
Copyright © 2020 The Author(s). Published by Scientific & Academic Publishing.
This work is licensed under the Creative Commons Attribution International License (CC BY).
http://creativecommons.org/licenses/by/4.0/

Chemical Looping Reaction is a key strategy to achieve both emission reduction and carbon utilization while producing various value-added chemicals, through redox reactions. Here we study the effect of nanoshape ceria supported Ru catalysts for plasma assisted Chemical Looping Reforming reduction step coupled with water splitting oxidation step reactions in the temperature range 150°C to 400°C at 1 atm pressure. The oxygen carrier/catalyst combination materials used are Ru/CeO2 nanorods (NR), Ru/CeO2 nanocubes (NC), Ru/SiO2 nanospheres (NS), and Ni-based perovskite mixed with CeO2. NRs and NCs showed the best catalytic performance followed by Ni-based perovskite and NS. Differences in the selectivity and reactivity for the NRs and NCs were noticed. The NCs showed slightly higher selectivity towards H2 formation during reduction step and lesser carbon deposition. From the analysis of data and literature, it is proposed that the spillover of species such as H adatoms and CHx radicals after activation at Ru sites into the CeO2 supports and lattice O mobility may be slightly faster in the case of NCs. During the oxidation step, the NR and NC materials showed increased H2 production by a factor of more than 4 when compared to Ni based perovskite material.
Keywords: Chemical looping reforming, Water splitting, Plasma catalysis, Nanoshaped ceria
Cite this paper: Rajagopalan V. Ranganathan, Zhongqi Liu, Harigovind Menon, Shaon Talukdar, Ruigang Wang, Mruthunjaya Uddi, Nanoshaped CeO2 and SiO2 Supported Ru Catalyst for Plasma Catalysis Chemical Looping Reactions, International Journal of Energy Engineering, Vol. 10 No. 3, 2020, pp. 67-79. doi: 10.5923/j.ijee.20201003.01.
Article Outline
1. Introduction
- Carbon Capture and Utilization (CCU) [1] is the process of removing CO2 and CH4 from sources like oil wells, power plants and landfills, and further processing them into fuels, fertilizers, and various value-added chemicals. Landfill gas [2] mainly contains CO2 and CH4, which could be processed to yield syngas, a mixture of CO and H2. The process is known as Dry Reforming of Methane (DRM). DRM [3,4] is an endothermic process, and the product syngas is used for the production of synthetic gasoline [5] and methanol [6].Traditionally, Steam Methane Reforming (SMR) [7] has been used to produce syngas from the reaction of CH4 with H2O, and it could be further processed through the Water Gas Shift (WGS) reaction to produce H2
 CO2 produced during the WGS reaction is extracted with high energy penalties by pressure swing adsorption process for CCU purposes. The external heat provided for endothermic SMR is CO2 emission intensive. Since, the processes- DMR and SMR- involve numerous steps with heavy capital investment, they are certainly not an energy efficient way of producing H2, syngas or achieving CCU. Producing H2 and syngas through low-temperature isothermal Chemical Looping (CL) reactions [8-10] is an alternative option to improve both the efficiency and cost-effectiveness with low energy penalty to achieve CCU [11]. The vital concern reported over CCU is the energy consumption associated with the conversion from CO2 and CH4 to useful products [5] typically carried above ~850°C since the stable molecule CH4 is very difficult to activate even catalytically. However, lower operation temperature enables developing scalable efficient CL reactors which can utilize renewable energy (solar and wind) and the advanced chemical looping material structures are more durable. This could be made possible by adopting two important technologies: (1) fabricating advanced CL materials [12-14], and (2) applying non-equilibrium plasma to OC [9,15,16]. Here, we study Chemical Looping Reforming with Water Splitting (CLRWS) with application of these both technologies.CeO2 supported metal catalysts have been demonstrated to show prominent low-temperature catalytic performance, such as Pt on CeO2 nanorods (NRs) [17]. This is due to several unique characteristics of CeO2 supports such as rapid redox cycling ability, high oxygen mobility and excellent oxygen storage capacity [18-20]. The precise shape-controlled synthesis at nanoscale level further pushed forward the activity and selectivity of CeO2-based metal catalysts to a new climax [21,22]. Li et al. [23] used Ru/CeO2 NRs for testing CO oxidation and reported a maximum CO conversion of 100% at temperatures below 400°C. Recently, several applications in plasma assisted catalytic reactions or Plasma-Catalysis (PC) [24-26] and their synergistic effects to enhance the performance of the catalyst has been reported. In a previous publication [9], we applied Dielectric Barrier Discharge (DBD) plasma over Ni-based perovskite catalyst mixed with CeO2, to lower the operating temperature of CL process to as low as 150°C with high yields of syngas and H2, leading to a significant performance improvement. A simple thermodynamic analysis using the measured plasma power (2-6 W), showed that the operation at 400°C leads to the highest thermodynamic efficiency and yield, which fully reap the benefits of PC-CL.Here, we study PC assisted CLRWS (or PC- CLRWS) cycle over chemical looping material containing nanoshaped catalysts in the temperature range 150 - 400°C. We explore the morphology-dependent CL performance of Ru metal catalysts supported on various nanoshaped CeO2 (NRs, NCs) in a non-equilibrium electric discharge plasma environment. SiO2 (nanosphere or NS) supported Ru catalyst was also included for comparing the effect of support reducibility (reducible CeO2 vs. irreducible SiO2) on the catalytic activity of Ru catalyst.
2. Experimental
2.1. Preparation
2.1.1. Chemicals
- Cerium (III) nitrate hexahydrate (Acros Organics, 99.5%), sodium hydroxide pellets (VWR, 99%), ammonia solution (NH3·H2O, BDH, 28-30%), tetraethyl orthosilicate (TEOS, Acros Organics, 98%) and Ruthenium(III) nitrosylnitrate (Alfa, Aesar, Ru 31.3% min.) were used as raw materials without further purification.
2.1.2. Synthesis of Support Material
- The CeO2NR and CeO2NC supports were synthesized using a seed-mediated hydrothermal method [27]. Briefly, 88 mL of 0.1 M Ce(NO3)3 solution was added into a 200 mL Teflon lined autoclave, followed by adding 8 mL of 6.0 M NaOH solution. After stirring the mixture for ~15 s, the autoclave was sealed tightly and then transferred into a programmable box furnace. The hydrothermal reactions were carried out at 90°C for 48 h to obtain CeO2NR and 150°C for 48 h to obtain CeO2NC, respectively. The synthesis of SiO2NS supports was based on a modified Stöber method [28]. A typical procedure involved introducing a mixture of 158 mL absolute ethanol, 7.8 mL ammonia solution, and 2.8 mL deionized water into a 250 mL round-bottom flask and maintained at 50°C while stirring. Then, 5.8 mL of tetraethyl orthosilicate (TEOS) was added into the solution dropwise with continued stirring at 50°C for 24 h. SiO2NS supports were finally obtained by drying the white solution at 70°C for 24 h.
2.1.3. Catalysts Preparation
- All the supported ruthenium catalysts with a 1.0 wt.% Ru loading were prepared by a precipitation-deposition method. In detail, the as-synthesized CeO2NR, CeO2NC or SiO2NS powders (1.0 g) were suspended in 100 mL of 1.0 mM Ru(NO)(NO3)3 aqueous solution under magnetic stirring. Then, 0.5 M NH3·H2O was added dropwise into the mixture above until the pH achieves ca. 9. After aging at 80°C for 4 h, the precipitates were filtered and washed with deionized water and ethanol. The as-prepared catalyst powders were kept in a drying oven at 80°C overnight and calcined in a box furnace at 300°C for 5 h. Finally, all resultant powders were further reduced in a tube furnace under 5 vol.% H2/95 vol.% He atmosphere at 300°C for 5 h. The prepared catalysts were named as 1Ru/CeO2NR, 1Ru/CeO2NC and 1Ru/SiO2NS, respectively.
2.2. Characterization of Material
- Powder X-ray diffraction (XRD) patterns were recorded at 2θ = 10-90° on a Philips X’Pert MPD diffractometer with Cu-Kα radiation (λ = 1.5405 Å) operating at 45 kV and 40 mA. Step size of 0.01° and a dwell time of 1.0 s were used for data collection. The recorded patterns were further analyzed using PANalytical X'pert HighScore software for phase identification and the average crystallite size was calculated through the Scherrer equation.Raman spectra were measured on a Horiba LabRam HR800 microscope equipped with a 100× LWD objective (Olympus) and an 1800 lines/mm grating system. Diode-Pumped Solid-State (DPSS) laser system (Laser Quantum MPC6000) tuned at λ=532 nm was used for excitation. The exposure time and the accumulation number were set to 100 s and 10 s respectively for recording each spectrum in the range of 200 - 1200 cm-1. X-ray photoelectron spectroscopy (XPS) was carried out using a Kratos Axis DLD spectrometer with monochromatic Al Kα radiation under UHV, operating at a base pressure of < 8x10⁻¹⁰ Torr. The photoelectron emission spectra were recorded using an Al-Kα (hν = 1486.6 eV) operated at 15 keV and 10 mA. The carbonaceous C 1s line (284.6 eV) was used as an internal standard to calibrate the binding energies. The spectra were processed using the CasaXPS software.Transmission electron microscopy (TEM) and high-resolution TEM (HRTEM) of the prepared and redox cycled catalysts were performed on a FEI Tecnai F20 microscope operating at 200 kV. All of the investigated samples were sonicated in ethanol for 15 min and then dropped onto an ultrathin carbon coated Cu grid (Ted Pella Inc.).
2.3. Experimental Layout
- Details of the experimental setup and procedure are described in Ranganathan et al. [9]. Briefly, experimental layout used to run PC- CLRWS mainly consists of five parts: (1) gas delivery system; (2) central quartz reactor tube; (3) experimental control section; (4) flue gas analysis system and (5) plasma setup. The gas delivery system consists of gas cylinders, mass flow controllers and valves to control the flow into the reactor tube. The central quartz reactor tube consists of two concentric tubes: (1) inner tube and (2) outer tube. The inner tube is a 0.25” tube with an expansion section of diameter 0.5” and 2” in length where the material to be tested is placed. The outer tube is a 1” tube closed on one side. The entire setup is placed inside a split tube furnace which can be heated to 1200°C. Thermocouples are fixed to the furnace at three points: top, center, and bottom. The experimental control section consists of National Instrumentation Data Acquisition (DAQ) card and MATLAB program to control various valves and Mass Flow Controllers (MFCs). The flue gas analysis system is the Extrel Quadrupole Mass Spectrometer (QMS) which is used to measure the temporal evolution of various species with a time resolution of less than 0.3 s. The plasma setup contains two co-axial electrodes in a Dielectric Barrier Discharge (DBD) configuration. A ceramic tube enclosed inner electrode is placed inside the inner tube passing through to the expansion section. The outer electrode is wound around the circumference of the expansion section of the inner tube. Both the electrodes are connected to the PVM/DDR plasma driver (PVM500-2400). High voltage probes are used to measure the voltage in both the electrodes and used to calculate the plasma power supply [9]. The CL material to be tested is placed directly in the plasma, in the expansion section of the inner tube. The PC-CLRWS experiments were conducted with four different CL materials: (1) 1%- Ru/CeO2 NR; (2) 1%- Ru/CeO2 NC; (3) 1%-Ru/SiO2 NS; and (4) La0.9Ce0.1NiO3+ Ceria (50: 50 by mass). A redox cycle consists of (1) reduction step for 3 min; (2) purge step for 4 min; (3) oxidation step for 1 min, and; (4) purge step for 4 min. During the reduction step, a mixture of 0.4 molar ratio CH4 and CO2 was used as reactant. The flow rates of CH4, CO2 and Ar used were 60, 150 and 140 standard cubic centimeter per minute (sccm) summing up to a total flow rate of 350 sccm. During the oxidation step, H2O and Ar were used (Total flow rate = 350 sccm). During the purge step, 350 sccm argon was flowed. Two different cases were compared (1) CL material without plasma (CL) and (2) CL material with plasma (CL+PC). Negligible reactions were observed for experiments with only plasma and no CL material. The temperature range used for the experiments was 150 - 400°C at atmospheric pressure. 200 mg of CL material was used for all experiments. For the PC experiments, the plasma was kept on continuously during the experiments. Experiments were also done for the cases (a) no plasma, no nanomaterials (b) plasma only, and no nanomaterials. No significant conversions or reactions of CH4 were observed in the temperature range 150-400°C. Therefore, such results are not reported here.
2.4. Parameters Investigated
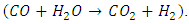
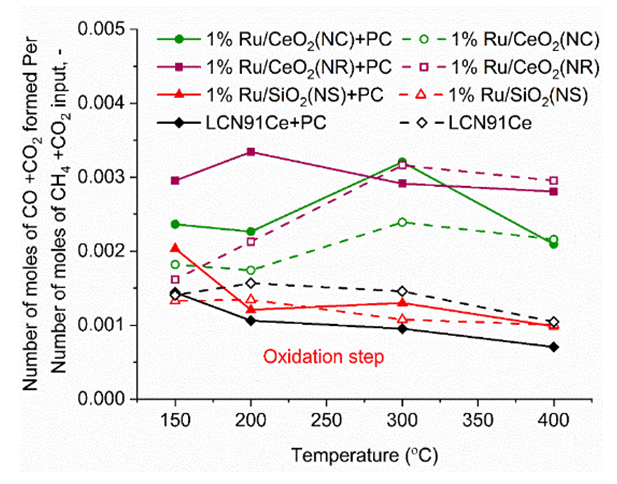
- Conversion, yield and selectivity were used as major parameters to estimate the catalyst performance with and without plasma. Conversion of a particular species is the ratio of species that got consumed to the total input. The yield of a particular species is the ratio of the amount of the formed species to the total input. The selectivity of a particular species is the ratio of the amount of the formed species to the redox step input that got consumed. The reduction step input, for both yield and selectivity calculations, would be CH4 and CO2 for CO formation and CH4 for H2 formation. Eqns. 1-6 represent the conversion, selectivity and yield for different species. The experimental data was tested for carbon conservation. The integrated inflow of carbon in the form of CH4, CO2 during the reduction step is compared with the sum of integrated carbon outflow as CO, CO2, CH4 during the reduction step and the CO2 during the oxidation step. The carbon deposited during the reduction step is seen as CO2 generation during the oxidation step. Eqn. 7 was used to check for carbon balance, for one complete redox cycle. The carbon deposited was also quantified by integrating the total moles of CO2 observed during oxidation step and normalizing it with the total carbon inflow in the form of CO, CO2, CH4 during the reduction step. Details of integrating the total moles from QMS measured temporal mole fractions of species are explained in Ranganathan et al. [9].
 | (1) |
 | (2) |
 | (3) |
 | (4) |
 | (5) |
 | (6) |
 | (7) |
3. Results and Discussion
3.1. X-ray Diffraction and Raman Spectroscopy Analysis
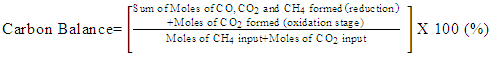
- The phase and crystal structure of the as-prepared catalysts were investigated by X-ray diffraction (XRD) shown in Fig. 1a. The XRD patterns of 1Ru/CeO2NR and 1Ru/CeO2NC catalysts displayed the diffraction peaks at 28.5°, 33.0°, 47.6°, 56.3°, etc. that correspond well to (111), (200), (220), (311), etc. lattice planes of face-centered cubic CeO2 (JCPDS #34-0394, space group Fm3m) with the fluorite structure. However, no diffraction peaks of ruthenium containing phase were detected from both CeO2NR and CeO2NC supported Ru catalysts, which can be attributed to the low loading (1 wt.%Ru) content of the Ru species. In addition, other reasons such as the small crystallite size or high-dispersion of the Ru species can also help explain the absence of Ru related characteristic X-ray peaks. The XRD pattern of 1Ru/SiO2-NS catalyst showed a broad peak at around 2θ = 23.0°, indicating the amorphous feature of SiO2. Note that the diffraction peaks at 38.3°, 42.2°, 44.0° and 69.4° correspond to the Ru0 phase (JCPDS #06-0663, space group P63/mmc), which was clearly visible over the SiO2NS support. This observation excluded the possibility of the detection limit, and in turn revealed that CeO2 supports were favorable to improve the dispersion of the Ru species by diffusing the ruthenium into the CeO2 lattice or forming a surface Ru-O-Ce solid solution [23]. The mean crystallite size of the 1Ru/CeO2NR and 1Ru/CeO2NC catalysts were calculated by the Scherrer equation, and found to be 6.3 nm and 24.9 nm, respectively.The elemental coordination environment and lattice defects of the supported Ru catalysts were examined by Raman spectroscopy. As shown in Fig. 1b, the Raman spectra of both 1Ru/CeO2NR and 1Ru/CeO2NC catalysts showed the most intense peak at 459 cm-1, which is the symmetric F2g vibration mode of the CeO2 fluorite lattice. While the peaks centered at 595 cm-1 for the 1Ru/CeO2NR catalyst and 597 cm-1 for the 1Ru/CeO2NC catalyst represents the defect-induced mode of CeO2, arising from the presence of oxygen vacancies. Worthy of mention is that the bands at 256 cm-1 due to the second-order transverse acoustic (2TA) mode of CeO2 [29], can be clearly observed on the CeO2NR supported Ru catalyst, whereas, it is unnoticeable on the CeO2NC supported counterpart. This observation indicates that the 1Ru/CeO2NR catalyst showed higher oxygen vacancy concentration and/or larger degree of structural disorder caused by the metal loading (i.e. metal ion incorporation/doping) [30-32]. Additionally, the peaks at 733 cm-1 and 970 cm-1 for the 1Ru/CeO2NR catalyst, as well as 705 cm-1 and 989 cm-1 for the 1Ru/CeO2NC catalyst merit attention. Those Raman features cannot be assigned to either CeO2 or RuOx species, but have been widely observed and accepted as the formation of the Ru–O–Ce bond attributed to the interaction between Ru species and CeO2 supports [33-35]. In the case of the 1Ru/SiO2NS catalyst, the Raman spectrum only shows two weak peaks at 390 cm-1 and 475 cm-1 that are attributed to the bending mode of oxygen in n-membered rings (n > 4) and the breathing mode of 4-membered rings from SiO2 supports [36].
 | Figure 1. (a) XRD patterns of CeO2 and SiO2 supported Ru catalysts; (b) Raman spectra of CeO2 and SiO2 supported Ru catalysts. (Color lines seen in online version only) |
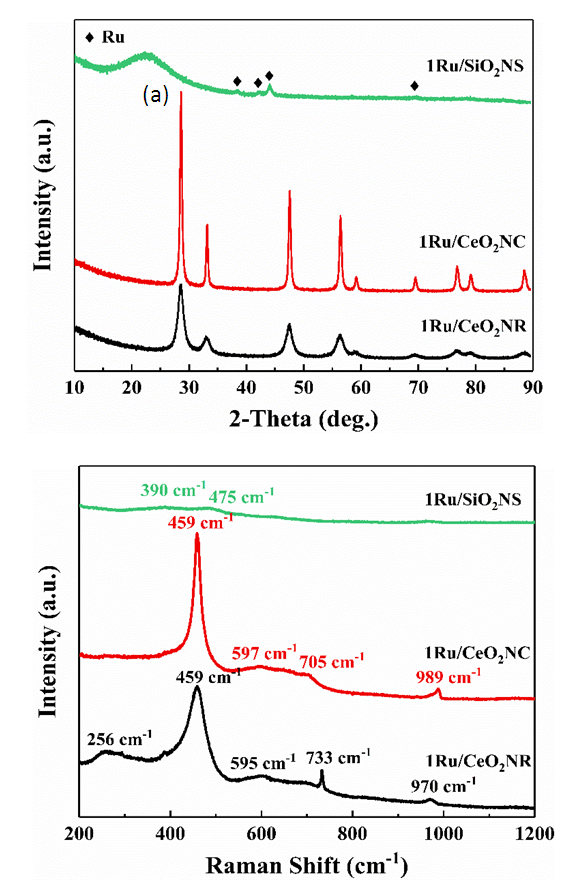
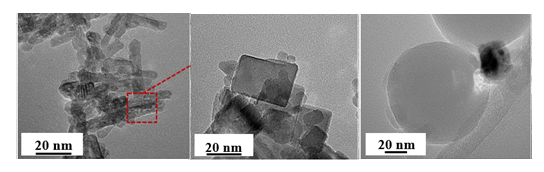
 | Figure 2. TEM images of (a) 1Ru/CeO2NR, (d) 1Ru/CeO2NC, (g) 1Ru/SiO2NS and HRTEM images of (b, c) 1Ru/CeO2NR, (e, f) 1Ru/CeO2NC, (h, i) 1Ru/SiO2NS catalysts |
3.2. XPS Analysis
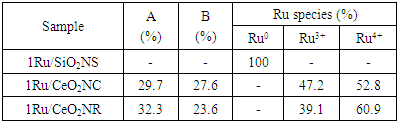
- The composition and valence states of the surface elements were examined by XPS. Fig. 3(a) shows the elemental survey scan of each sample, which confirms the presence of oxygen, cerium, carbon and ruthenium in CeO2NR and CeO2NC supported catalysts surface, as well as oxygen, silicon, carbon and ruthenium in SiO2NS supported counterparts. Fig. 3(b) illustrates the O 1s spectra that were fitted with the Gaussian-Lorenz feature and a Shirley-type background. For the 1Ru/SiO2NS catalyst, only one peak located at 531.7 eV can be identified, which corresponds to the oxygen coordinated to Si [37]. The O 1s spectra of CeO2 supported catalysts can be fitted into two peaks that associated with the primary lattice oxygen OL feature (529.0 eV for 1Ru/CeO2NR and 529.1 eV for 1Ru/CeO2NC) and the additional oxygen vacancies OV feature (530.8 eV for 1Ru/CeO2NR and 530.7 eV for 1Ru/CeO2NC). However, the latter peak can be correlated to the surface adsorbed oxygen or hydroxyl groups as well [38]. The ratios of OV/(OV + OC) are typically used to estimate the surface oxygen vacancy concentration, and as listed in Table 1, more oxygen vacancies were generated on the 1Ru/CeO2NR catalyst surface compared with the 1Ru/CeO2NC catalyst, which is consistent with the Raman results. Fig. 3(c) shows the Ru 3d core-level spectra, as can be seen from the deconvoluted curves, the existing form of the surface Ru species among three catalysts are significantly different. The BE value of the Ru 3d5/2 peak in 1Ru/SiO2NS catalyst centered at 278.8 eV indicates a preferential metallic Ru0 state, while the Ru 3d5/2 of both 1Ru/CeO2NR and 1Ru/CeO2NC catalysts can be divided into two different peaks at ~281.1 eV and ~282.0 eV corresponding to a mixed states of Ru3+ and Ru4+ [39,40]. A relative surface quantification of Ru3+ and Ru4+ over CeO2NR and CeO2NC supported catalysts are shown in Table 1. In contrast, the 1Ru/CeO2NR catalyst possesses higher contents of Ru4+ than the 1Ru/CeO2NC catalyst. According to the literature, the oxidation states of Ru have been found to strongly influence the reaction mechanisms and product formation. Rabe et al. [41] investigated the reforming of methane to synthesis gas over the 5% Ru/γ-Al2O3 catalyst and revealed that CO2 formed over the oxidized ruthenium sites while the reduced Ru sites yielded CO. Sun et al. [42] also reported that the higher oxidization states of the Ru can give rise to a syngas producing selectivity and efficiency. In addition, the deconvolution of Ce 3d XPS spectrum are shown in Fig. 3 (d and e). Typically, the resolved three 3d5/2 peaks featured at around ~882.0 eV (v), ~888.5 eV (v’’), ~897.8 eV (v’’’) and associated three Ce 3d3/2 located at ~900.3 eV (u), ~906.8 eV (u’’), ~916.1 eV (u’’’) are assigned to Ce4+ state, while the peaks located at BE of ~882.9 eV (v’) and ~901.2 eV (u’) were characteristics of Ce3+ 3d5/2 and Ce3+ 3d3/2. Quantitative analysis of the relative Ce3+ concentration to the total Ce concentration were derived from the following equation using each integrated peak area,
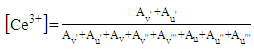 | (8) |
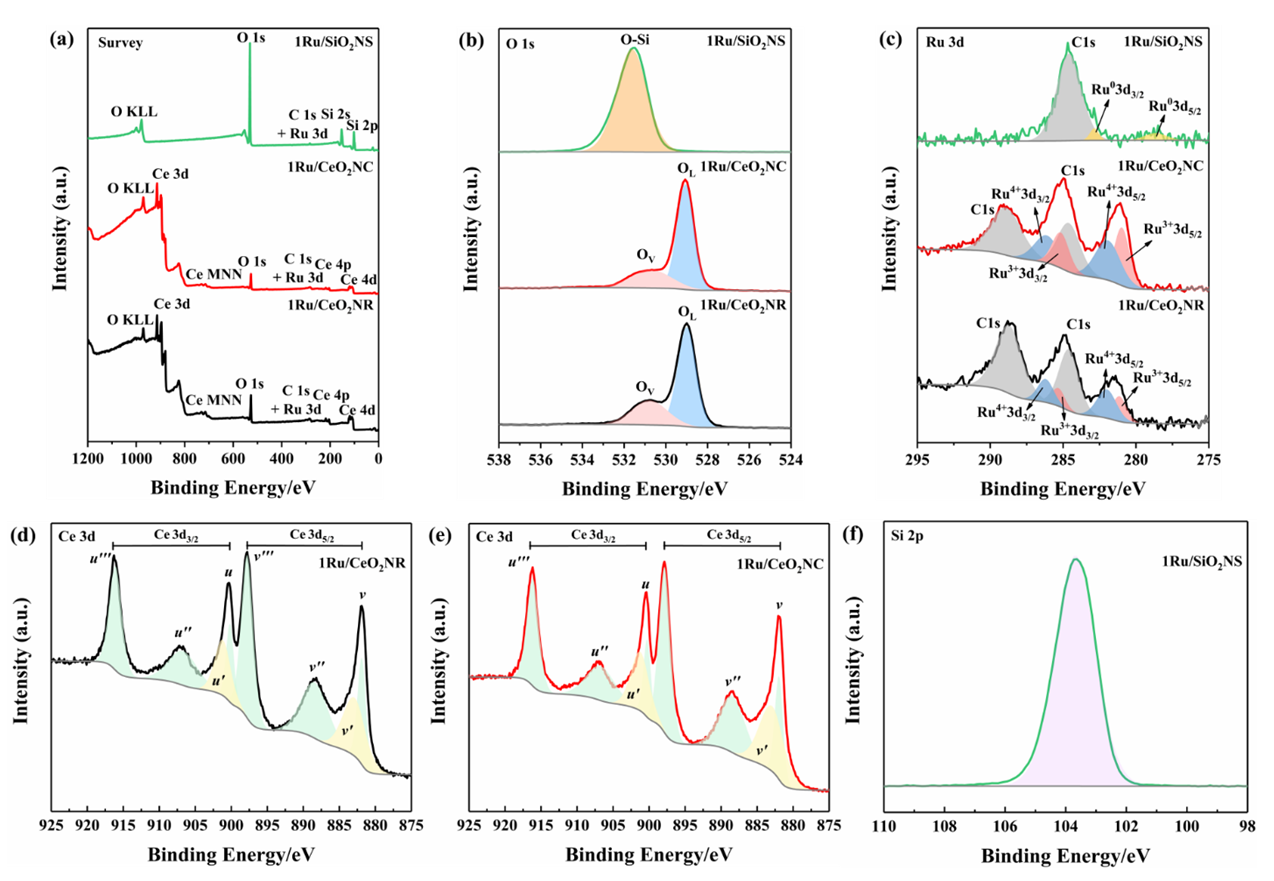 | Figure 3. Experimental and fitted XPS spectra of all catalysts: (a) survey scan (b) O 1s (c) Ru 3d, (d, e) Ce 3d and (f) Si 2p. (Color lines seen in online version only) |
3.3. Reduction Step
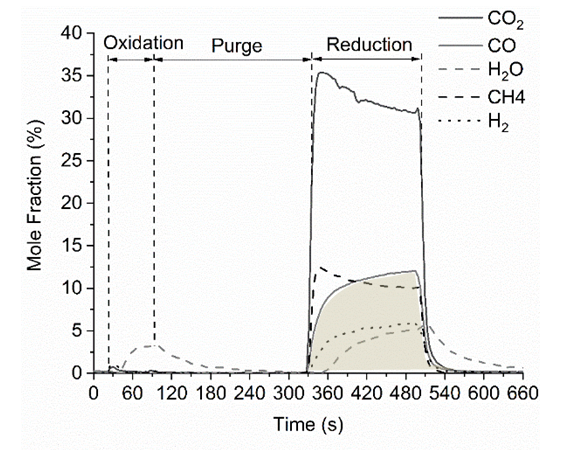
- Fig. 4 shows a sample data of PC-CLRWS cycle. The cycle sequence is oxidation step (H2O + Ar flow for 1 min), purge (Ar flow for 4 min), reduction step (CH4+ CO2 flow for 3 min) and purge step (3 min). This cycle repeats periodically in the experiments. During the oxidation step, the flow of water with argon leads to the formation of H2 and CO2. The CO2 observed during the oxidation step is due to the carbon deposition during the previous reduction step. During the reduction step, the CH4 and CO2 flow leads to the formation of CO, H2, and H2O. In Fig. 4, the shaded area represents the integrated area under a species profile, which is used to calculate the number of moles formed during the reduction cycle of that species.
 | Figure 4. PC-CLRWS cycle of Ru/CeO2 NR at 400°C |
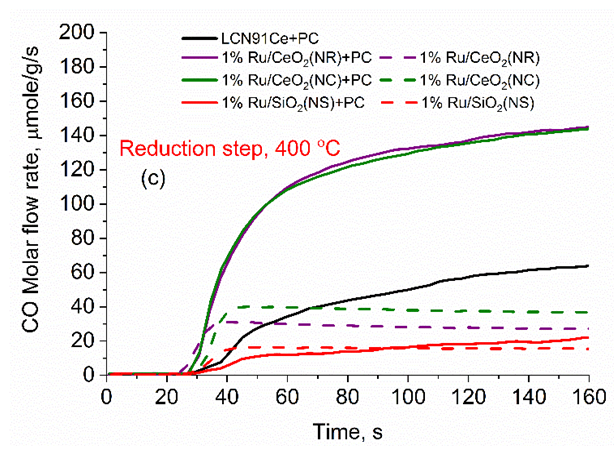 | Figure 5. Measured temporal flow rate of CO during reduction step at 400 C. (Color lines seen in online version only) |
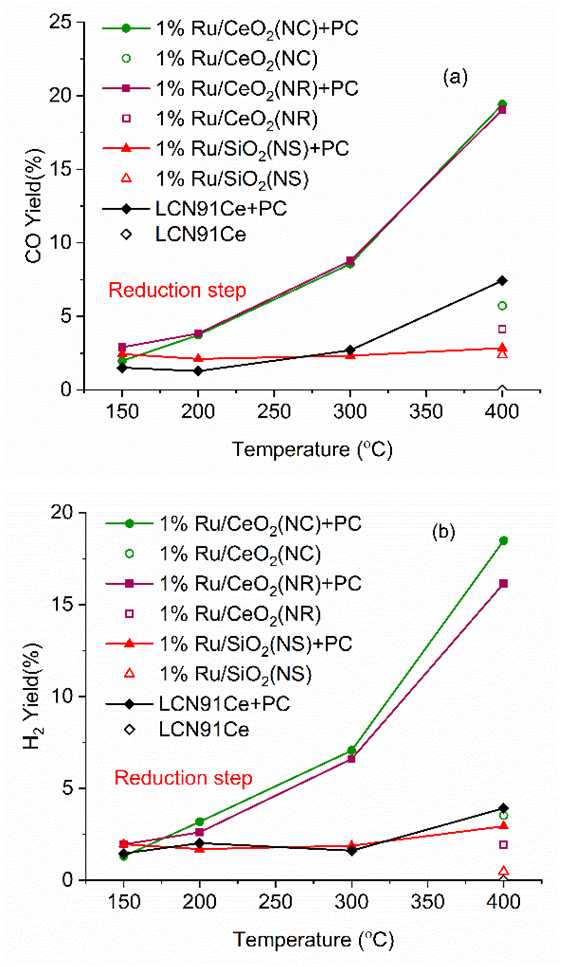 | Figure 6. (a) CO (b) and H2 yield vs. temperature for different materials (PC- Plasma Catalysis case). (Color lines seen only in the online version) |
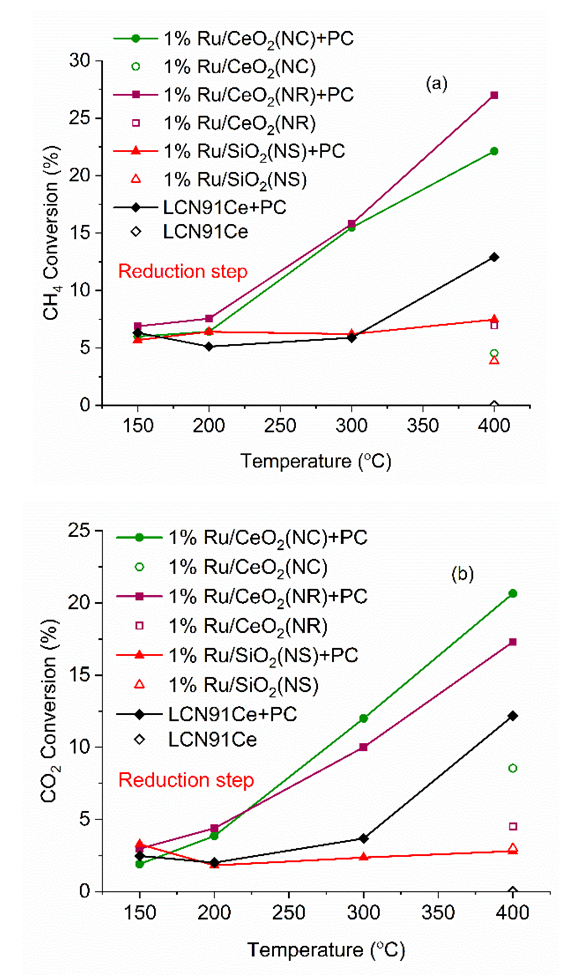 | Figure 7. Conversion CH4 (a) and CO2 (b) vs. temperature for different materials (PC- Plasma Catalysis case). (Color lines seen only in the online version) |
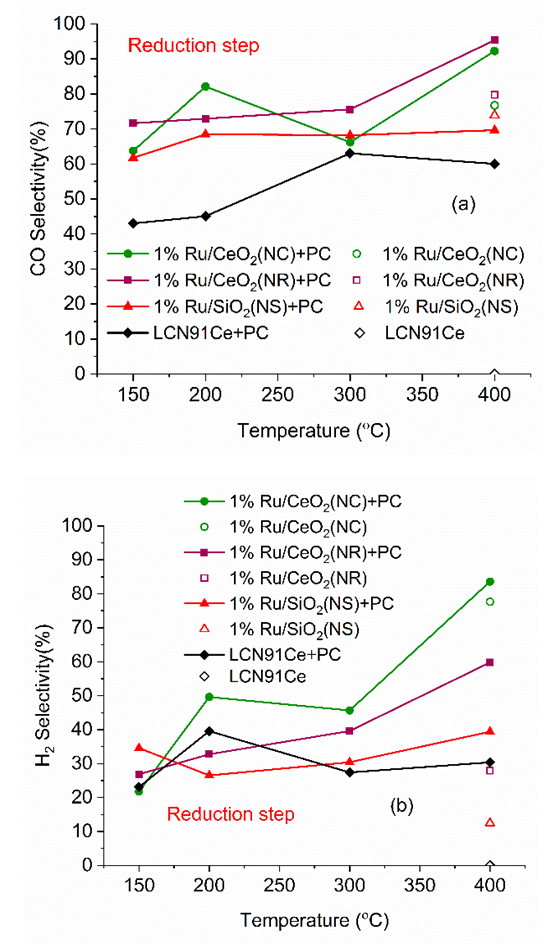 | Figure 8. Selectivity CO (a) and H2 (b) vs. temperature for different materials (PC- Plasma Catalysis case). (Color lines seen in online version only) |
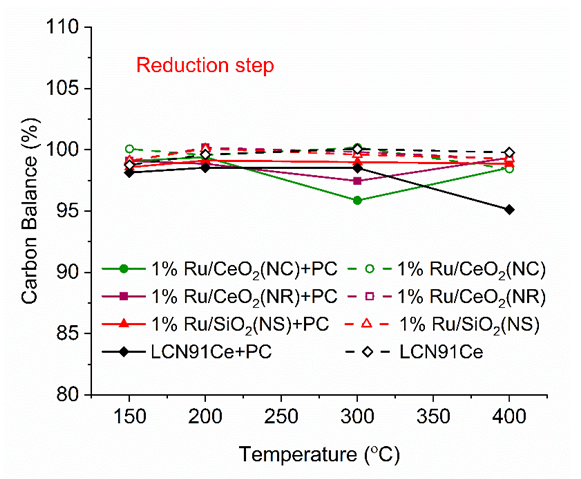 | Figure 9. Carbon balance vs. temperature for different materials (PC- Plasma Catalysis case). (Color lines seen in online version only) |
3.4. Oxidation Step
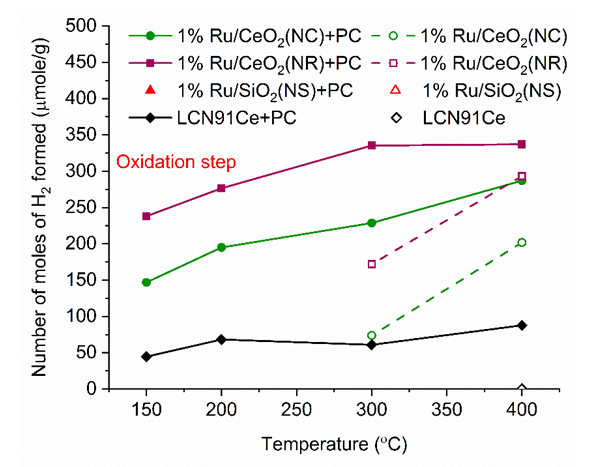
- In Fig. 10, the total number of moles of H2 formed during the oxidation step is plotted for different materials. For case 1 (CL materials only) experiment, the 1%Ru/CeO2 NC catalyst showed H2 formation by water splitting starting from 150°C, while the 1%Ru/CeO2 NR catalyst could generate H2 starting at 200°C. In addition, the 1%Ru/CeO2 NR manifested better catalytic performance toward water splitting reaction during the oxidation step. The 1%Ru/SiO2NS and Ni-based perovskite catalysts showed no H2 formation. For case 2 PC+CL experiments, the low-temperature catalytic water-splitting performance for both the 1%Ru/CeO2 NR and 1%Ru/CeO2 NC catalysts were promoted greatly. The 1%Ru/CeO2 NR catalyst still exhibited the highest hydrogen formation among the as-discussed catalysts with plasma assistance, which even achieved a maximum of ~337 µmole/g at 300°C. By contrast, the 1%Ru/CeO2 NC catalyst showed lesser hydrogen formation than the CeO2NR supported counterpart, which reached a maximum of ~293 µmole/g at 400°C. The Ni-based perovskite catalysts was even less active, and showed H2 formation of ~44-87 µmole/g over the temperature range. 1%Ru/SiO2NS is not plotted in Fig. 10, as it did not show water splitting H2 due to lack of oxygen carrier.
 | Figure 10. Number of moles of H2 formed during oxidation step vs. Temperature for different materials (PC- Plasma Catalysis case). (Color lines seen in online version only) |
 | Figure 11. HRTEM images of (a) 1Ru/CeO2NR, (b) 1Ru/CeO2NC, (c) 1Ru/SiO2NS CL materials after experiments |
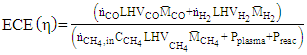 | (9) |
 and
and  are the molar outflow rates of CO and H2, respectively,
 and
and  are the molar masses of CO, CH4 and H2, respectively,
  is the molar inflow rate of CH4,
  is the measured steady state CH4 conversion fraction.
  is the LHV of species X,
  , is the measured plasma input power using Lissajous curve,
  is the power required to heat the gas to the reactor inlet temperature. The ECE values are higher for the PC case and reach almost 100% for the NR and NC materials. Again NC materials show slightly better ECE than NR materials starting at 200°C, the difference narrows down with increase in temperature.
 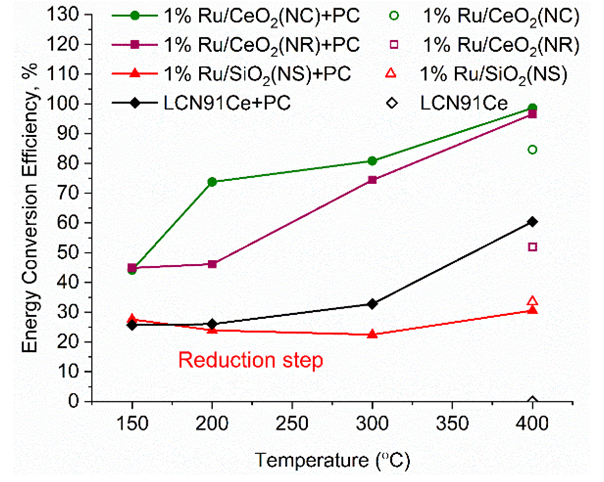 | Figure 12. Energy Conversion Efficiencies (ECE) for the different nanomaterials with and without plasma. (Color lines seen in online version only) |
3.5. Carbon Deposition
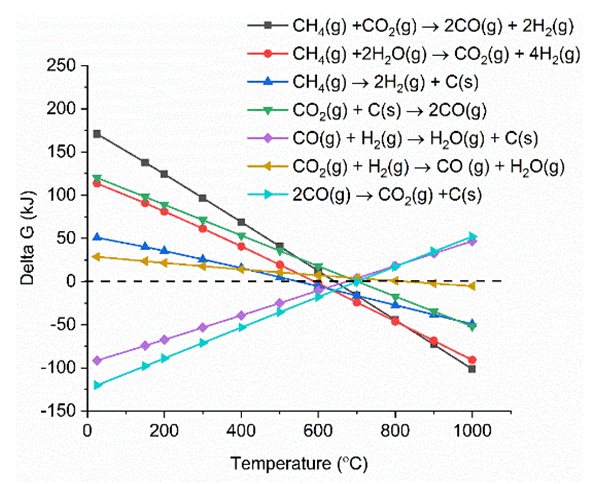
- The carbon deposited during the reduction step is seen as CO2 and CO generation during the oxidation step. Fig. 13 shows the integrated total carbon deposited during the reduction step normalized with the total carbon flow during the reduction step. It is found that carbon deposition is in the range 0.05% - 0.35%. The Gibbs free energy of 7 reactions leading to carbon deposition, are plotted vs. temperature in Fig. 14. We find that only two reactions (Eqns. 10 & 11 below) are active below ~600°C for carbon deposition involving CO. These reactions have an exothermic enthalpy of reaction of -133 kJ/mole and -173 kJ/mole, respectively. Since there is greater extent of reforming to CO with plasma, carbon deposition due to these reactions is found to increase with the application of plasma. We find slightly higher carbon deposition for the NR as compared to NC materials for both with and without plasma cases.
 | (10) |
 | (11) |
 | Figure 13. Carbon Deposition vs. Temperature for different materials (PC- with Plasma). (Color lines seen in online version only) |
 | Figure 14. Gibbs free energy calculation of reactions leading to Carbon deposition at different temperatures. (Color lines seen in online version only) |
4. Discussion
- Plasma-catalytic chemical looping reforming and water splitting over NR, NC, NS, and Ni-based perovskite catalysts was investigated from 150°C to 400°C. These materials represent different nanoshapes, and levels of oxygen mobility. The molar ratio of the catalytic active components such as Ni and Ru in 200 mg of the tested CL materials – Ni based perovskite, NR, NC, NS, are in the ratio 17.2: 1: 1: 1. The surface area per unit volume of NR and NC are approximately in the ratio 3:1 based on HRTEM and TEM imaging. Without plasma, the redox reaction activity was only observed at 400°C for most materials. However, for PC-CLRWS, significantly enhanced conversion and yields was observed for the NR and NC samples compared to other materials during the reduction step at all temperatures. The NR and NC samples exhibited slightly better CH4 reforming activity than other materials. For example, NR and NC materials showed CO, H2 yield in the range of 3-18% while the Ni based perovskite showed yields in the range of 2-7% showing significant enhancements due to nanoshape effects of CeO2 Oxygen Carrier (OC). Application of non-equilibrium plasma creates additional highly reactive unstable species and radicals. For example, in our case (see Fig. 15), plasma can dissociate CO2 to form CO and O atoms, H2O to OH and H radicals, CH4 to CHx and H radicals. This can accelerate the heterogeneous mechanisms while inducing many more pathways towards final products. The high concentrations of reactive radicals with plasma can take complete advantage of higher surface area nanoshape materials for synergistic effects. Slight differences in reactivity and selectivity are noticed between the NR and NC materials. We find that the NC material leads to slightly higher H2 yield (Fig. 6b), CO2 conversion (Fig. 7b) than NR material during the reduction step. The NR material has slightly higher carbon deposition compared to NC (Fig. 13). Several studies on surface chemistry of NR and NC materials have been done in literature (see reviews [44,45]) using probe molecules such as CO, H2O, CO2, methanol, acetaldehyde, toluene, ethanol, Water Gas Shift (WGS) reactions etc. It is generally observed that the NRs expose more stable and less reactive (111) planes, while the NCs expose less stable and more reactive (100) planes. However, the NRs can have higher density of oxygen vacancies. The oxygen vacancy formation energy is lesser for the NCs exposing (100) planes. The surface orientation along with the defects, enhanced oxygen transport, Oxygen Storage Capacity (OSC) together play an important role in catalytic selectivity and reactivity. The interaction between OH and CO radicals was found to be stronger per m2 for NCs, leading to formation of more formates and carbonates on the surface, through interaction with the oxygen vacancies. The carbonates formed on surface include unidentate, bidentate, bridged and polydentate species [46]. WGS reaction of CO with surface hydroxyl groups accounted for 50% of the CO2 produced at lower temperatures [47]. The O atom transfer from CeO2 to the metal catalyst interface played an important role in oxidation of surface carbon deposition, especially at temperatures above 300°C [48]. CH4 is found to be activated at the Ru-O-Ce interface [43] followed by oxidation of CHx by H abstraction reactions due to O atom transfer from CeO2 support to the interface. The produced H atom can spillover to the support CeO2 and react with CO2 leading to CO+ OH or it can take an O atom from support to form highly reactive OH radicals. The OH can in turn diffuse towards CHx radicals and participate in H abstraction [49] reactions leading to combustion of CHx radicals to CO or CO2 products. During reduction step, the availability of H radical from plasma and the spillover effect of CHx radical reacts with remaining CO2, which gets adsorbed to the surface. The reaction produces CO(s) and OH(s) as reported by Liu et al. [43] and Guo et al. [48]. Further, OH(s) reacts with H(s) to produce H2O(s), which desorbs to gas phase H2O. The adsorbed H(s) can react together to produce H2(s), which desorbs as H2 gas. Based on this analysis of literature studies on hydrocarbon reactions, a heterogeneous reaction mechanism is proposed in Fig. 15 for both reduction and oxidation steps. The higher H2 production during reduction step, in the case of NC materials may be because of better activation of CH4, faster H spillover effects. The slightly higher carbon deposition with NR materials may be because the SMSI for O atom mobility and H spillover is lower in these materials. One of the important effects that catalyst can have on plasma is the formation of enhanced local electric fields due to the fine corners and edges of nanoshaped catalysts, which can also result in the improved performance [50]. The combined effect of nanoshaped catalyst, SMSI and plasma may have resulted in the improvement of the reforming process using Ru/CeO2 in comparison to Ni-based perovskite. 1Ru/SiO2 NS is known [51] to produce CO2 as a primary product during partial oxidation of CH4. This could also be a reason for producing less CO in the dry reforming process in our case. Besides, it is neither an oxygen carrier nor possesses oxygen mobility.
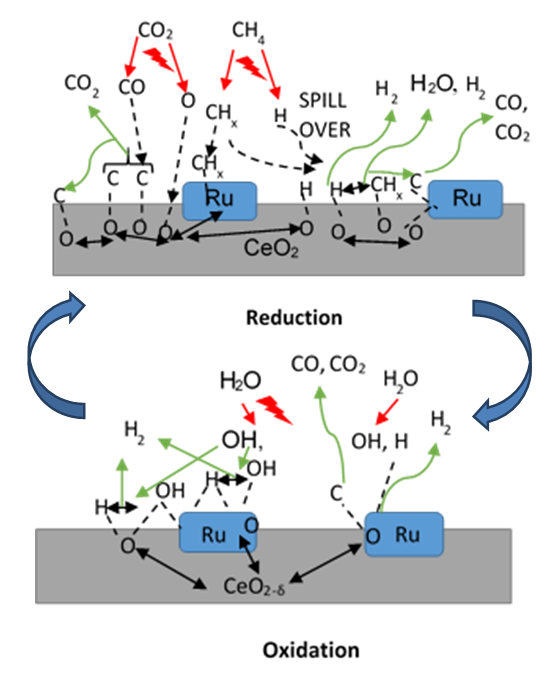 | Figure 15. Schematic of possible plasma-catalysis heterogeneous reaction mechanisms. Red lines show plasma generation of species, green lines show formation of gas phase and adsorption ready species, black lines show adsorption interaction, surface reactions and oxygen ion diffusion. (Color lines seen in online version only) |
5. Conclusions
- It is found that the different nanoshaped ceria and SiO2 supported Ru catalysts perform differently with respect to chemical looping reforming coupled with water splitting. In the presence of non-equilibrium plasma, significantly higher CH4 reforming is noticed at low temperatures (150-400°C) for ceria nanoshapes. There are some differences noticed in the reactivity and selectivity between the NR and NC materials due to different SMSI behavior of the materials, the crystal facets exposed, vacancy density and the specific surface area. It is proposed that the higher H2 production in the case of NC materials may because of better activation of CH4 and faster H spillover effects on NC materials. The slightly higher carbon deposition with NR materials may be because the SMSI enabling O atom mobility and H spillover is faster in the case of NC materials. The materials are found to be very stable after over 50 redox cycles.
ACKNOWLEDGEMENTS
- This work is supported by the NSF CBET-1856729 and NSF CAT-1657943 grants, and NSF EPSCoR RII-Track-1 Cooperative Agreement OIA-1655280. The first author (Rajagopalan V. Ranganathan) was awarded a Graduate Research Fellowship from NSF EPSCoR.
References
| [1] | K. Zitelman. (2018)."National Association of Regulatory Utility Commissioners. CARBON CAPTURE, U., AND STORAGE: Technology and Policy Status and Opportunities". Retrieved from https://pubs.naruc.org/pub/09B7EAAA-0189-830A-04AA-A9430F3D1192. |
| [2] | U.S. Environmental Protection Agency, LandFill Methane Outreach Program. Basic Information about Landfill Gas. Retrieved from https://www.epa.gov/lmop/basic-information-about-landfill-gas. |
| [3] | Lavoie, J.-M. (2014). "Review on dry reforming of methane, a potentially more environmentally-friendly approach to the increasing natural gas exploitation." Front Chem, 2, 81-81. |
| [4] | Arora, S., and Prasad, R. (2016). "An Overview on Dry Reforming of Methane: Strategies to Reduce Carbonaceous Deactivation of Catalysts." RSC Adv., 6. |
| [5] | Er-rbib, H., Bouallou, C., and Werkoff, F. (2012). "Production of Synthetic Gasoline and Diesel Fuel from Dry Reforming of Methane." Energy Procedia, 29, 156-165. |
| [6] | Shi, L., Yang, G., Tao, K., Yoneyama, Y., Tan, Y., and Tsubaki, N. (2013). "An Introduction of CO2 Conversion by Dry Reforming with Methane and New Route of Low-Temperature Methanol Synthesis." Accounts of Chemical Research, 46(8), 1838-1847. |
| [7] | Balasubramanian, B., Lopez Ortiz, A., Kaytakoglu, S., and Harrison, D. P. (1999). "Hydrogen from methane in a single-step process." Chemical Engineering Science, 54(15), 3543-3552. |
| [8] | Zhao, Z., Uddi, M., Nikolay, T., Yildiz, B., and Ghoniem, A. (2016). "Redox Kinetics Study of Fuel Reduced Ceria for Chemical-Looping Water Splitting." The Journal of Physical Chemistry C, 120. |
| [9] | Ranganathan, R. V., Jony, B., Fondriest, S. M., Liu, Z., Wang, R., and Uddi, M. (2019). "Plasma-catalysis chemical looping CH4 reforming with water splitting using ceria supported Ni based La-perovskite nano-catalyst." Journal of CO2 Utilization, 32, 11-20. |
| [10] | Luo, M., Yi, Y., Wang, S., Wang, Z., Du, M., Pan, J., and Wang, Q. (2018). "Review of hydrogen production using chemical-looping technology." Renewable and Sustainable Energy Reviews, 81, 3186-3214. |
| [11] | Fan, L. S. (2010). "Introduction." Chemical Looping Systems for Fossil Energy Conversions. |
| [12] | Adánez, J., de Diego, L. F., García-Labiano, F., Gayán, P., Abad, A., and Palacios, J. M. (2004). "Selection of Oxygen Carriers for Chemical-Looping Combustion." Energy & Fuels, 18(2), 371-377. |
| [13] | Tang, M., Xu, L., and Fan, M. (2015). "Progress in oxygen carrier development of methane-based chemical-looping reforming: A review." Applied Energy, 151, 143-156. |
| [14] | Gupta, P., Li, F., Velázquez-Vargas, L., Sridhar, D., Iyer, M., Ramkumar, S., and Fan, L. S. (2010). "Chemical Looping Particles." Chemical Looping Systems for Fossil Energy Conversions. |
| [15] | Whitehead, J. C. (2019). "Plasma-catalysis: Is it just a question of scale?" Frontiers of Chemical Science and Engineering, 13(2), 264-273. |
| [16] | Neyts, E. C. (2016). "Plasma-Surface Interactions in Plasma Catalysis." Plasma Chemistry and Plasma Processing, 36(1), 185-212. |
| [17] | Zhang, Z., Li, J., Gao, W., Ma, Y., and Qu, Y. (2015). "Pt/porous nanorods of ceria as efficient high temperature catalysts with remarkable catalytic stability for carbon dioxide reforming of methane." Journal of Materials Chemistry A, 3(35), 18074-18082. |
| [18] | Montini, T., Melchionna, M., Monai, M., and Fornasiero, P. (2016). "Fundamentals and catalytic applications of CeO2-based materials." Chemical reviews, 116(10), 5987-6041. |
| [19] | Sun, C., Li, H., and Chen, L. (2012). "Nanostructured ceria-based materials: synthesis, properties, and applications." Energy & Environmental Science, 5(9), 8475-8505. |
| [20] | Mock, S. A., Sharp, S. E., Stoner, T. R., Radetic, M. J., Zell, E. T., and Wang, R. (2016). "CeO2 nanorods-supported transition metal catalysts for CO oxidation." Journal of Colloid and Interface Science, 466, 261-267. |
| [21] | He, L., Ren, Y., Fu, Y., Yue, B., Tsang, S. C. E., and He, H. (2019). "Morphology-Dependent Catalytic Activity of Ru/CeO₂ in Dry Reforming of Methane." Molecules, 24(3), 526. |
| [22] | Safariamin, M., Tidahy, L. H., Abi-Aad, E., Siffert, S., and Aboukaïs, A. (2009). "Dry reforming of methane in the presence of ruthenium-based catalysts." Comptes Rendus Chimie, 12(6), 748-753. |
| [23] | Li, J., Liu, Z., and Wang, R. (2018). "Support structure and reduction treatment effects on CO oxidation of SiO2 nanospheres and CeO2 nanorods supported ruthenium catalysts." Journal of Colloid and Interface Science, 531, 204-215. |
| [24] | Whitehead, J. C. (2016). "Plasma–catalysis: the known knowns, the known unknowns and the unknown unknowns." Journal of Physics D: Applied Physics, 49(24), 243001. |
| [25] | Kim, H.-H., Teramoto, Y., Ogata, A., Takagi, H., and Nanba, T. (2016). "Plasma Catalysis for Environmental Treatment and Energy Applications." Plasma Chemistry and Plasma Processing, 36(1), 45-72. |
| [26] | Karakaya, C., and Kee, R. J. (2016). "Progress in the direct catalytic conversion of methane to fuels and chemicals." Progress in Energy and Combustion Science, 55, 60-97. |
| [27] | Wang, R., and Dangerfield, R. (2014). "Seed-mediated synthesis of shape-controlled CeO 2 nanocrystals." RSC Advances, 4(7), 3615-3620. |
| [28] | Gong, H., Li, N., and Qian, Y. (2013). "Synthesis of SiO2/C nanocomposites and their electrochemical properties." Int. J. Electrochem. Sci., 8, 9811-9817. |
| [29] | Weber, W., Hass, K., and McBride, J. (1993). "Raman study of CeO 2: second-order scattering, lattice dynamics, and particle-size effects." Physical Review B, 48(1), 178. |
| [30] | Varga, E., Baán, K., Samu, G. F., Erdőhelyi, A., Oszkó, A., Kónya, Z., and Kiss, J. (2016). "The Effect of Rh on the Interaction of Co with Al 2 O 3 and CeO 2 Supports." Catalysis Letters, 146(9), 1800-1807. |
| [31] | Younis, A., Shirsath, S. E., Shabbir, B., and Li, S. (2018). "Controllable dynamics of oxygen vacancies through extrinsic doping for superior catalytic activities." Nanoscale, 10(39), 18576-18585. |
| [32] | Derevyannikova, E., Kardash, T. Y., Kibis, L., Slavinskaya, E., Svetlichnyi, V., Stonkus, O., Ivanova, A., and Boronin, A. (2017). "The structure and catalytic properties of Rh-doped CeO 2 catalysts." Physical Chemistry Chemical Physics, 19(47), 31883-31897. |
| [33] | Huang, H., Dai, Q., and Wang, X. (2014). "Morphology effect of Ru/CeO2 catalysts for the catalytic combustion of chlorobenzene." Applied Catalysis B: Environmental, 158, 96-105. |
| [34] | He, L., Ren, Y., Fu, Y., Yue, B., Tsang, S. C. E., and He, H. (2019). "Morphology-Dependent Catalytic Activity of Ru/CeO2 in Dry Reforming of Methane." Molecules, 24(3), 526. |
| [35] | Satsuma, A., Yanagihara, M., Ohyama, J., and Shimizu, K. (2013). "Oxidation of CO over Ru/Ceria prepared by self-dispersion of Ru metal powder into nano-sized particle." Catalysis today, 201, 62-67. |
| [36] | Spallino, L., Vaccaro, L., Sciortino, L., Agnello, S., Buscarino, G., Cannas, M., and Gelardi, F. M. (2014). "Visible-ultraviolet vibronic emission of silica nanoparticles." Physical Chemistry Chemical Physics, 16(40), 22028-22034. |
| [37] | Włodarczyk, R., Sierka, M., Sauer, J., Löffler, D., Uhlrich, J., Yu, X., Yang, B., Groot, I., Shaikhutdinov, S., and Freund, H.-J. (2012). "Tuning the electronic structure of ultrathin crystalline silica films on Ru (0001)." Physical Review B, 85(8), 085403. |
| [38] | López, J. M., Gilbank, A. L., García, T., Solsona, B., Agouram, S., and Torrente-Murciano, L. (2015). "The prevalence of surface oxygen vacancies over the mobility of bulk oxygen in nanostructured ceria for the total toluene oxidation." Applied Catalysis B: Environmental, 174, 403-412. |
| [39] | Sharma, P., and Sasson, Y. (2017). "A photoactive catalyst Ru–gC 3 N 4 for hydrogen transfer reaction of aldehydes and ketones." Green Chemistry, 19(3), 844-852. |
| [40] | Mazzieri, V., Coloma-Pascual, F., Arcoya, A., L’Argentière, P., and Fıgoli, N. (2003). "XPS, FTIR and TPR characterization of Ru/Al2O3 catalysts." Applied surface science, 210(3-4), 222-230. |
| [41] | Rabe, S., Nachtegaal, M., and Vogel, F. (2007). "Catalytic partial oxidation of methane to synthesis gas over a ruthenium catalyst: the role of the oxidation state." Physical Chemistry Chemical Physics, 9(12), 1461-1468. |
| [42] | Sun, X., Zhou, S., Yue, L., Schlangen, M., and Schwarz, H. (2019). "Thermal Activation of CH4 and H2 as Mediated by the Ruthenium Oxide Cluster Ions [RuOx]+ (x=1–3): On the Influence of Oxidation States." Chemistry – A European Journal, 25(14), 3550-3559. |
| [43] | Liu, Z., Zhang, F., Rui, N., Li, X., Lin, L., Betancourt, L. E., Su, D., Xu, W., Cen, J., Attenkofer, K., Idriss, H., Rodriguez, J. A., and Senanayake, S. D. (2019). "Highly Active Ceria-Supported Ru Catalyst for the Dry Reforming of Methane: In Situ Identification of Ruδ+–Ce3+ Interactions for Enhanced Conversion." ACS Catalysis, 9(4), 3349-3359. |
| [44] | Agarwal, S., Mojet, B. L., Lefferts, L., and Datye, A. K. (2015). "Chapter 2 - Ceria Nanoshapes—Structural and Catalytic Properties." Catalysis by Materials with Well-Defined Structures, Z. Wu, and S. H. Overbury, eds., Elsevier, Amsterdam, 31-70. |
| [45] | Mann, A. K. P., Wu, Z., and Overbury, S. H. (2015). "Chapter 3 - The Characterization and Structure-Dependent Catalysis of Ceria with Well-Defined Facets." Catalysis by Materials with Well-Defined Structures, Z. Wu, and S. H. Overbury, eds., Elsevier, Amsterdam, 71-97. |
| [46] | Du, H., Williams, C. T., Ebner, A. D., and Ritter, J. A. (2010). "In Situ FTIR Spectroscopic Analysis of Carbonate Transformations during Adsorption and Desorption of CO2 in K-Promoted HTlc." Chemistry of Materials, 22(11), 3519-3526. |
| [47] | Wu, Z., Li, M., and Overbury, S. H. (2012). "On the structure dependence of CO oxidation over CeO2 nanocrystals with well-defined surface planes." Journal of Catalysis, 285(1), 61-73. |
| [48] | Guo, Y., Mei, S., Yuan, K., Wang, D.-J., Liu, H.-C., Yan, C.-H., and Zhang, Y.-W. (2018). "Low-Temperature CO2 Methanation over CeO2-Supported Ru Single Atoms, Nanoclusters, and Nanoparticles Competitively Tuned by Strong Metal–Support Interactions and H-Spillover Effect." ACS Catalysis, 8(7), 6203-6215. |
| [49] | Law, C. K. (2006). Combustion Physics, Cambridge University Press. |
| [50] | Neyts, E. C., Ostrikov, K., Sunkara, M. K., and Bogaerts, A. (2015). "Plasma Catalysis: Synergistic Effects at the Nanoscale." Chemical Reviews, 115(24), 13408-13446. |
| [51] | Yan, Q. G., Wu, T. H., Weng, W. Z., Toghiani, H., Toghiani, R. K., Wan, H. L., and Pittman, C. U. (2004). "Partial oxidation of methane to H2 and CO over Rh/SiO2 and Ru/SiO2 catalysts." Journal of Catalysis, 226(2), 247-259. |